Cash Flow Overview
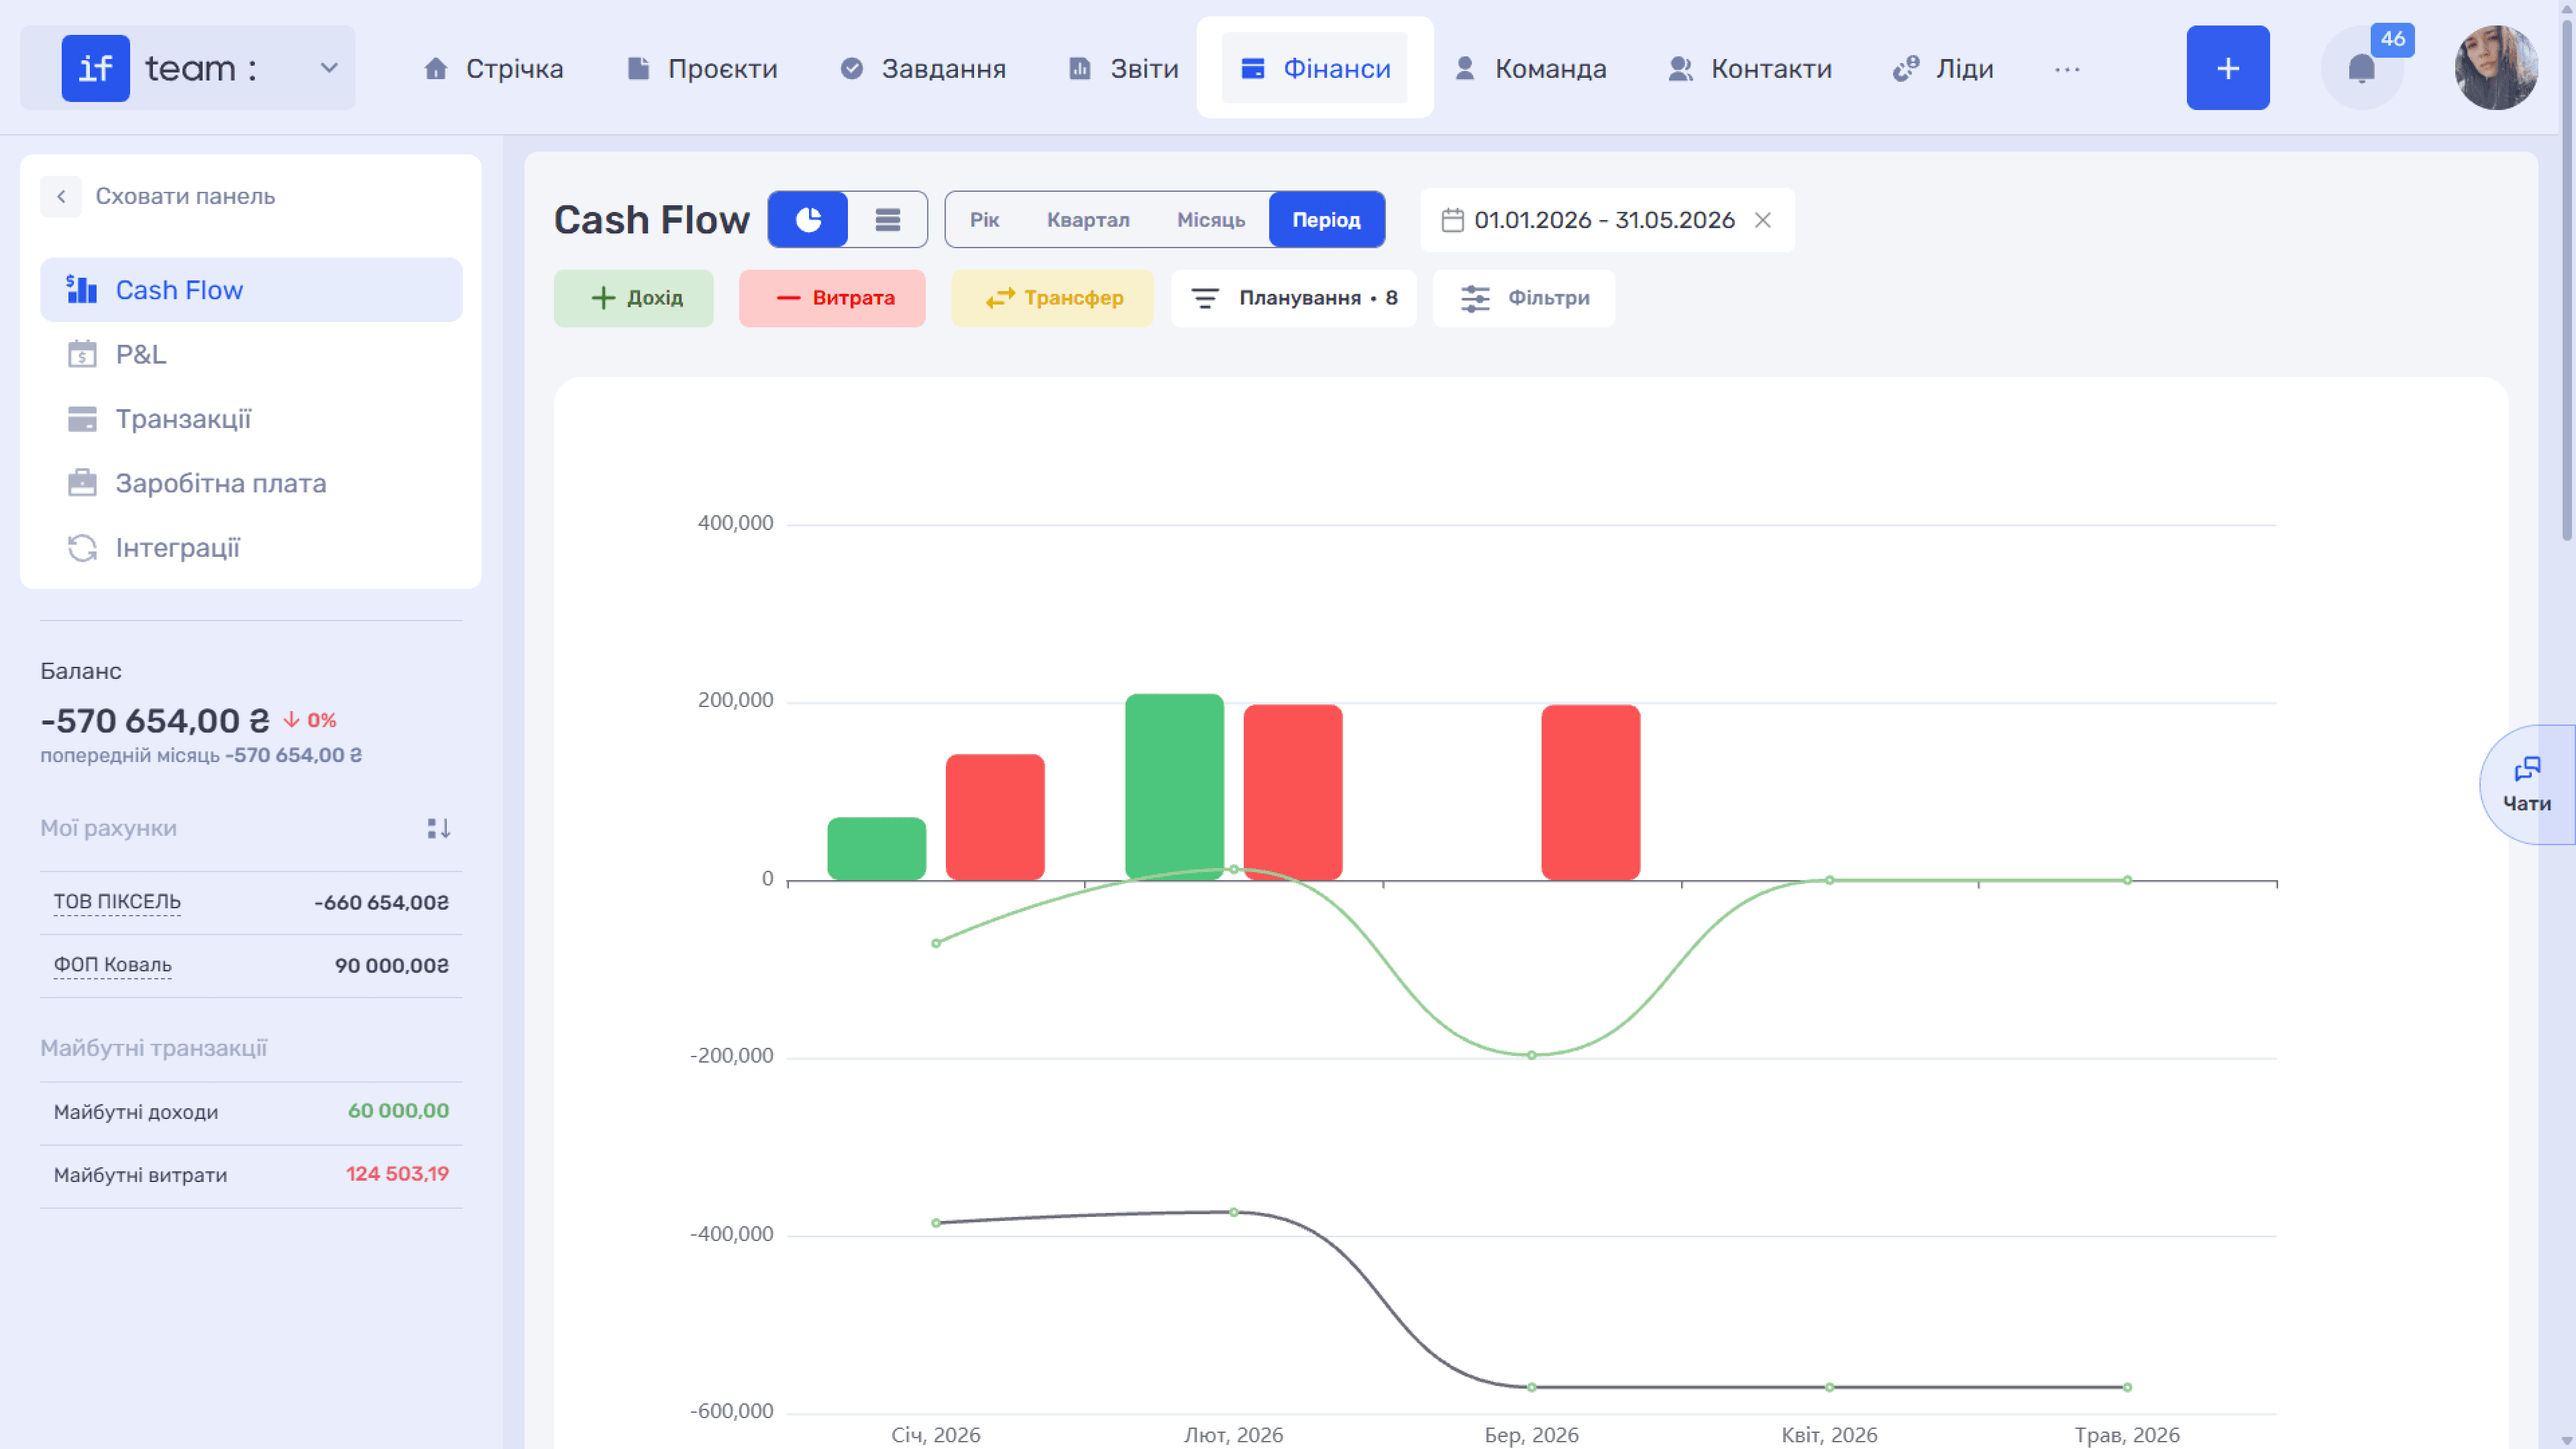
Cash Flow is a report on the company’s cash movement. It is based on actual payments—the cash method—and shows how much money was actually received and spent during a period, how the balance changes, and whether sufficient funds will be available going forward. Open it from the Cash Flow subsection
Views and Periods
Next to the report name is a switch between two views: Chart and Table. They are synchronized and show the same data. Set the period using the Year, Quarter, Month, or Period tabs. Period lets you specify a custom date range, such as January 1 through May 31. Use the ‹ › arrows to move between adjacent periods. The + Income, − Expense, Transfer, Planning, and Filters buttons are also available here.
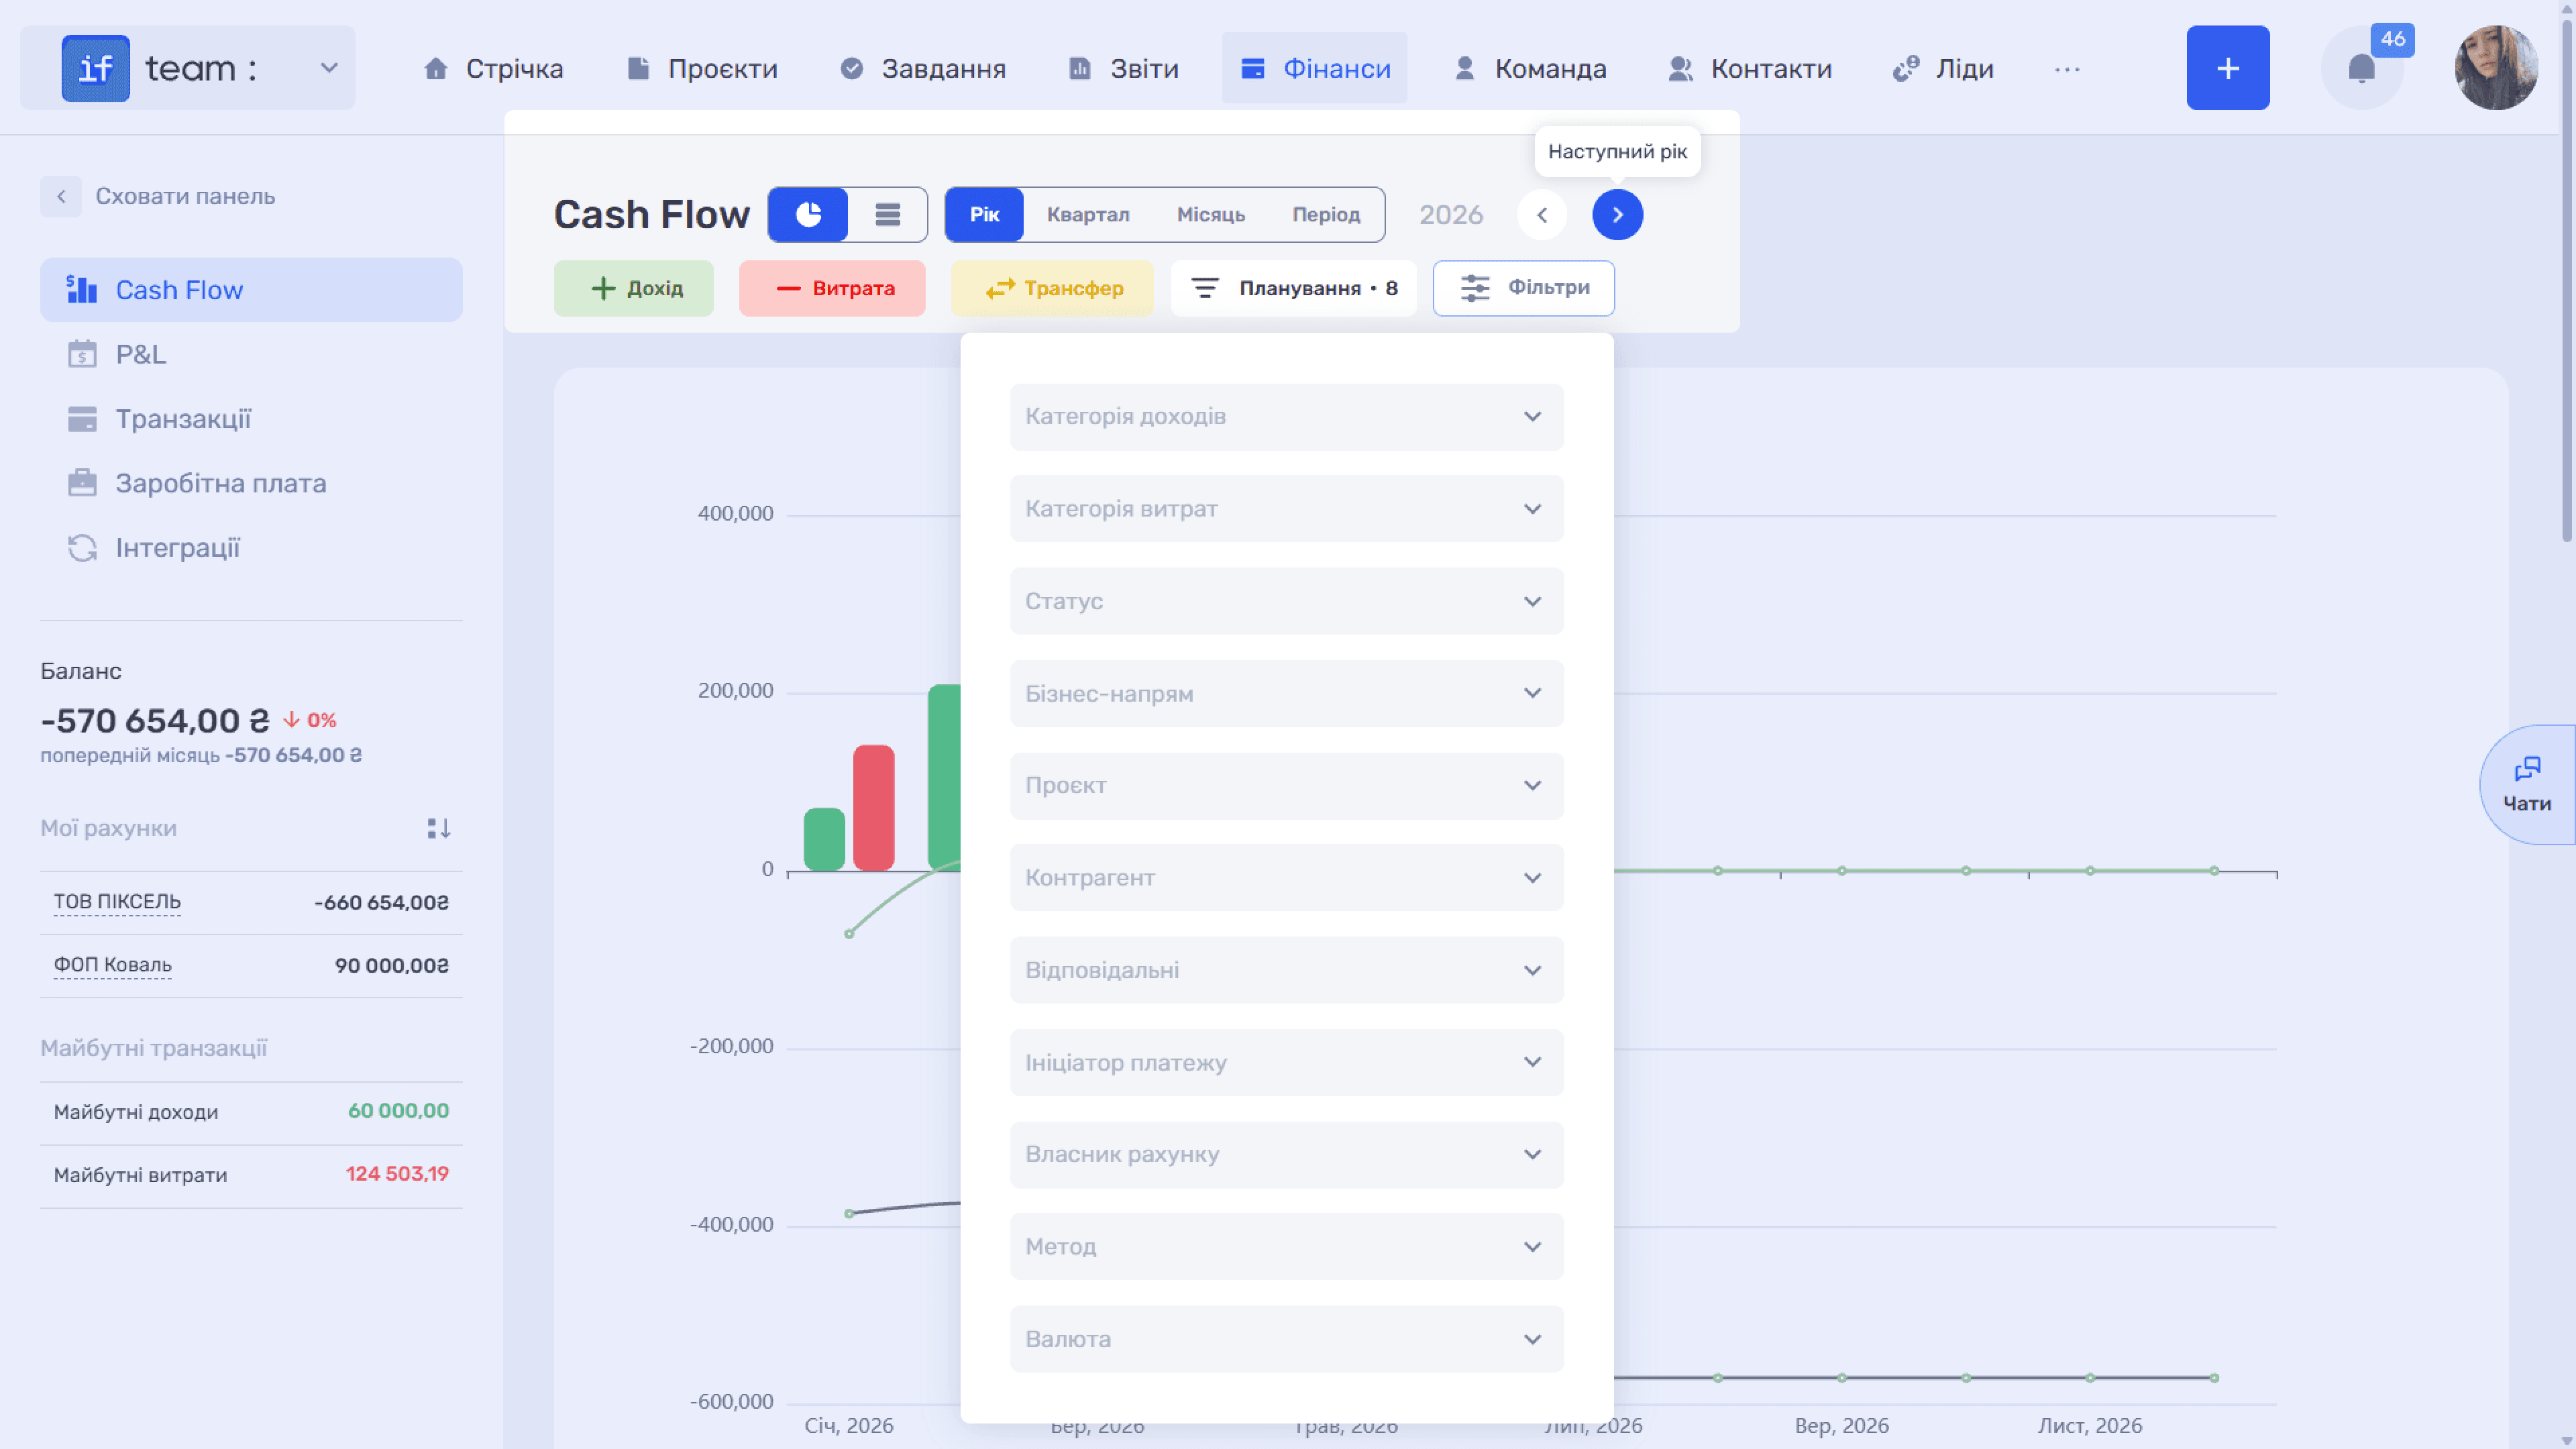
Chart View
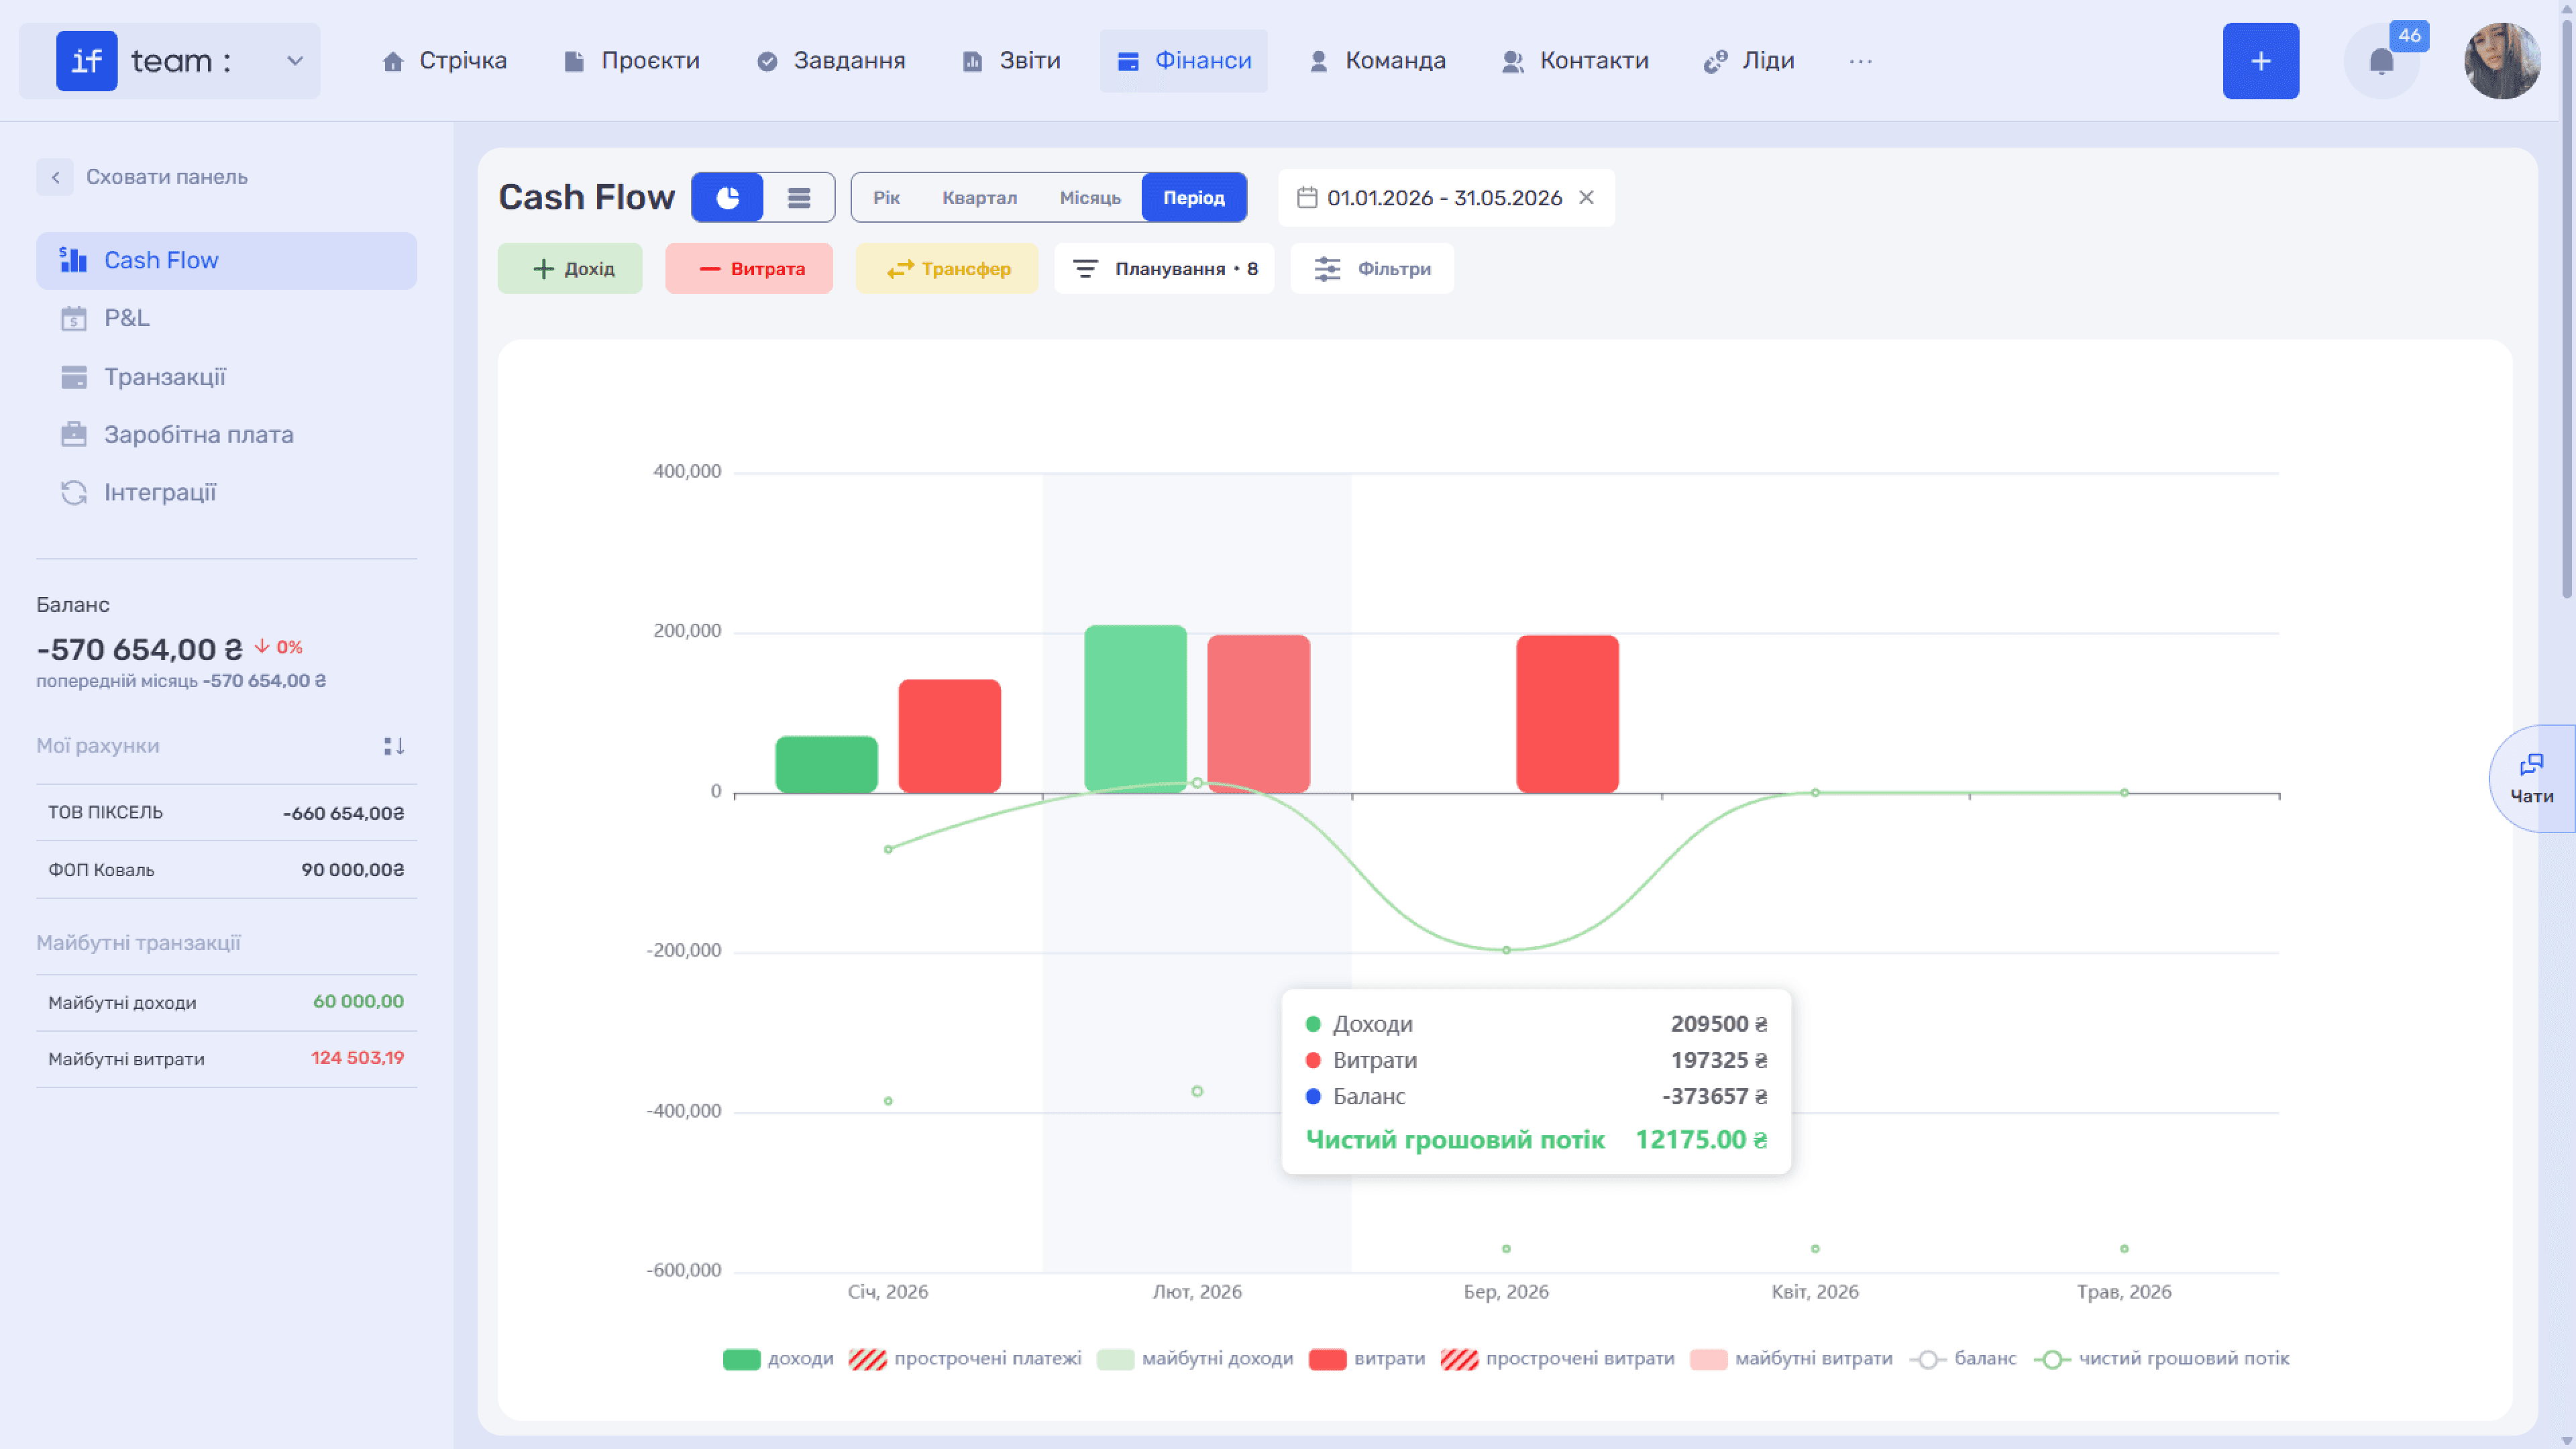
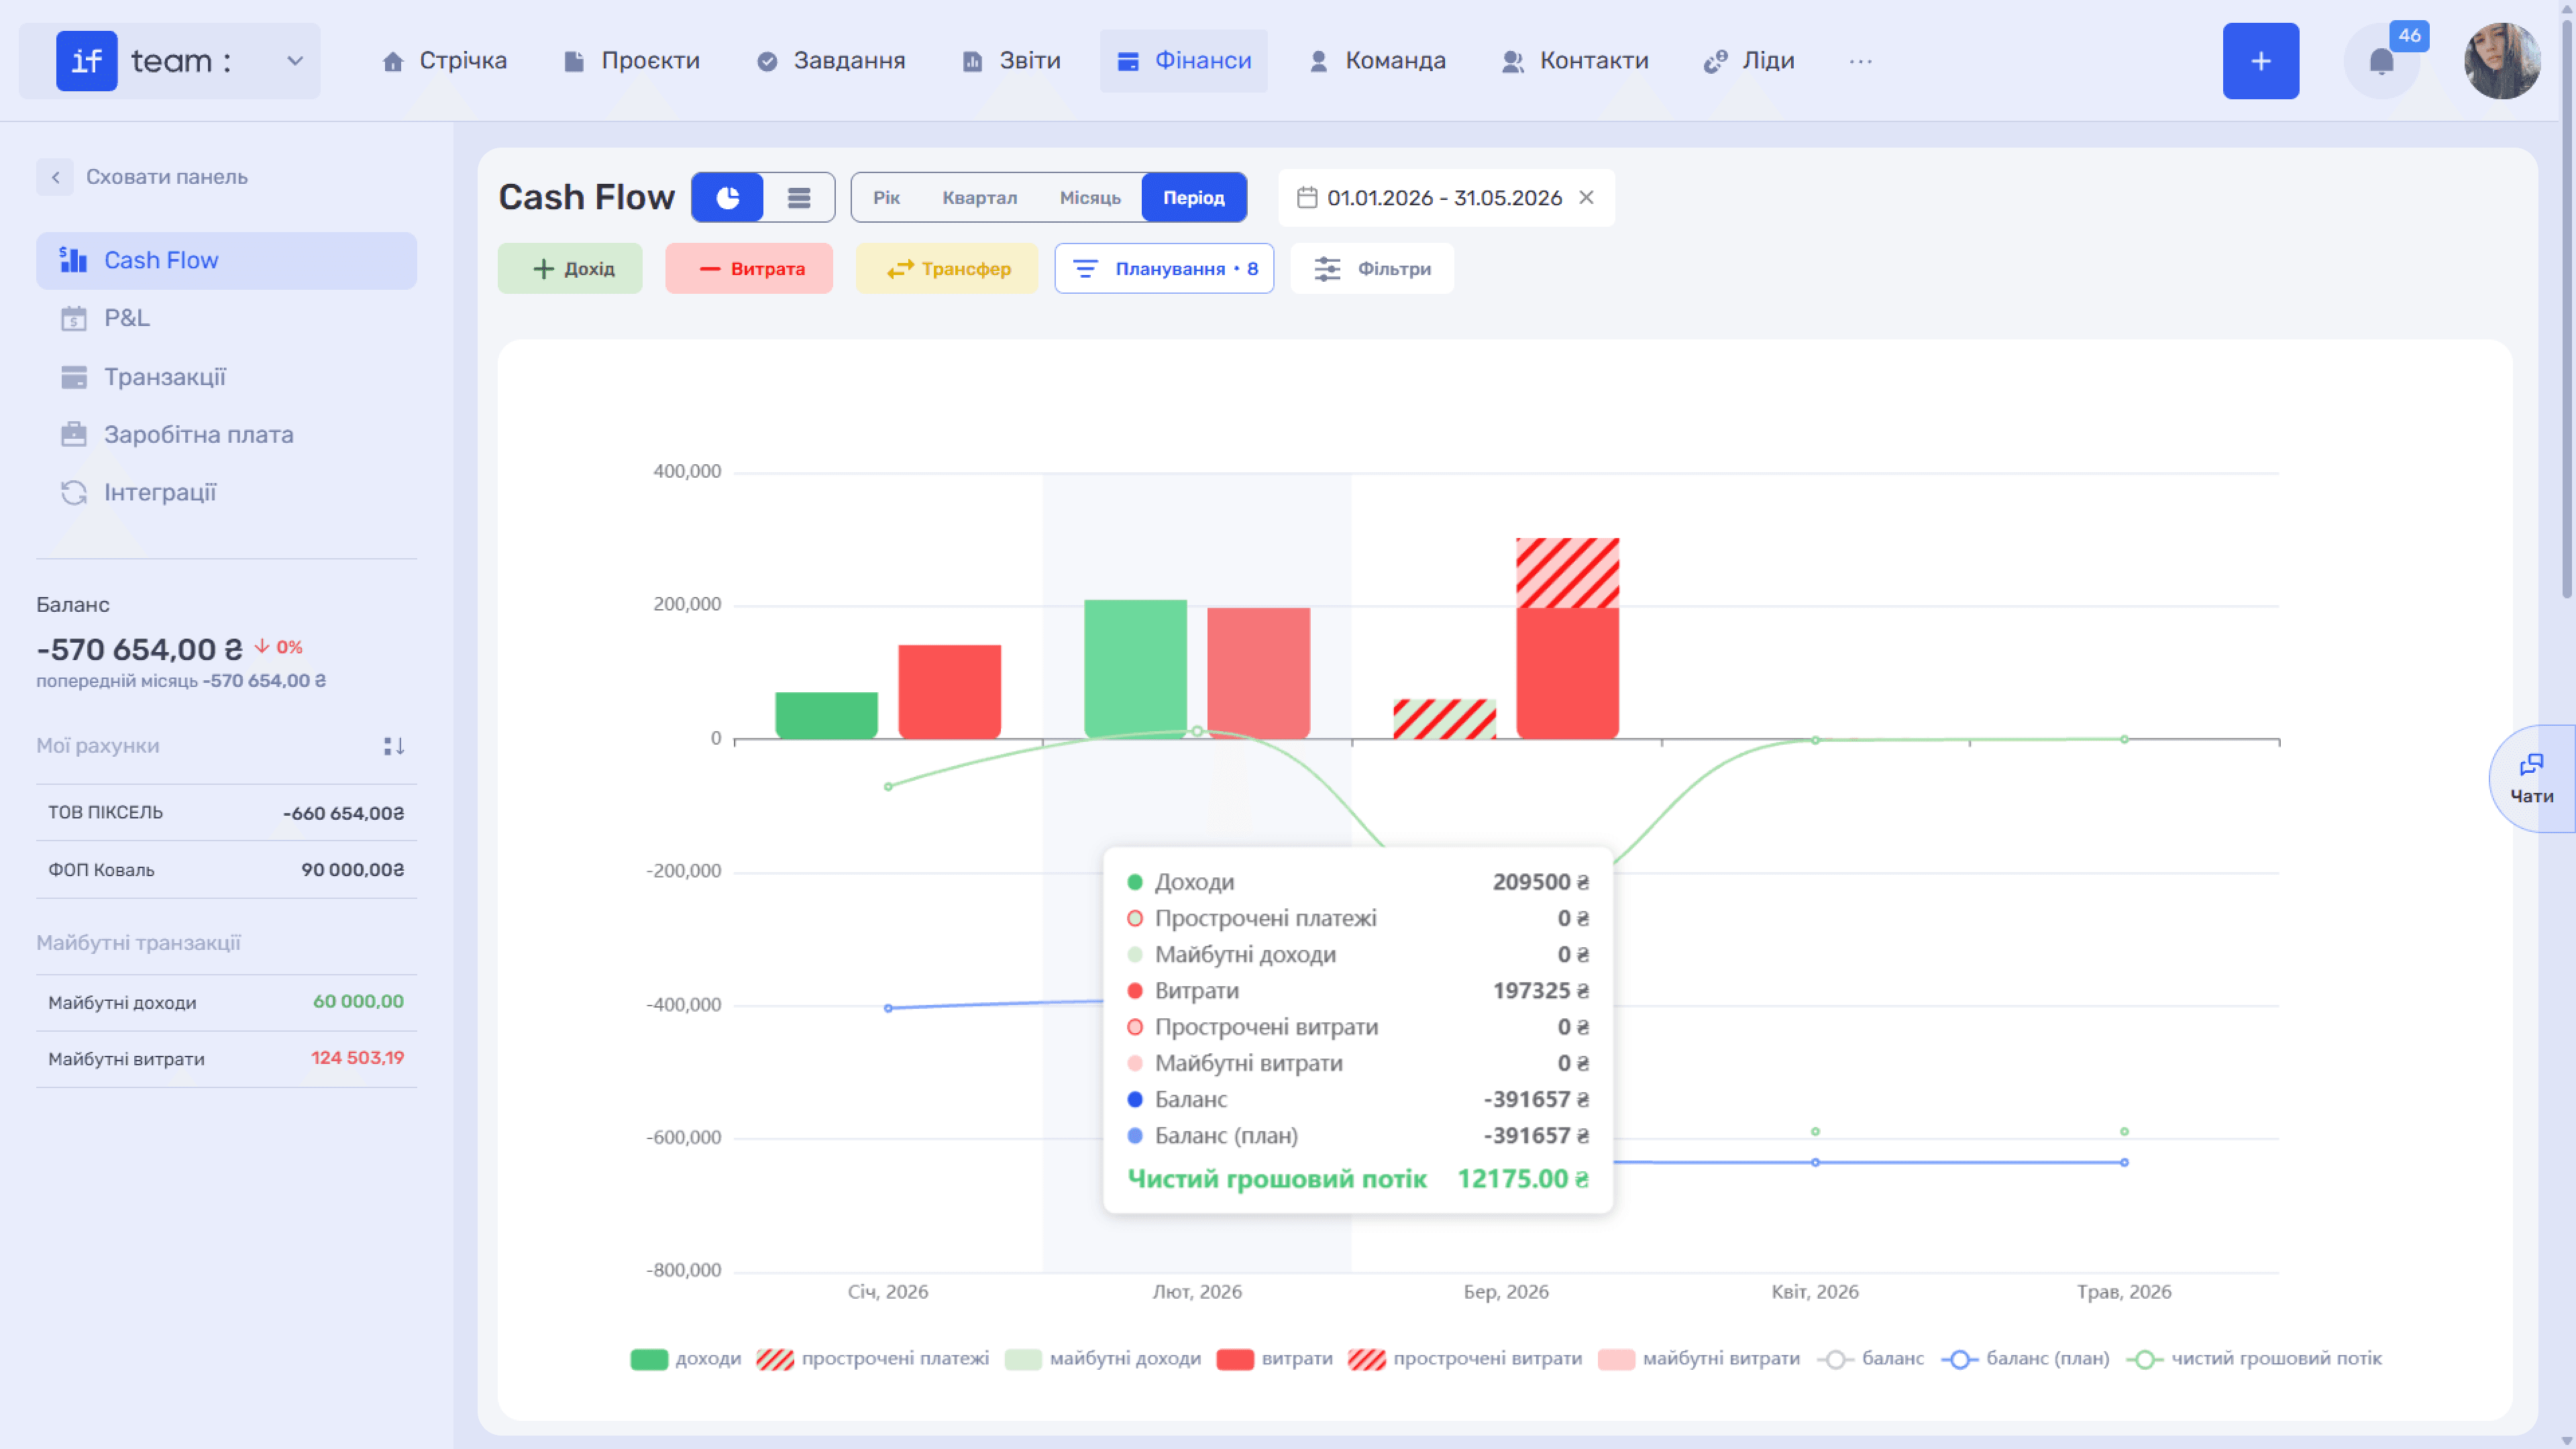
The bar chart shows income in green and expenses in red by month. Three lines are overlaid on the bars: Balance (the actual cash balance), Balance (Plan), and Net Cash Flow.
Planning mode also includes future and overdue transactions. See the next subsection, Cash Flow Planning and Tracking.
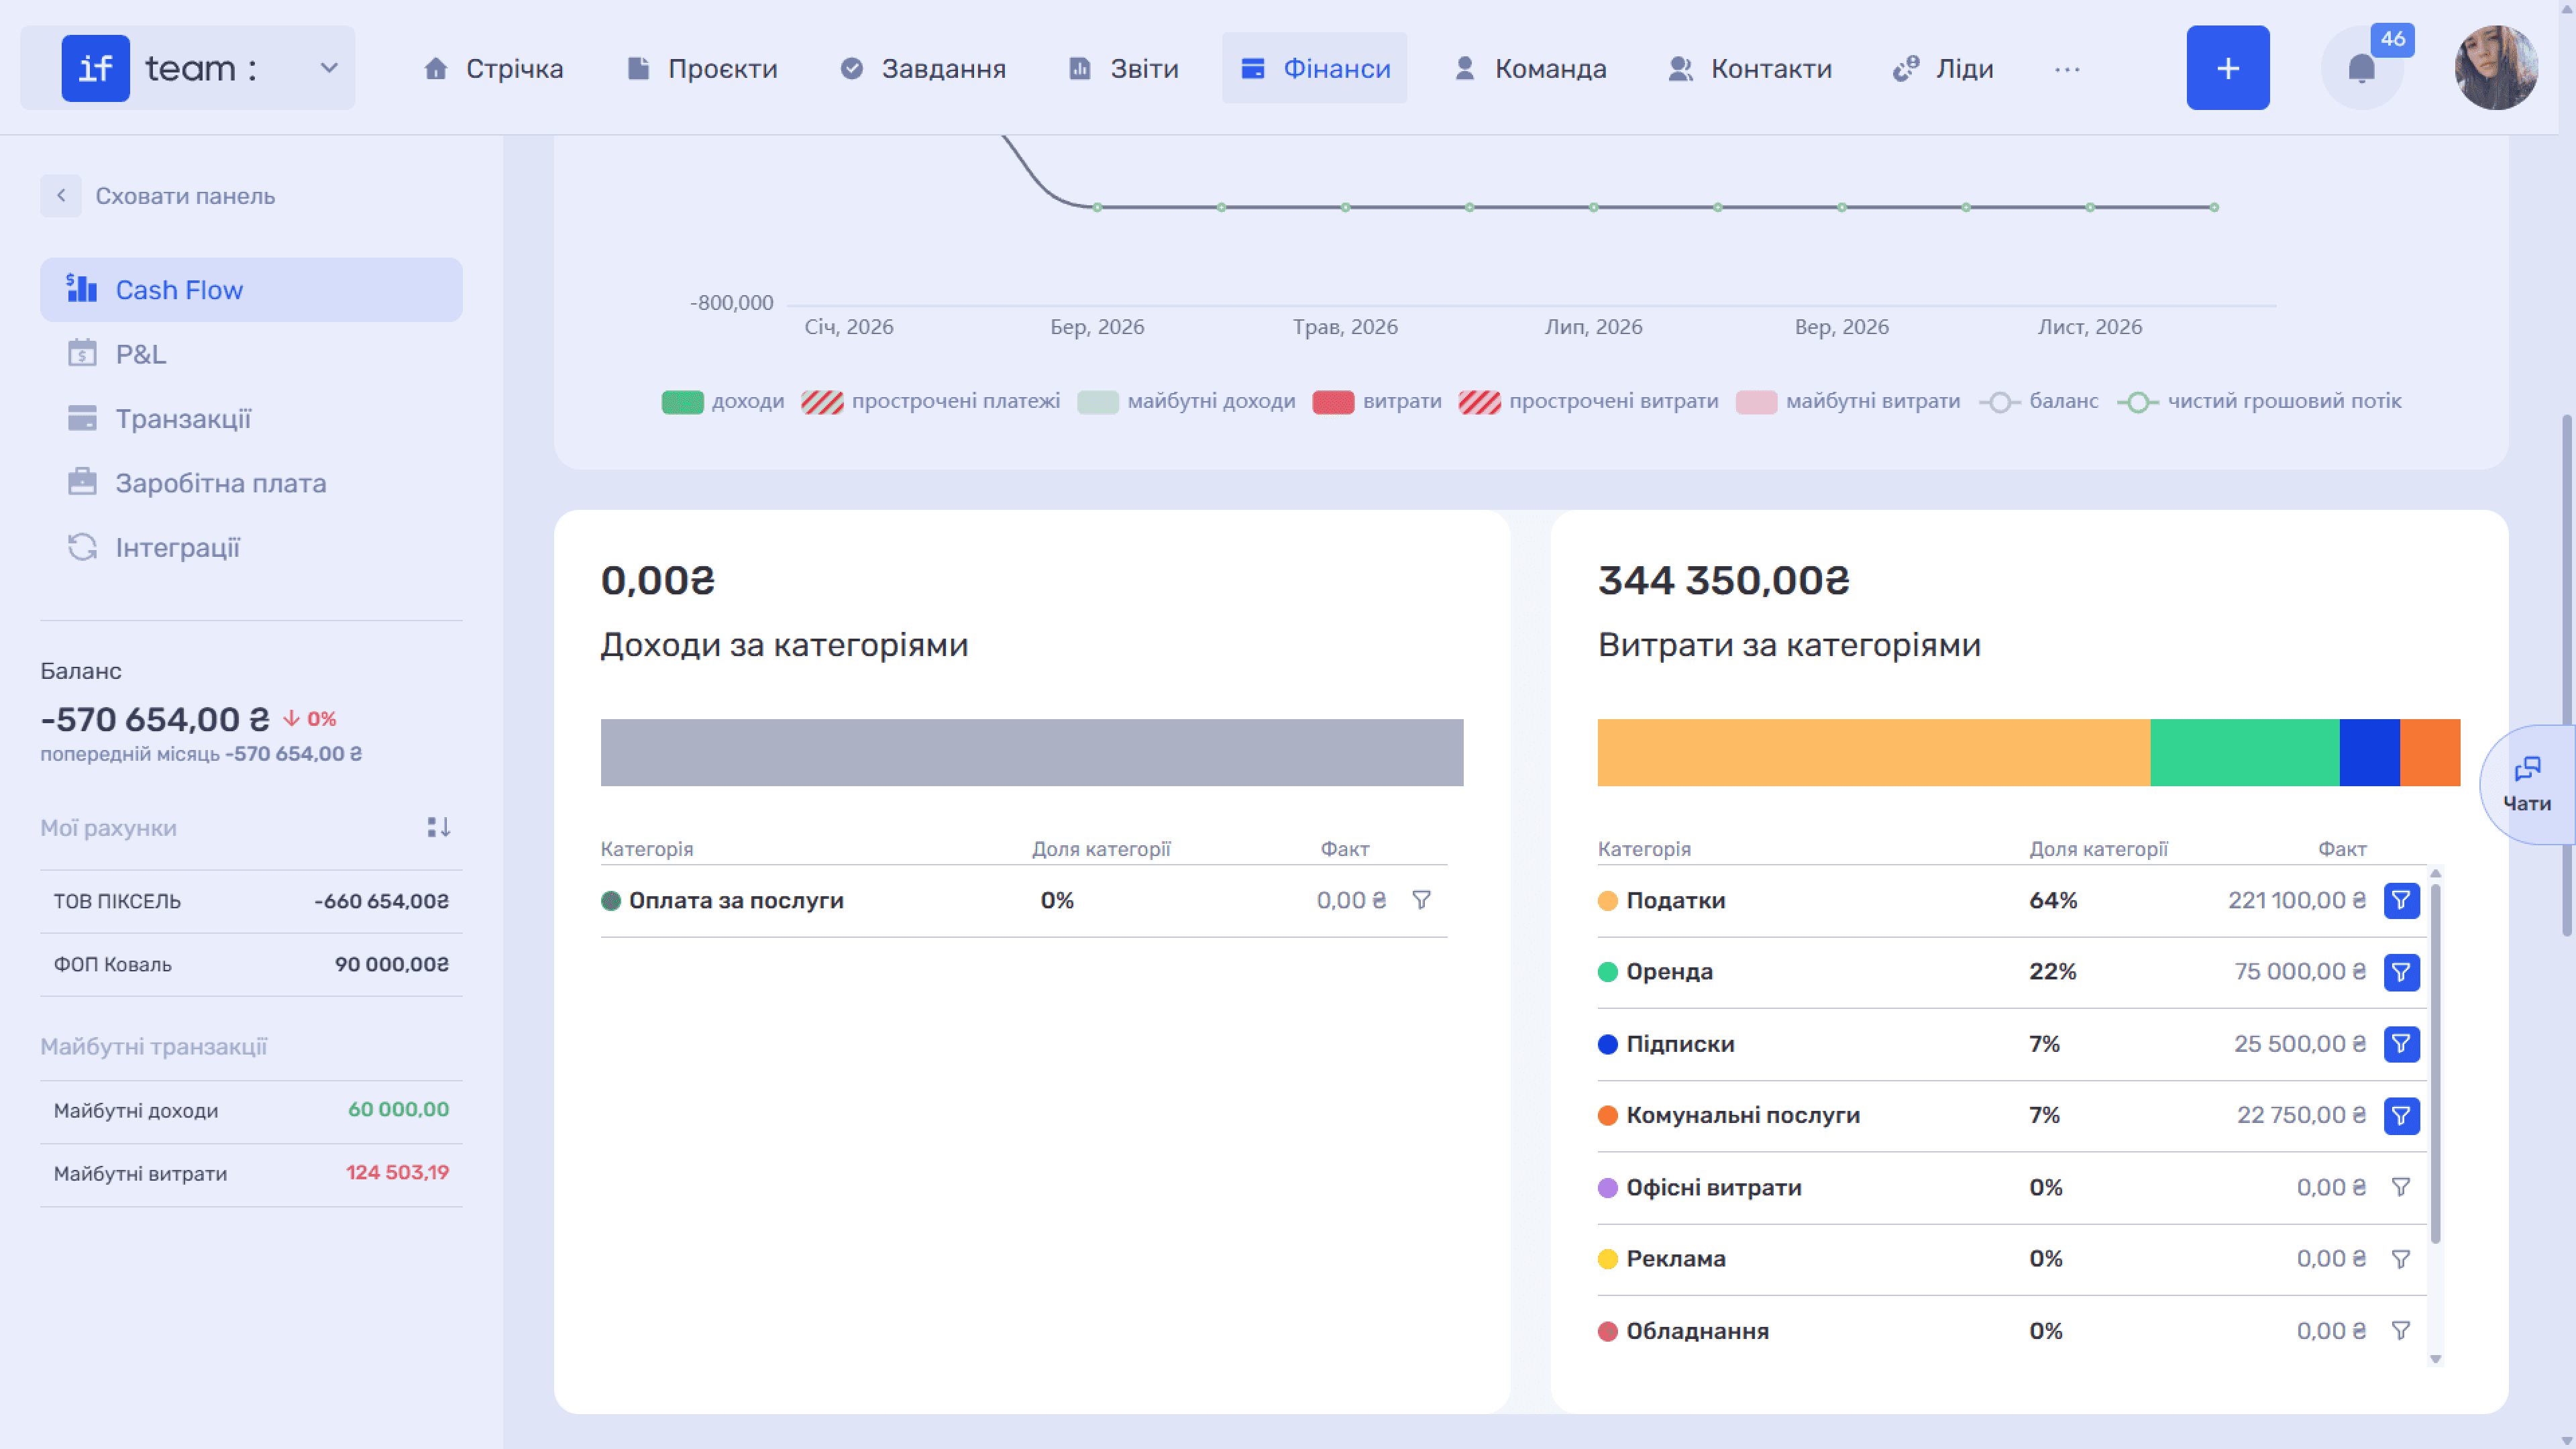
Below the chart are two cards: Income by Category and Expenses by Category. Each card shows the total for the period, each category’s percentage share, and the actual amount. Entries with no category specified appear in a separate Uncategorized row.
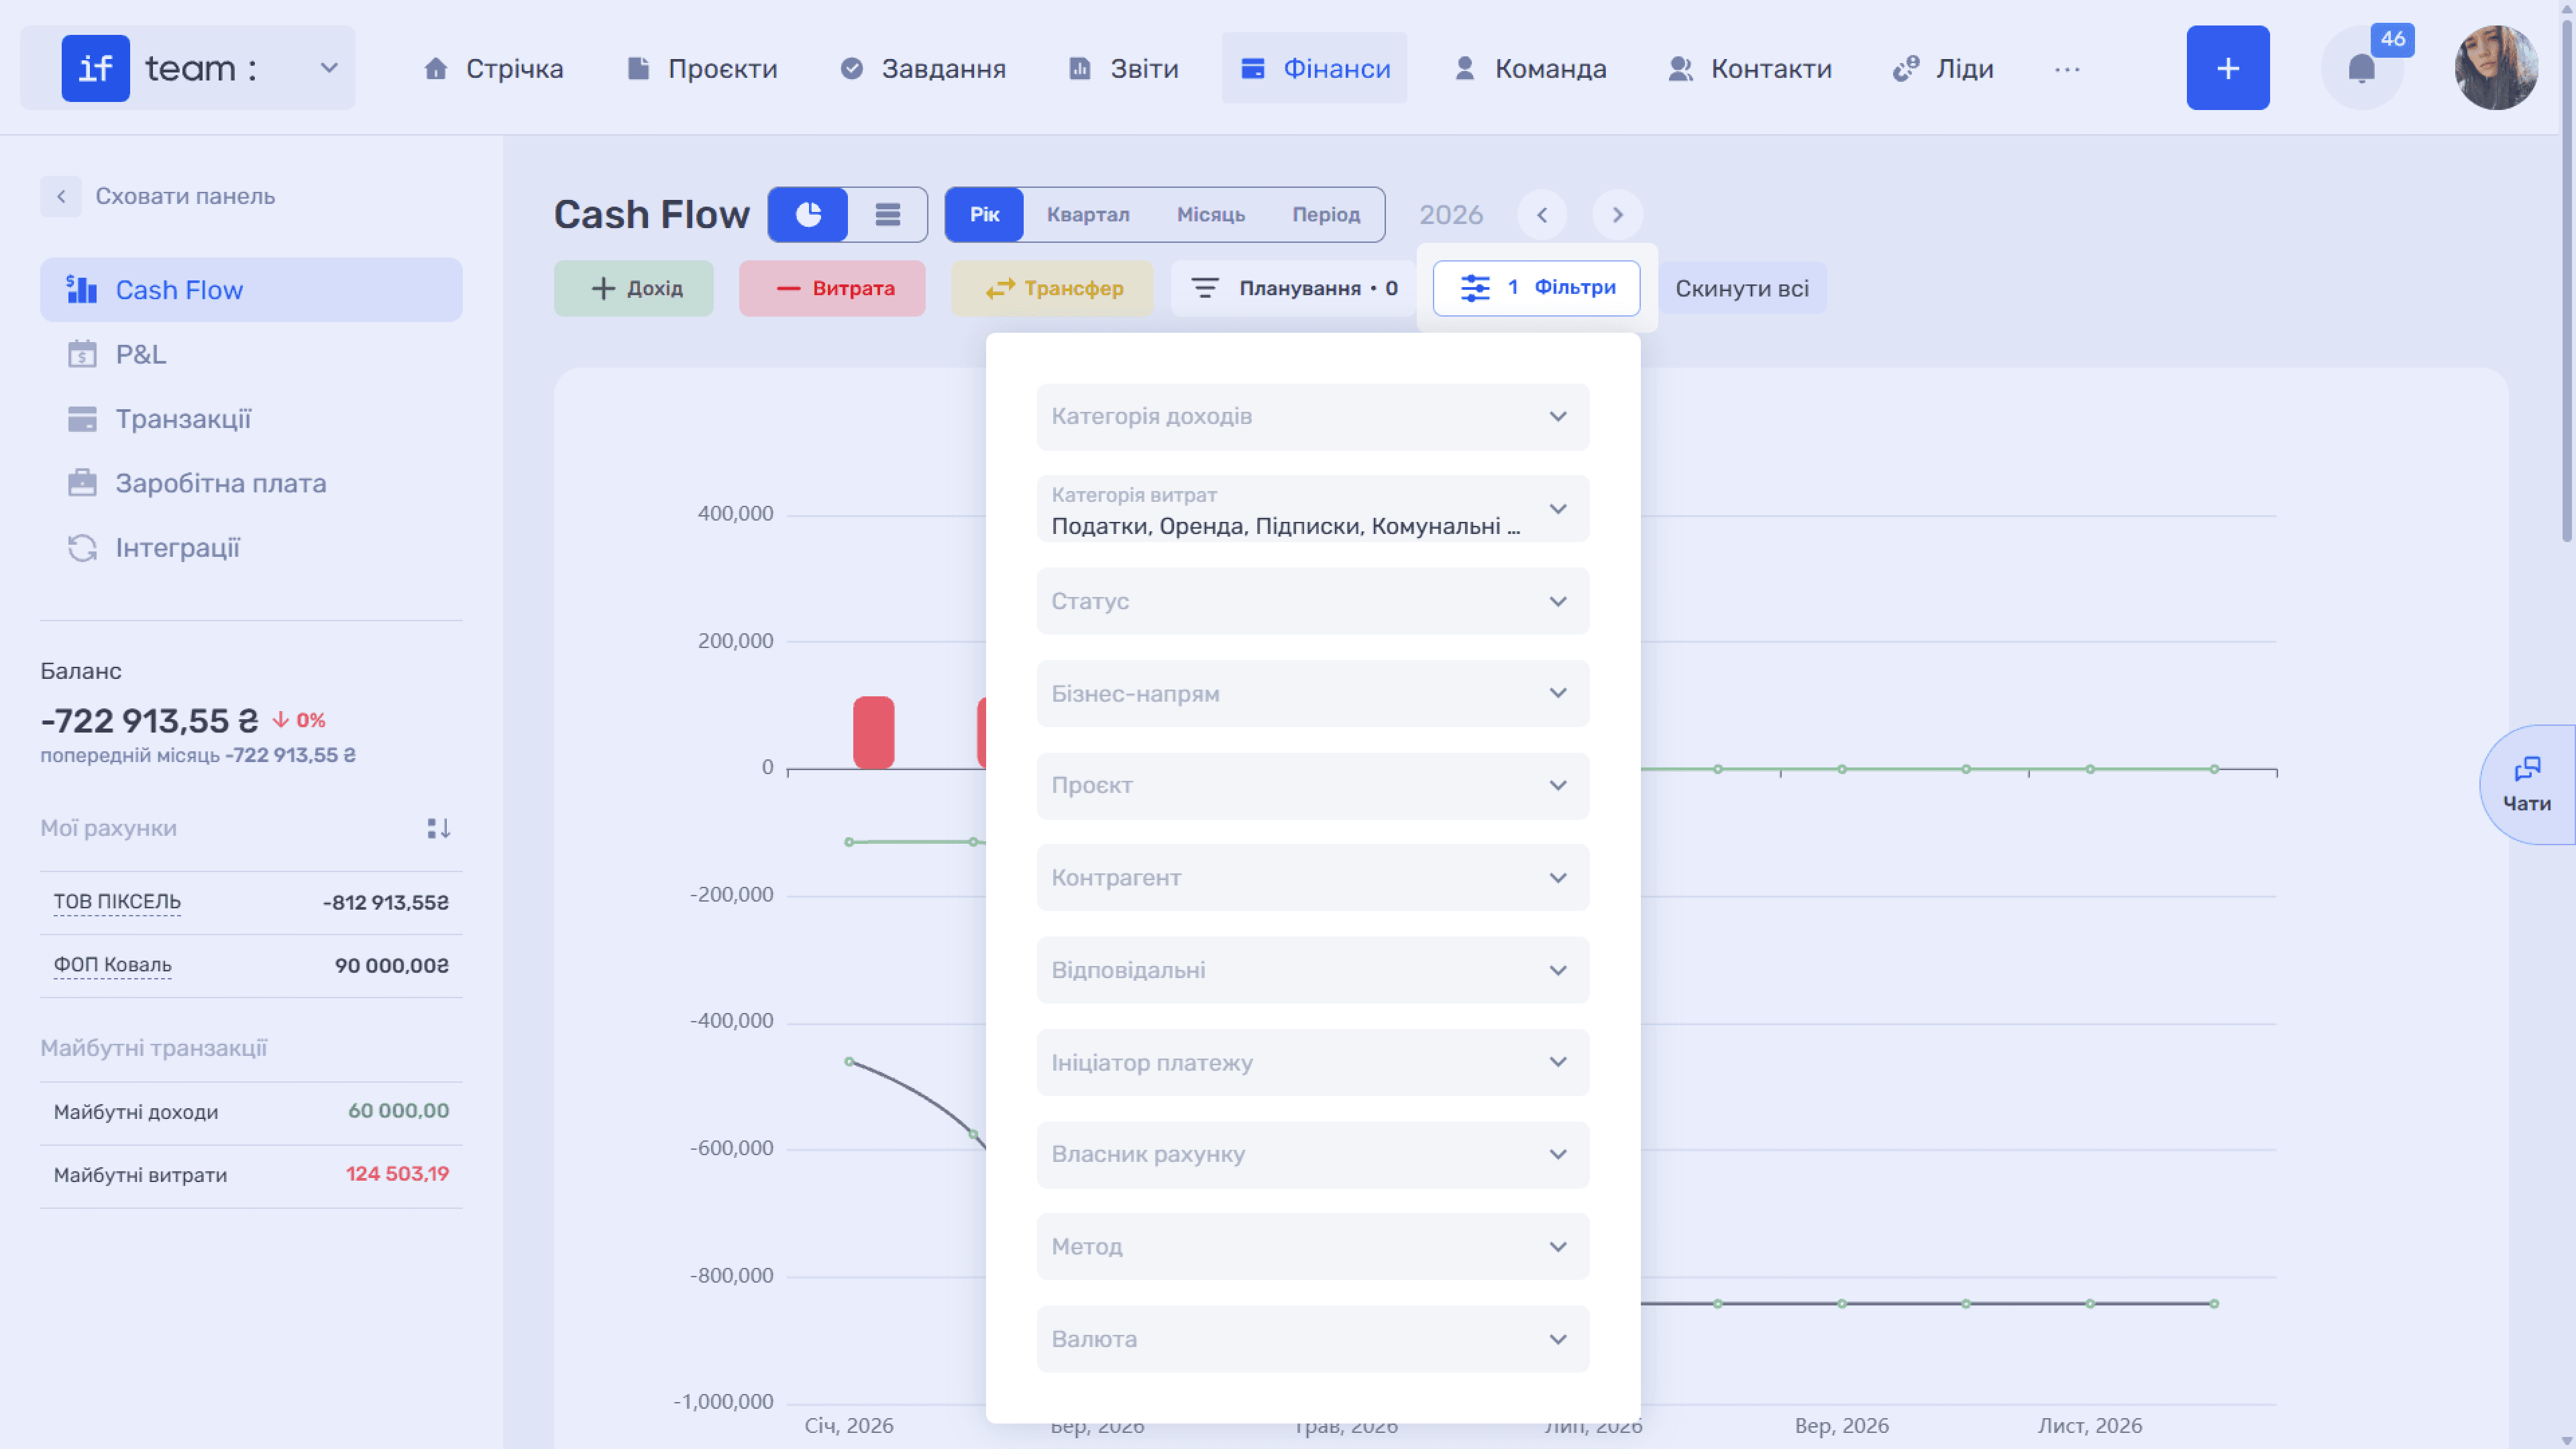
The filter icon next to each category filters transactions to that category with one click and adds it to the Filters panel, which shows the number of active conditions. Filters can be combined: activate the icons next to several categories at once, and they will be highlighted. The chart, both category cards, and the transaction table below are recalculated for the current selection, updating both the amounts and category shares.
To remove a filter, click the highlighted icon on the category card again or click Reset All next to the Cash Flow chart. To adjust individual conditions, open the Filters panel.
Further down is the Transactions table. It contains all transactions in the current selection that make up the Cash Flow chart. Configure the columns using the gear icon (⚙). You can also copy and edit entries directly from this table. To edit an entry, click the cell containing its amount. To copy it, click the corresponding icon in the table’s final Actions column.
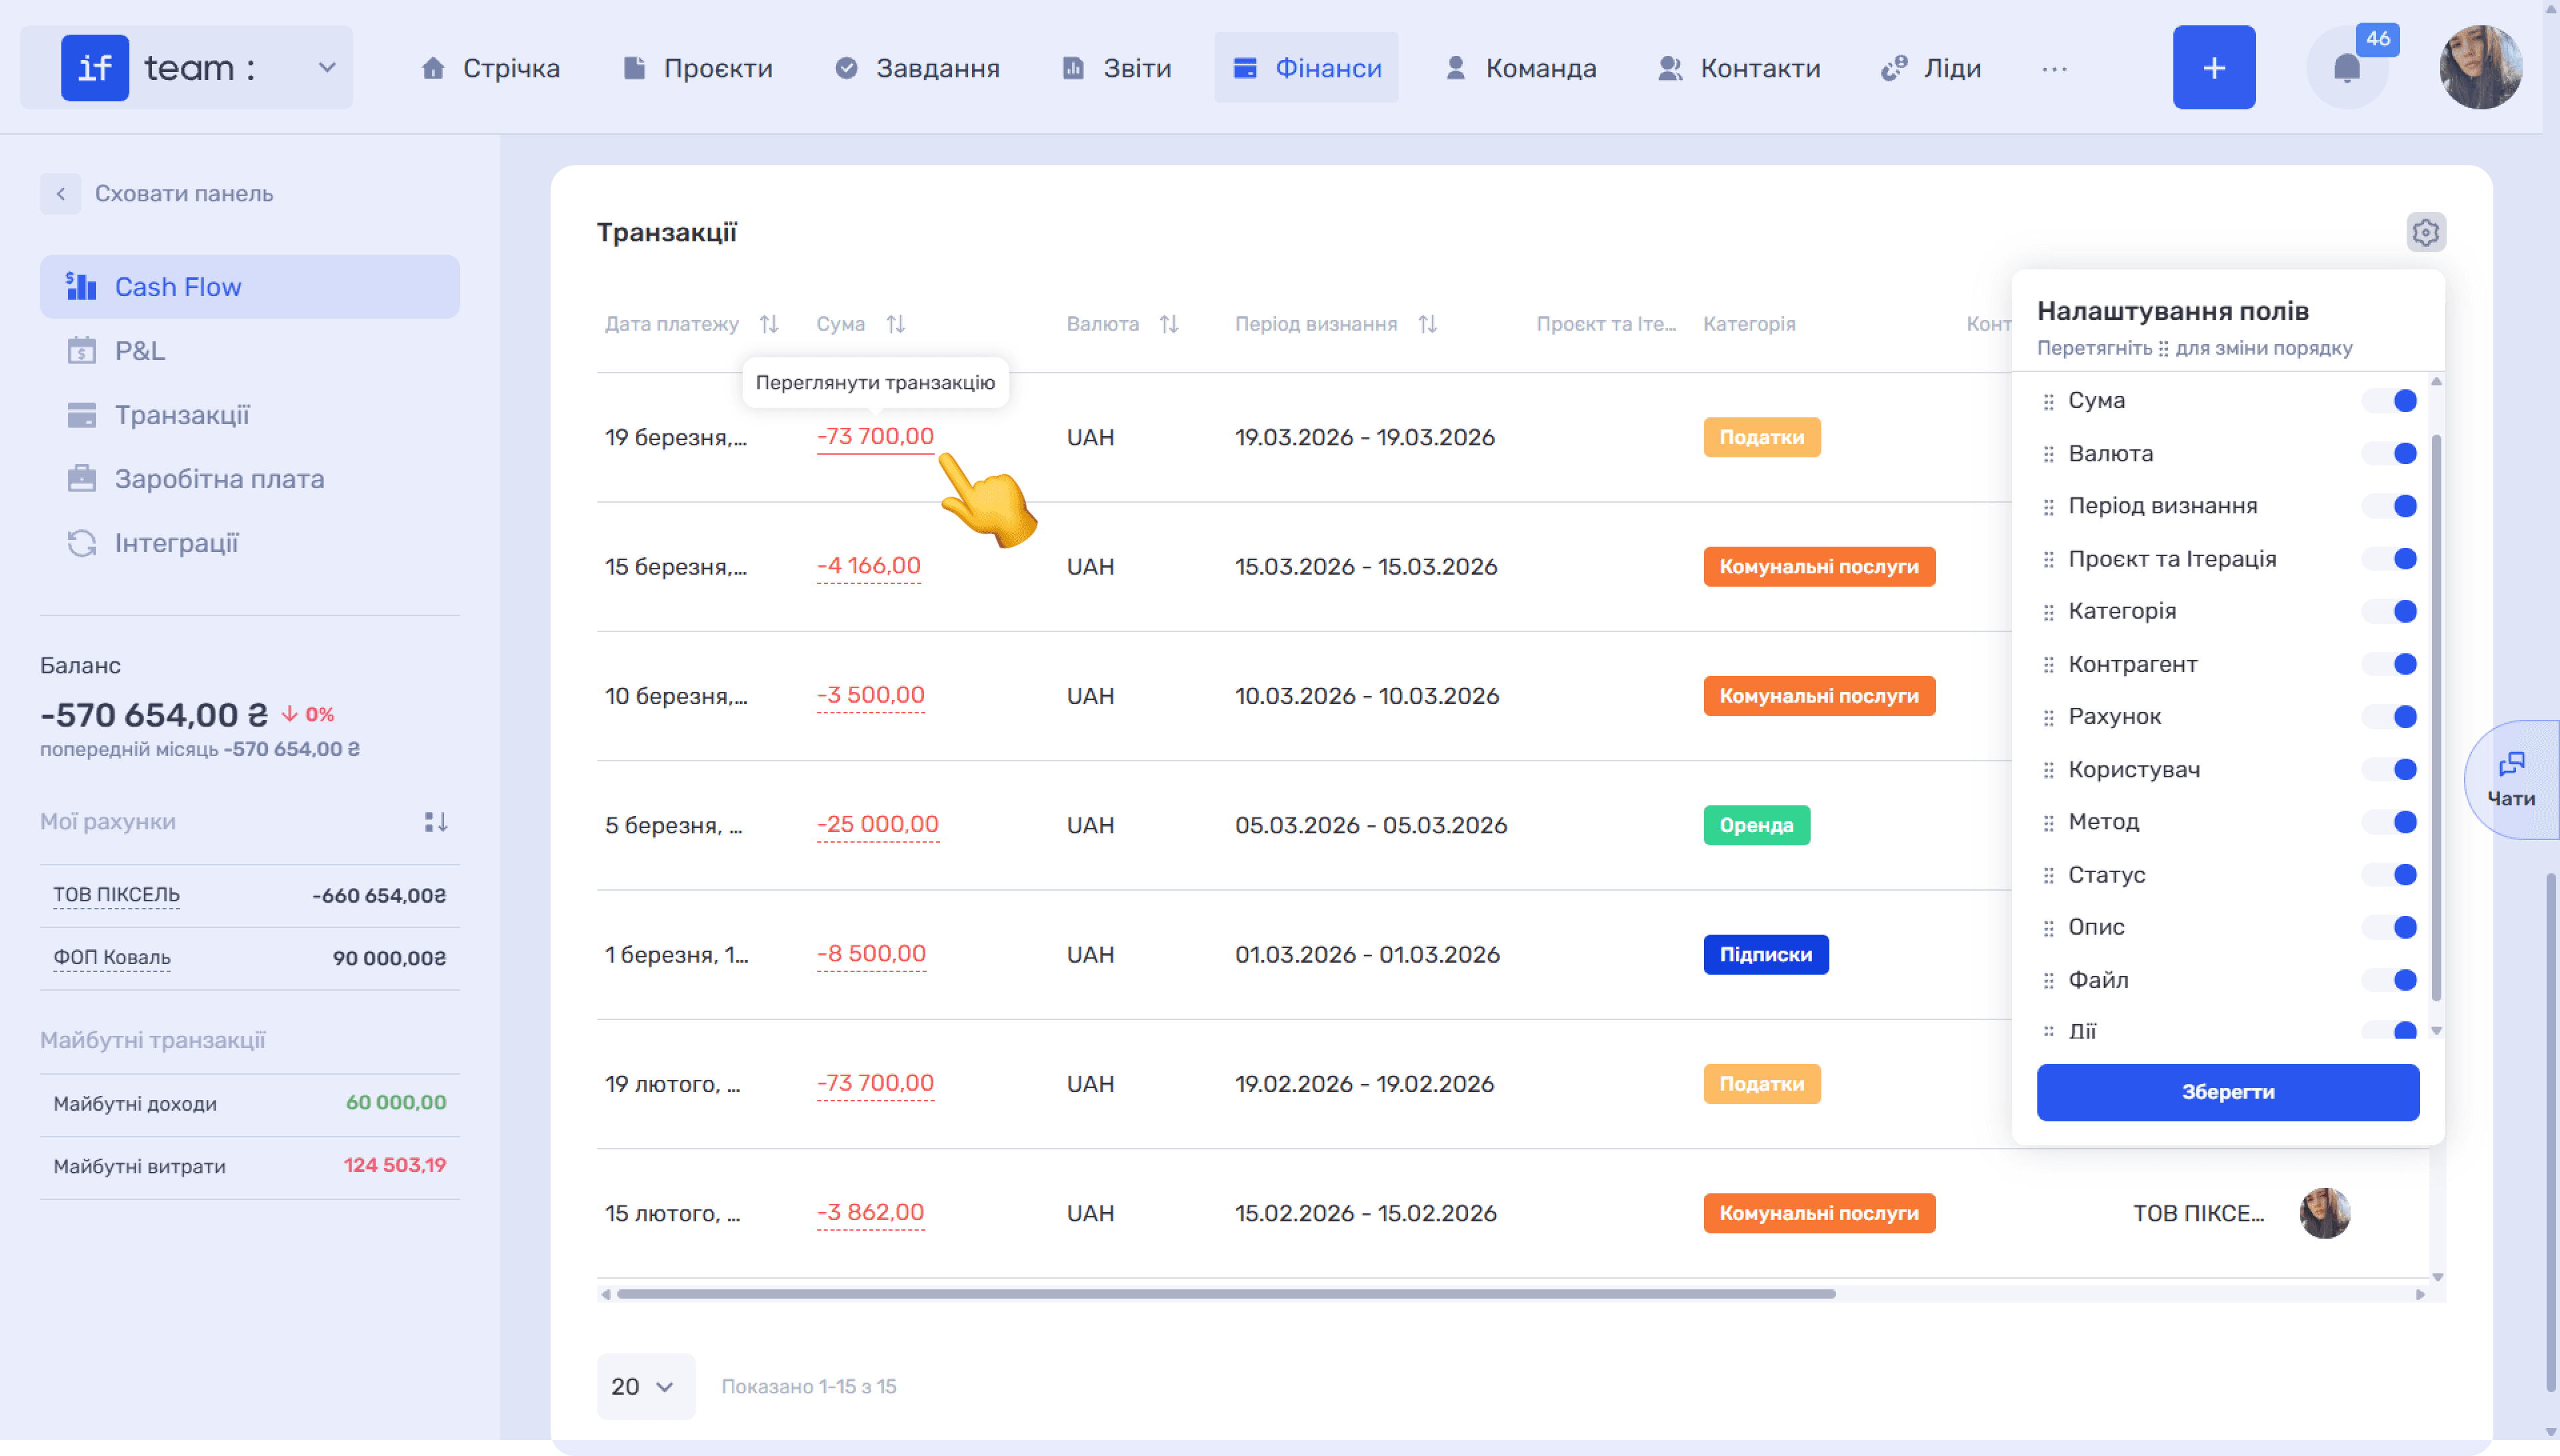
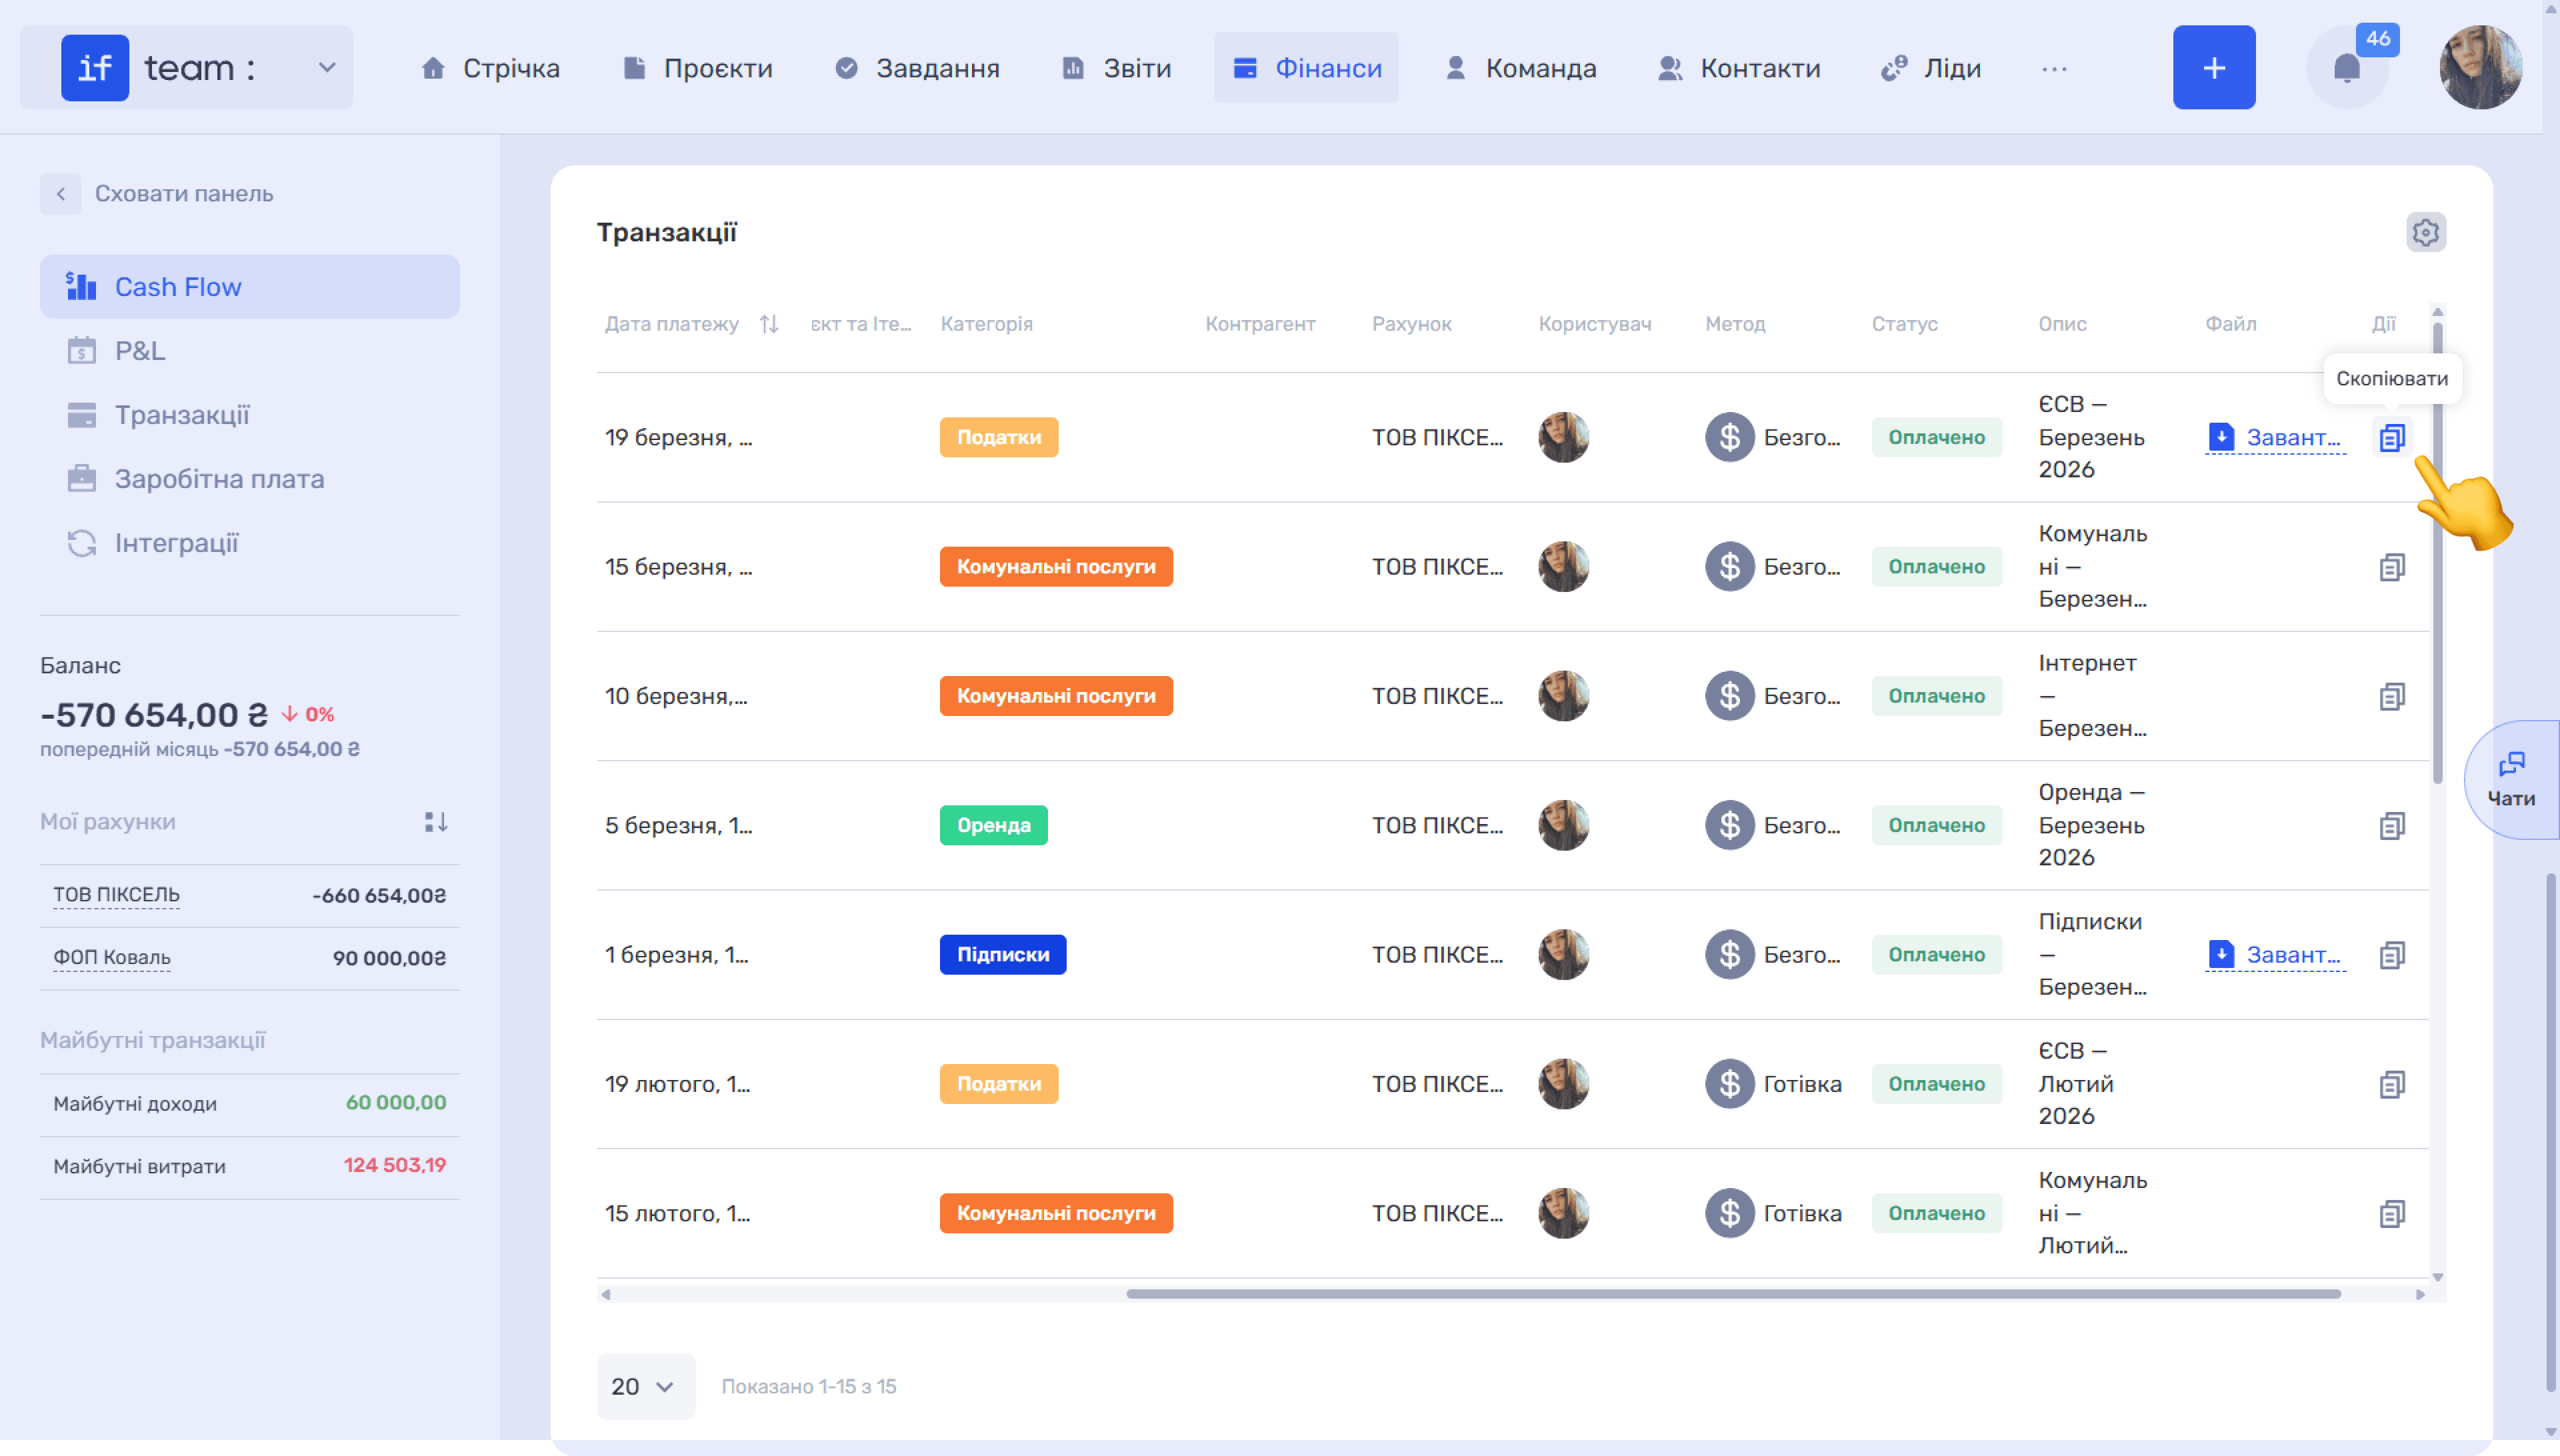
Table View
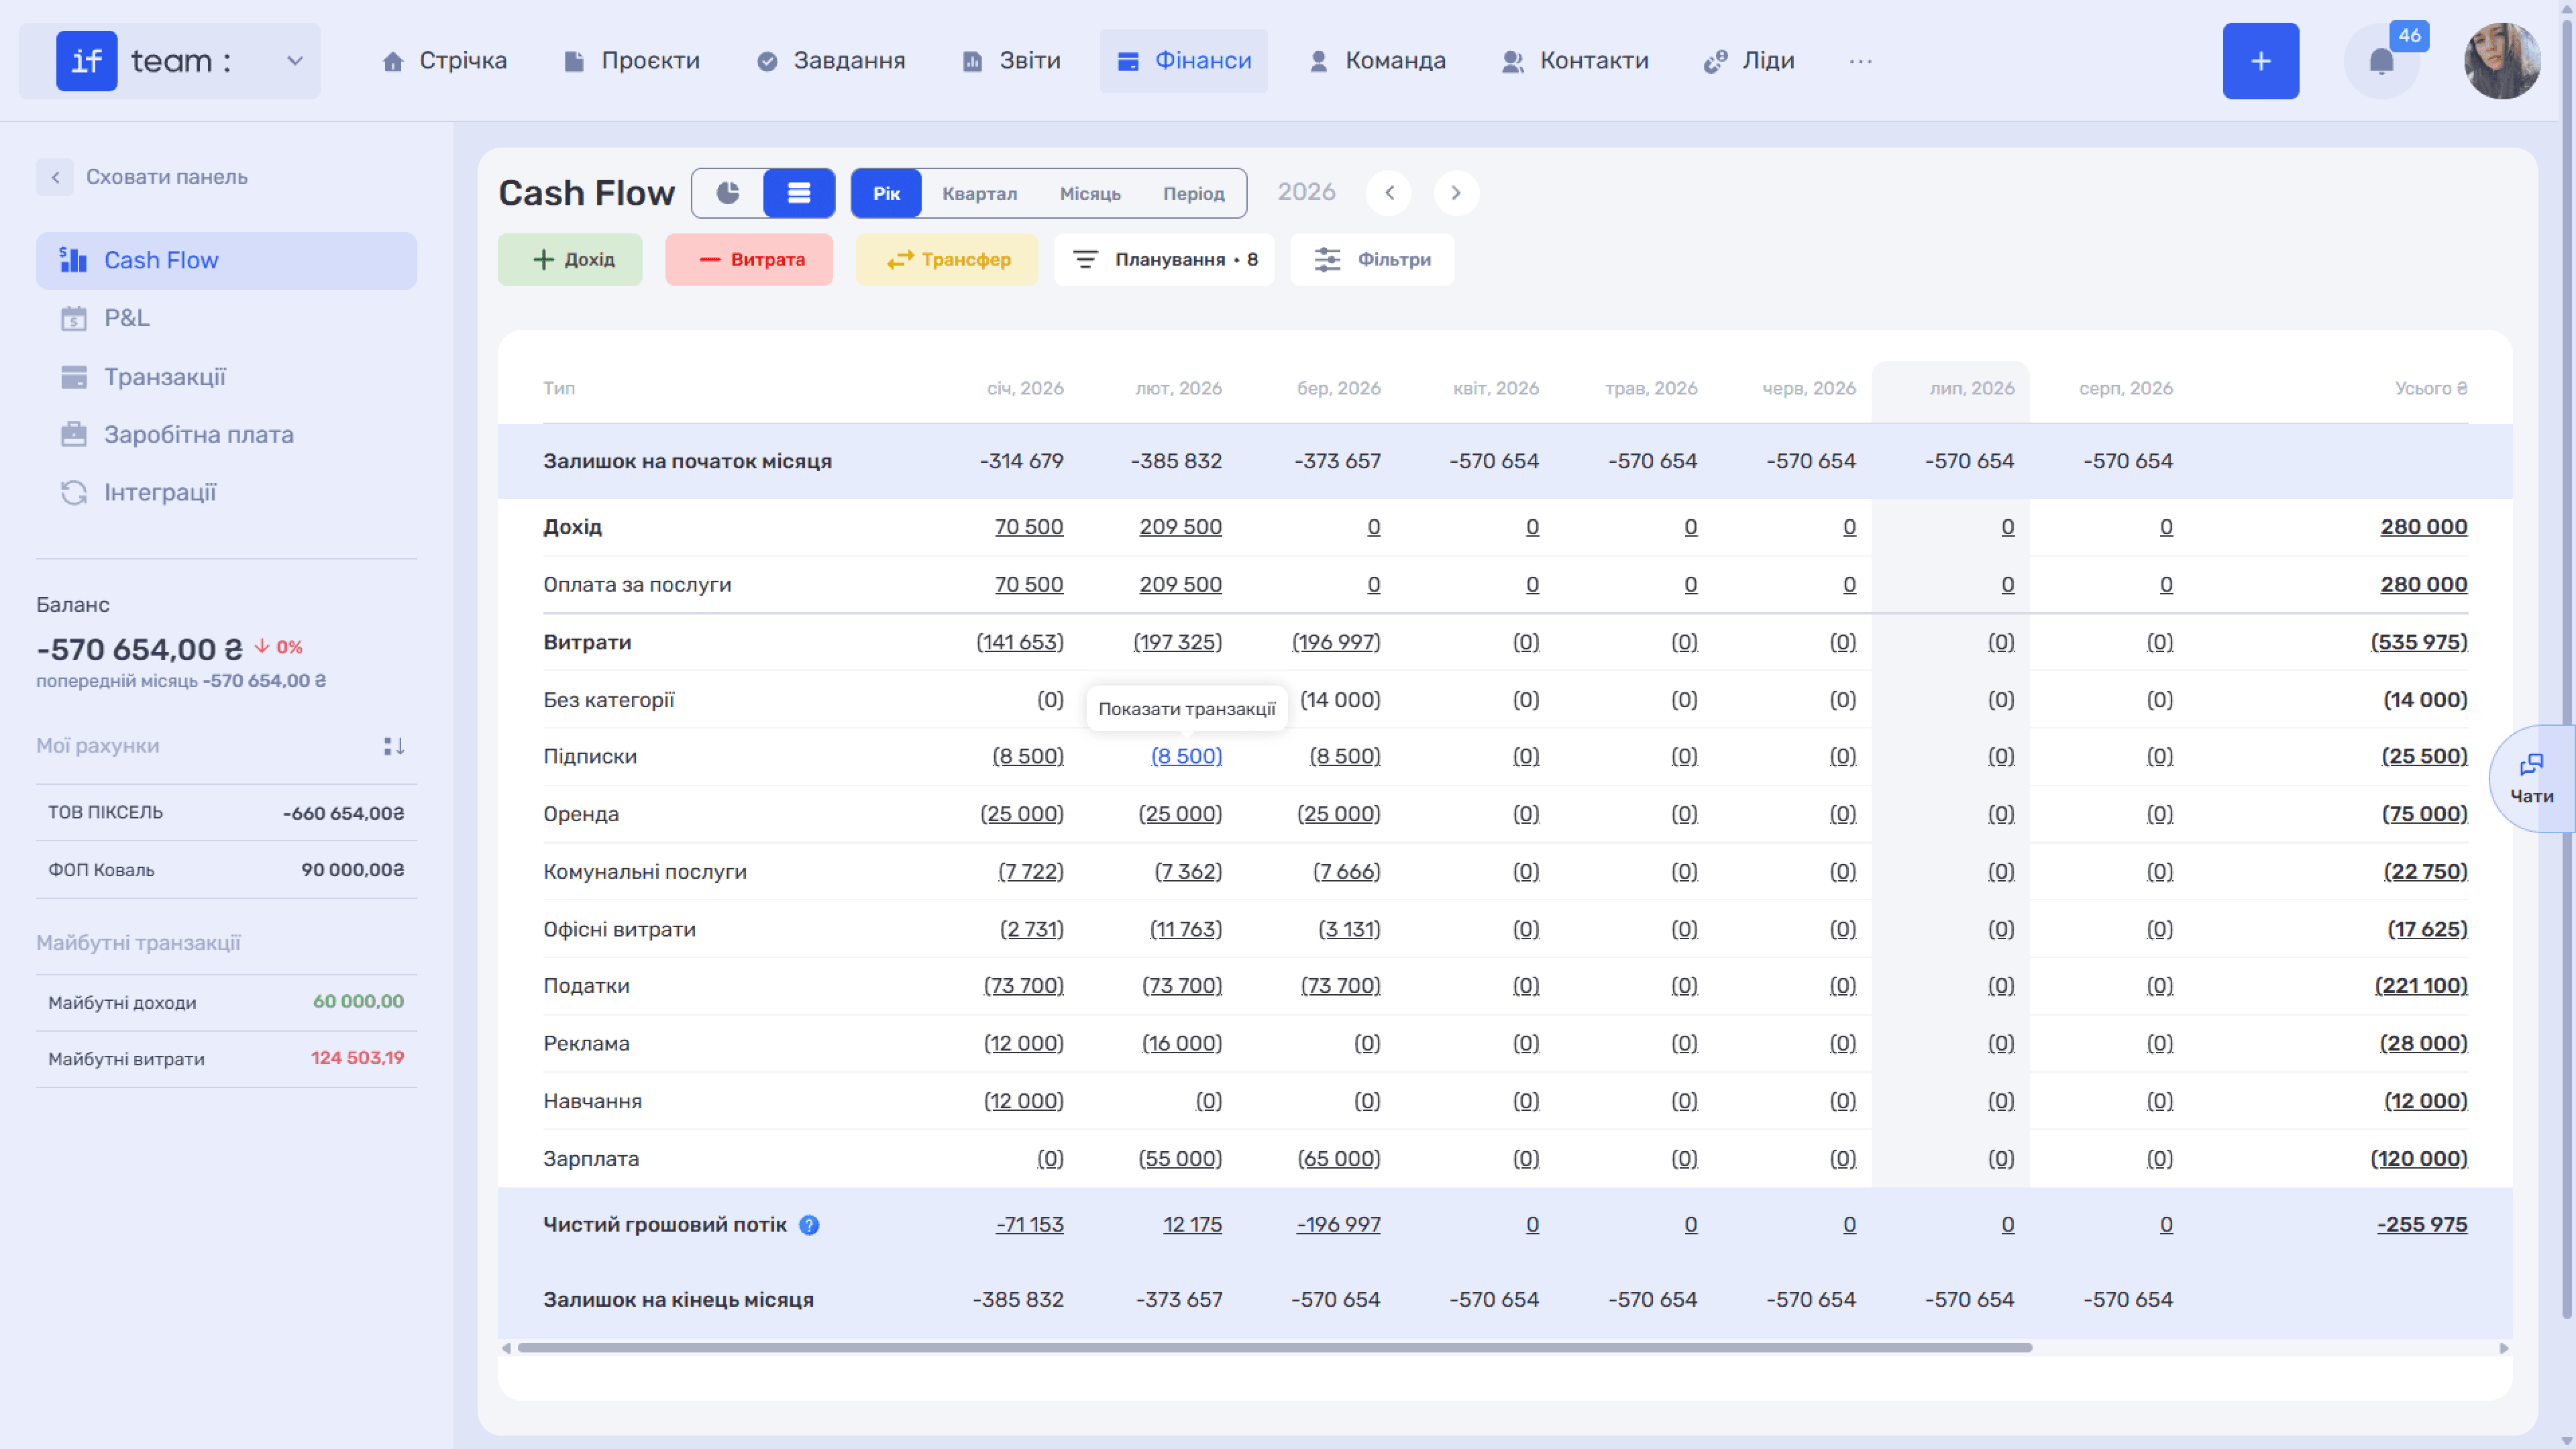
Table view breaks down cash movement by month. The rows represent income and expense categories, while the columns represent the months in the period, with an overall Total column.
Report structure:
- Balance at the Beginning of the Month is the money in the accounts at the start of the period.
- Income shows incoming funds broken down by category.
- Expenses shows outgoing funds broken down by category.
- Net Cash Flow is the difference between total cash inflows and outflows for the period, showing the company’s actual cash position after all transactions.
- Balance at the End of the Month is the money in the accounts after all transactions for the month.
You can view the details behind any amount in the table. Click an underlined value to open the transactions that make up that figure (Show Transactions).
Filters
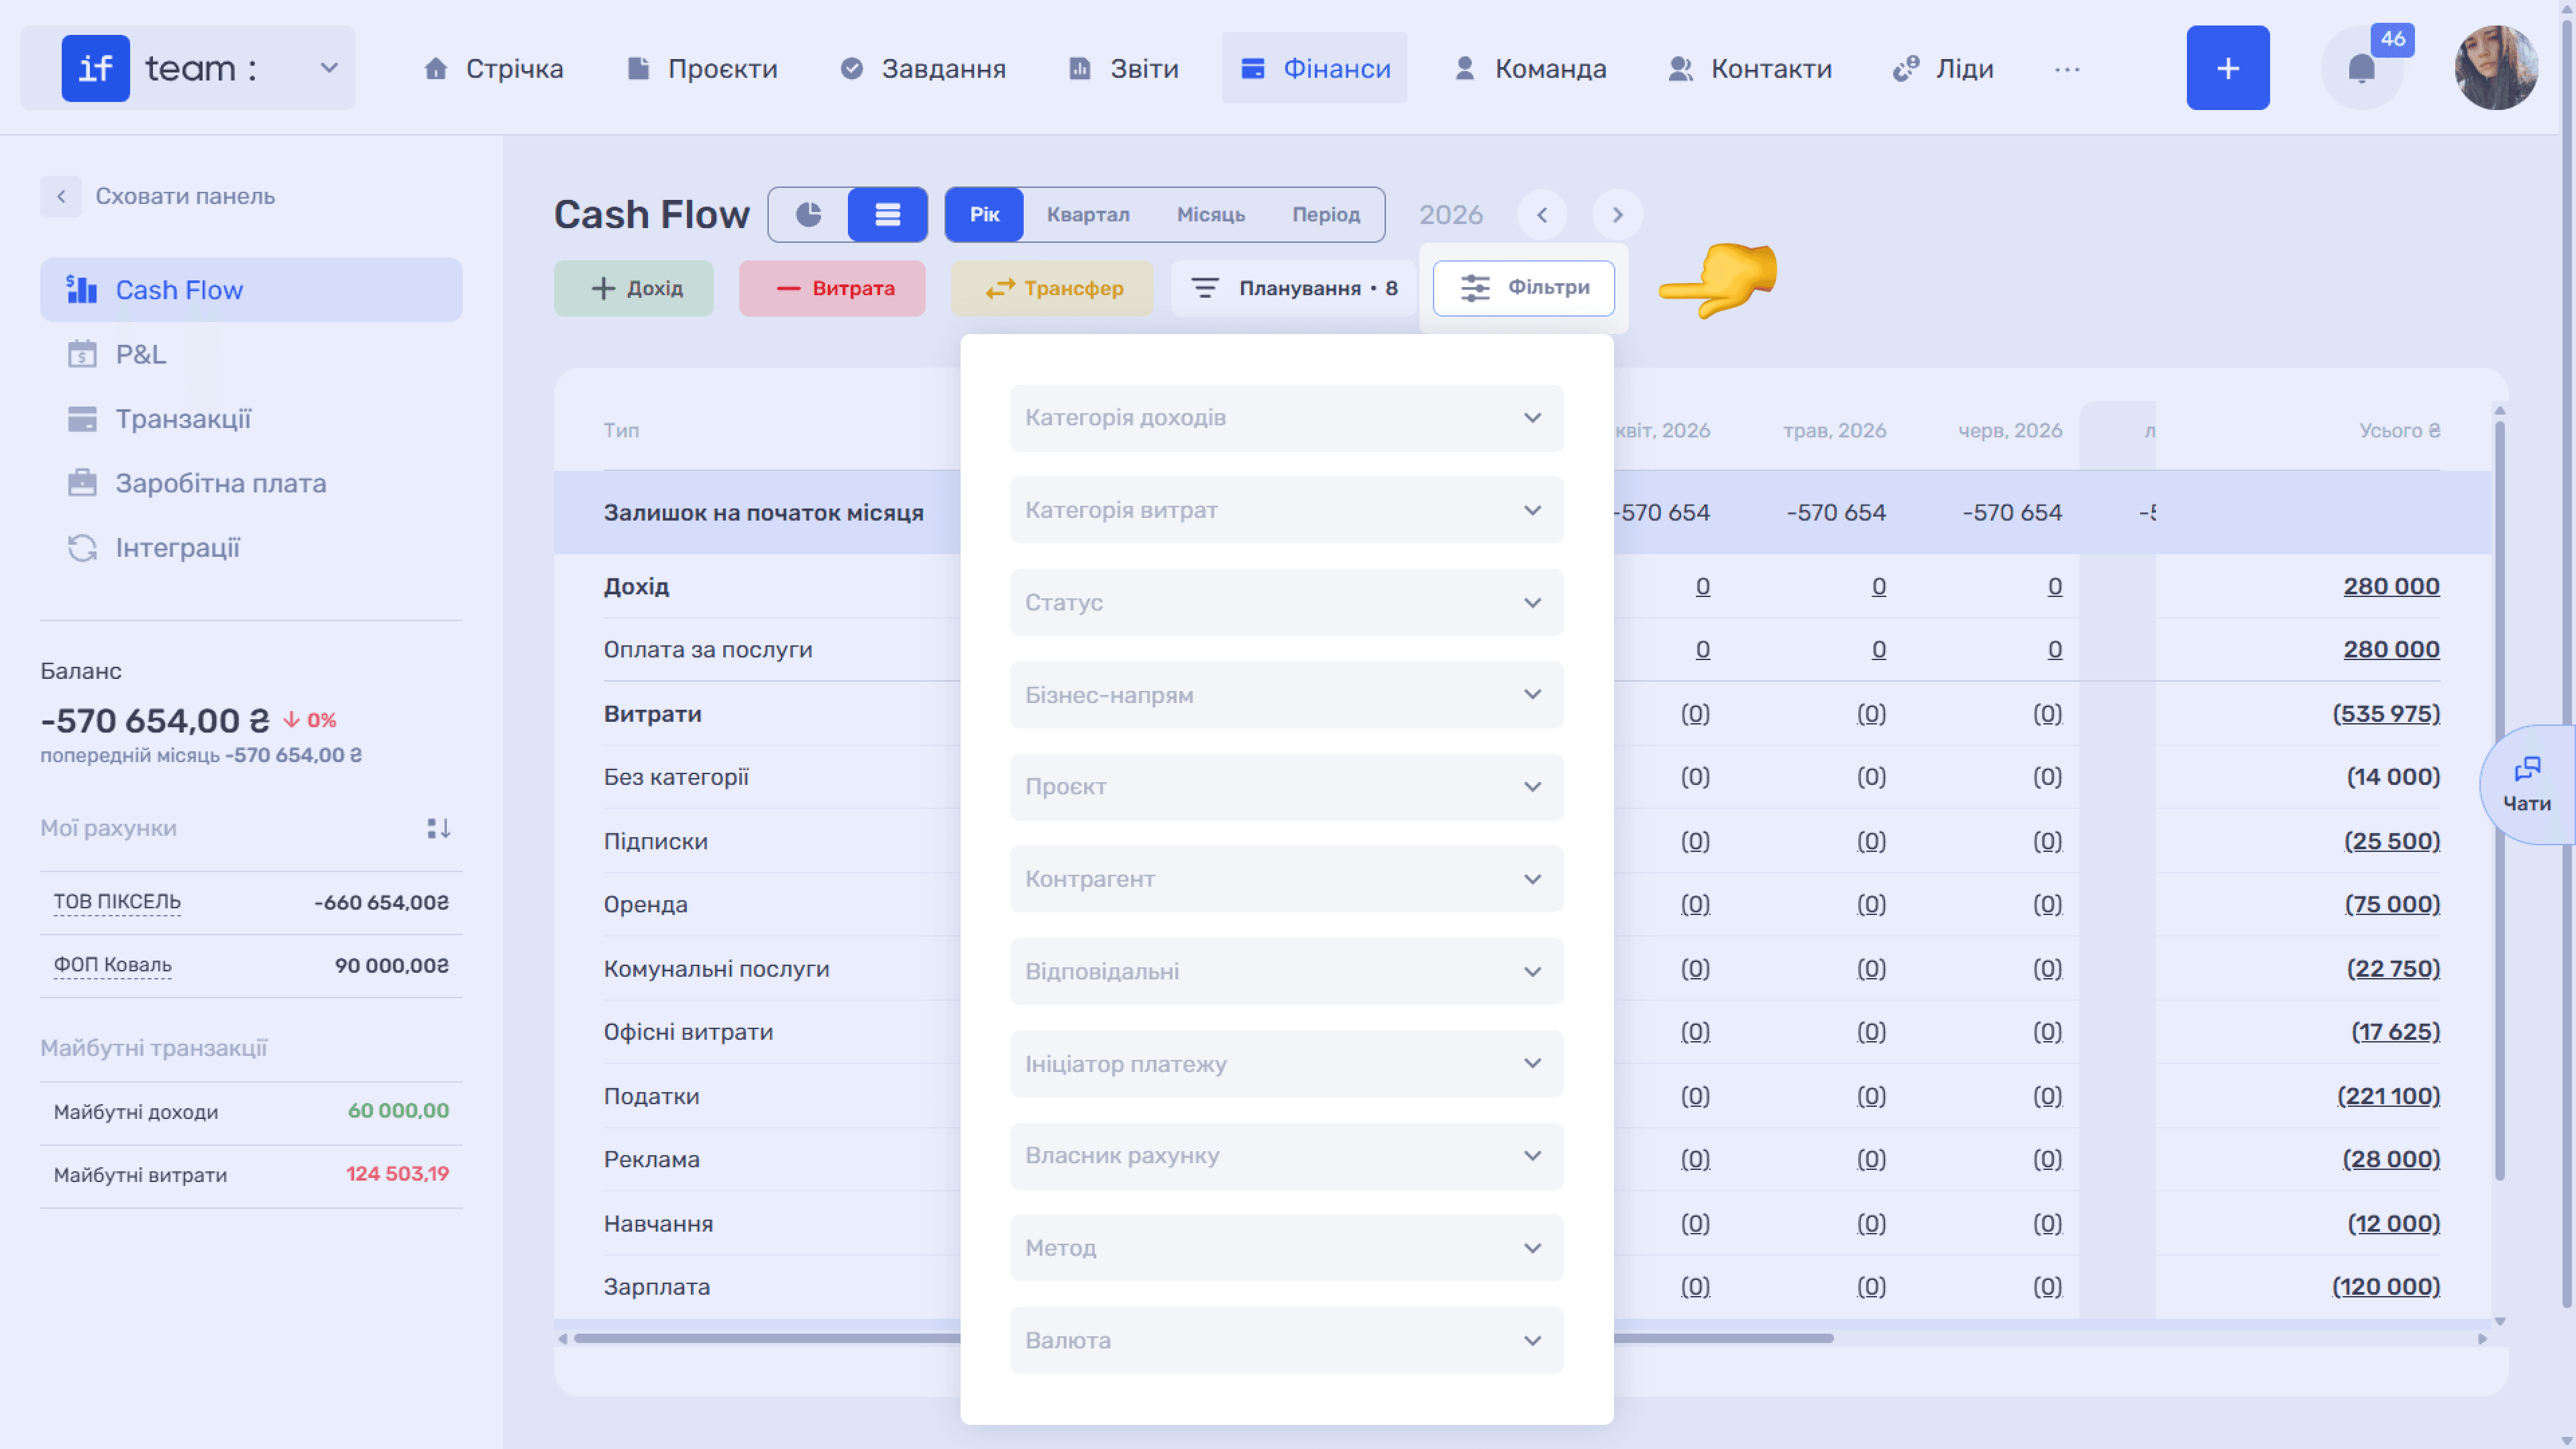
The Filters button narrows the report by income category, expense category, status, business line, project, counterparty, responsible employees, payment initiator, account owner, method, and currency. For example, you can build Cash Flow for only one project, bank account, or counterparty.
Please note
If VAT accounting is enabled for the company, Cash Flow uses the actual payment amounts including VAT. This differs from P&L, which uses amounts excluding VAT.
Still have questions?
Maybe we haven't added this information yet. But you can always reach out:
Request a demo
Submit a request and we'll show you how the service works and its capabilities.
Book a demo