P&L (Profit and Loss) — Profit and Loss Statement
The P&L (Profit & Loss) subsection shows how profitable the business is: how much it earned, how much it spent, and what remained after all income and expenses for the period. Unlike Cash Flow, which reflects the actual movement of money, P&L is based on the recognition period. This means that incom
To open the report, select P&L in the left-hand panel of the Finance section.
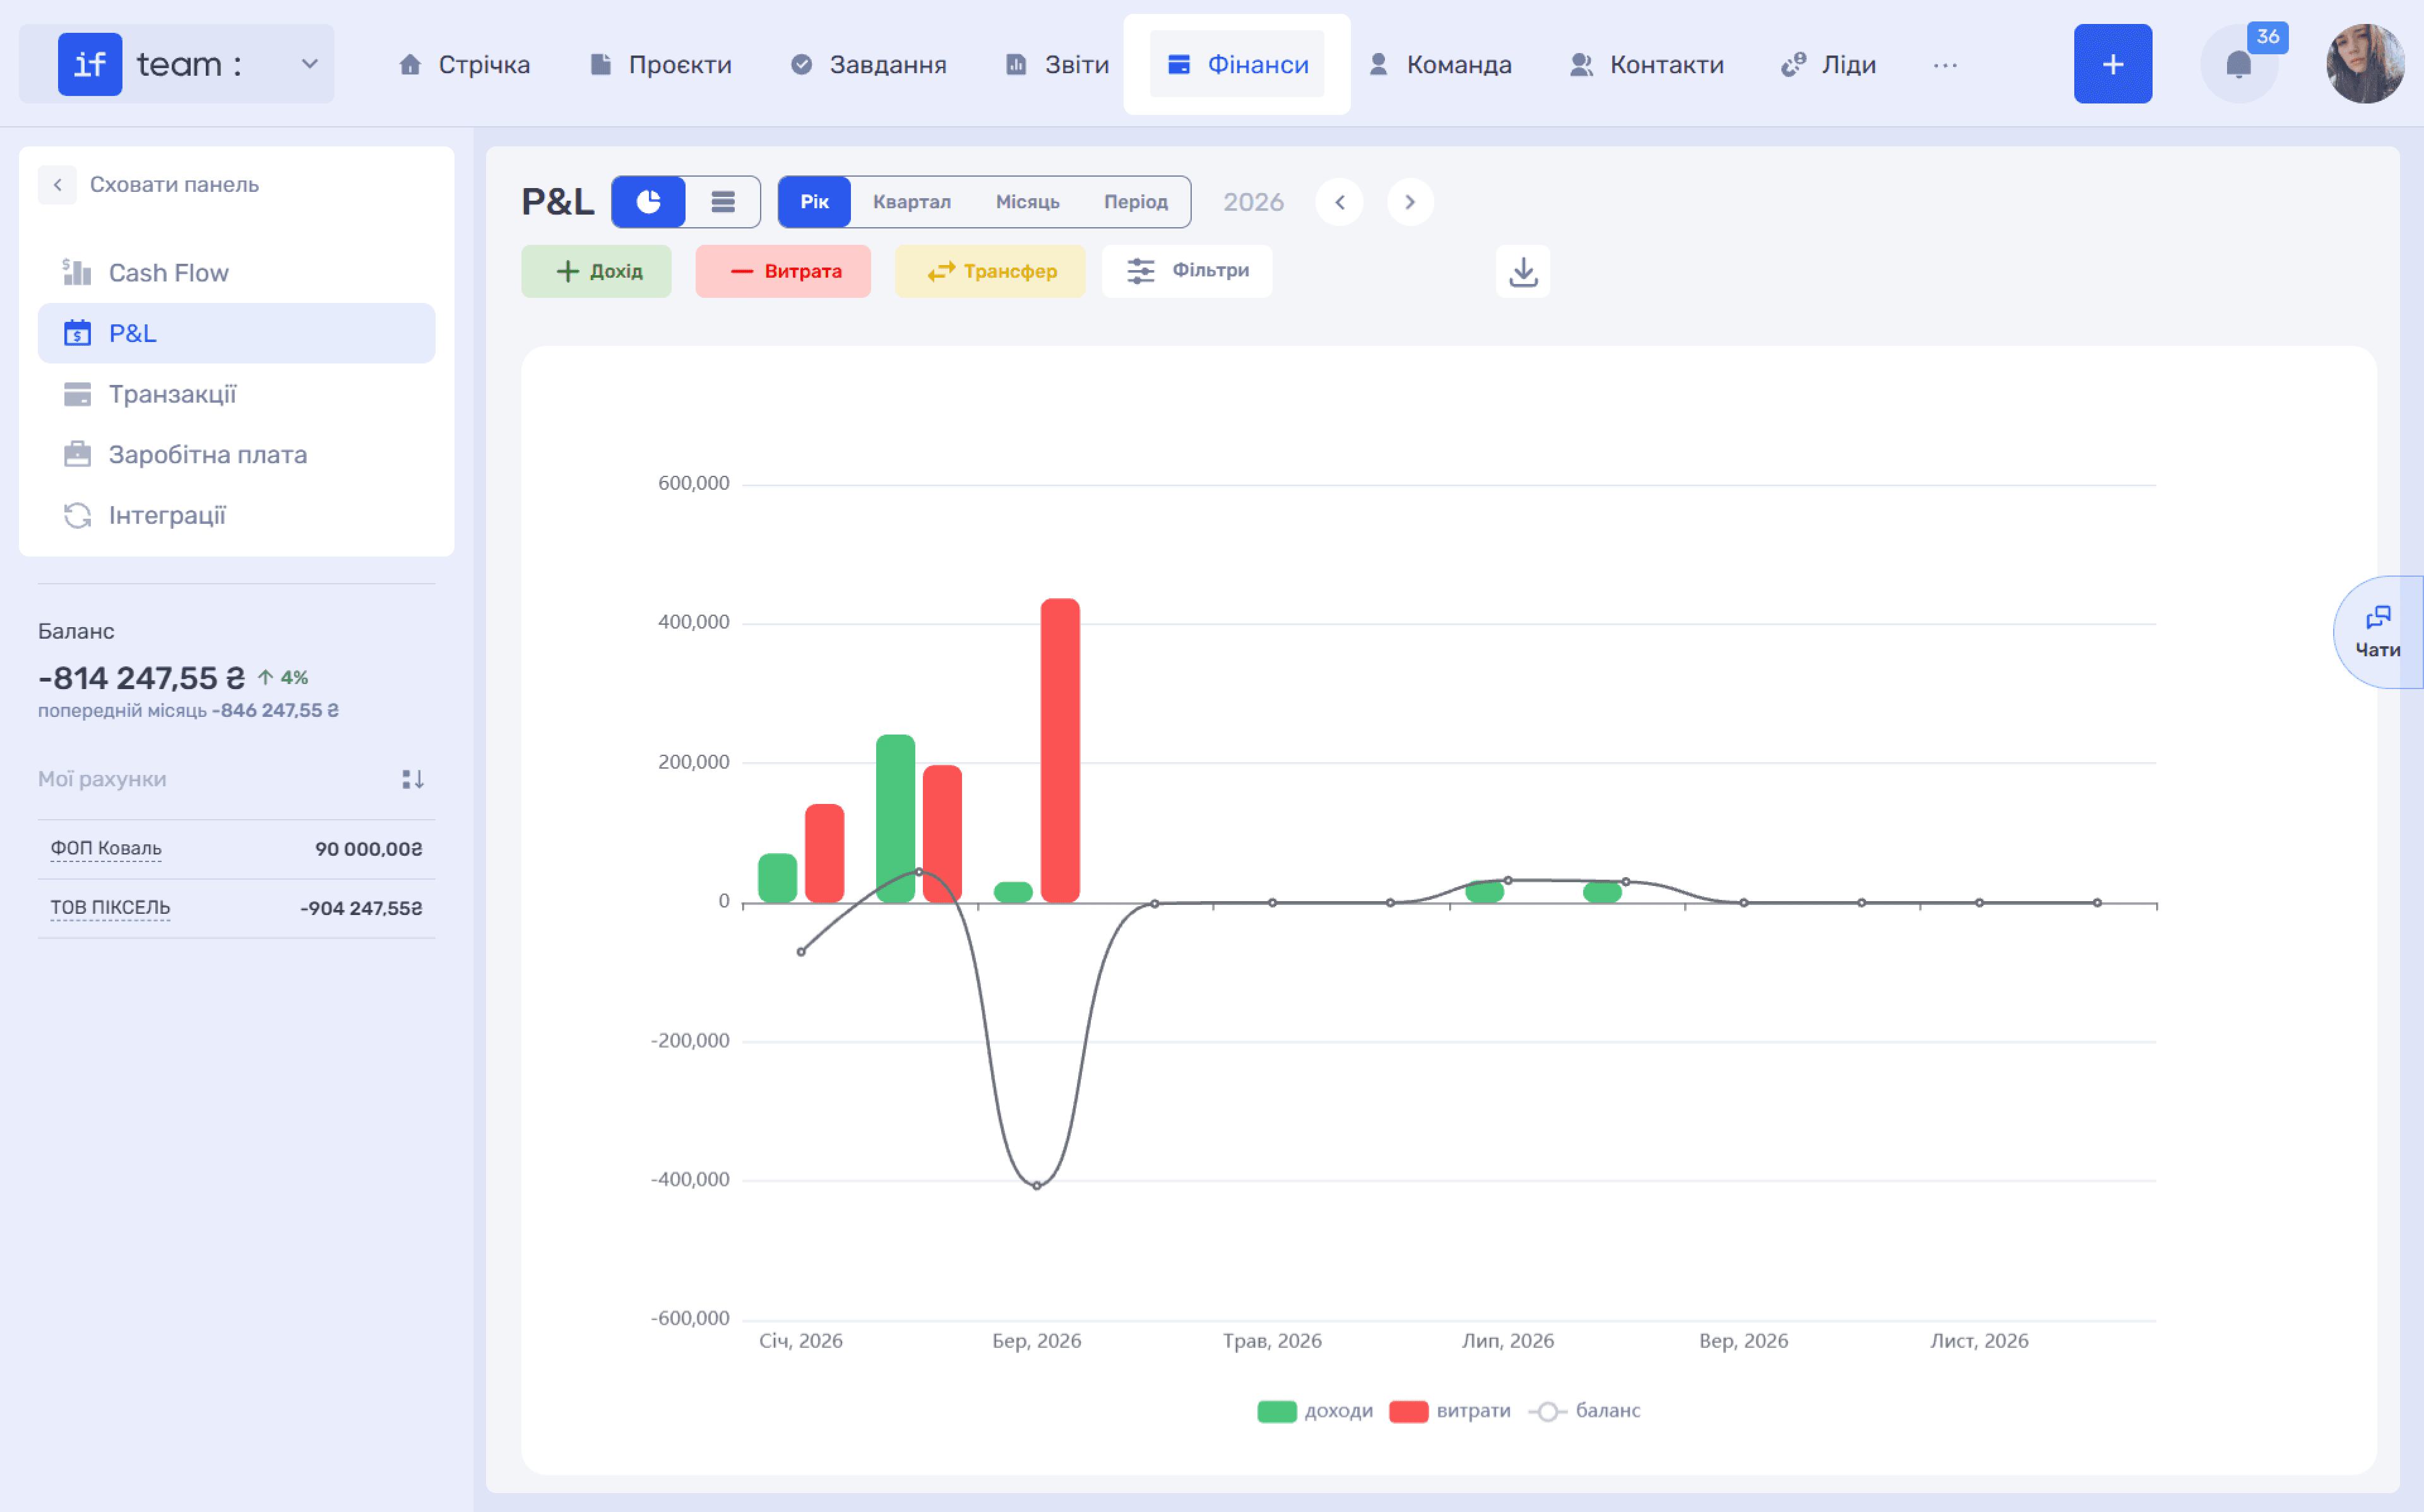
Screen Layout
- View switcher: Chart or Table;
- Period tabs: Year, Quarter, Month, and Period (a custom range), with arrows for switching between periods;
- + Income, − Expense, and Transfer buttons for quickly creating entries;
- Filters button;
- Export icon on the right.
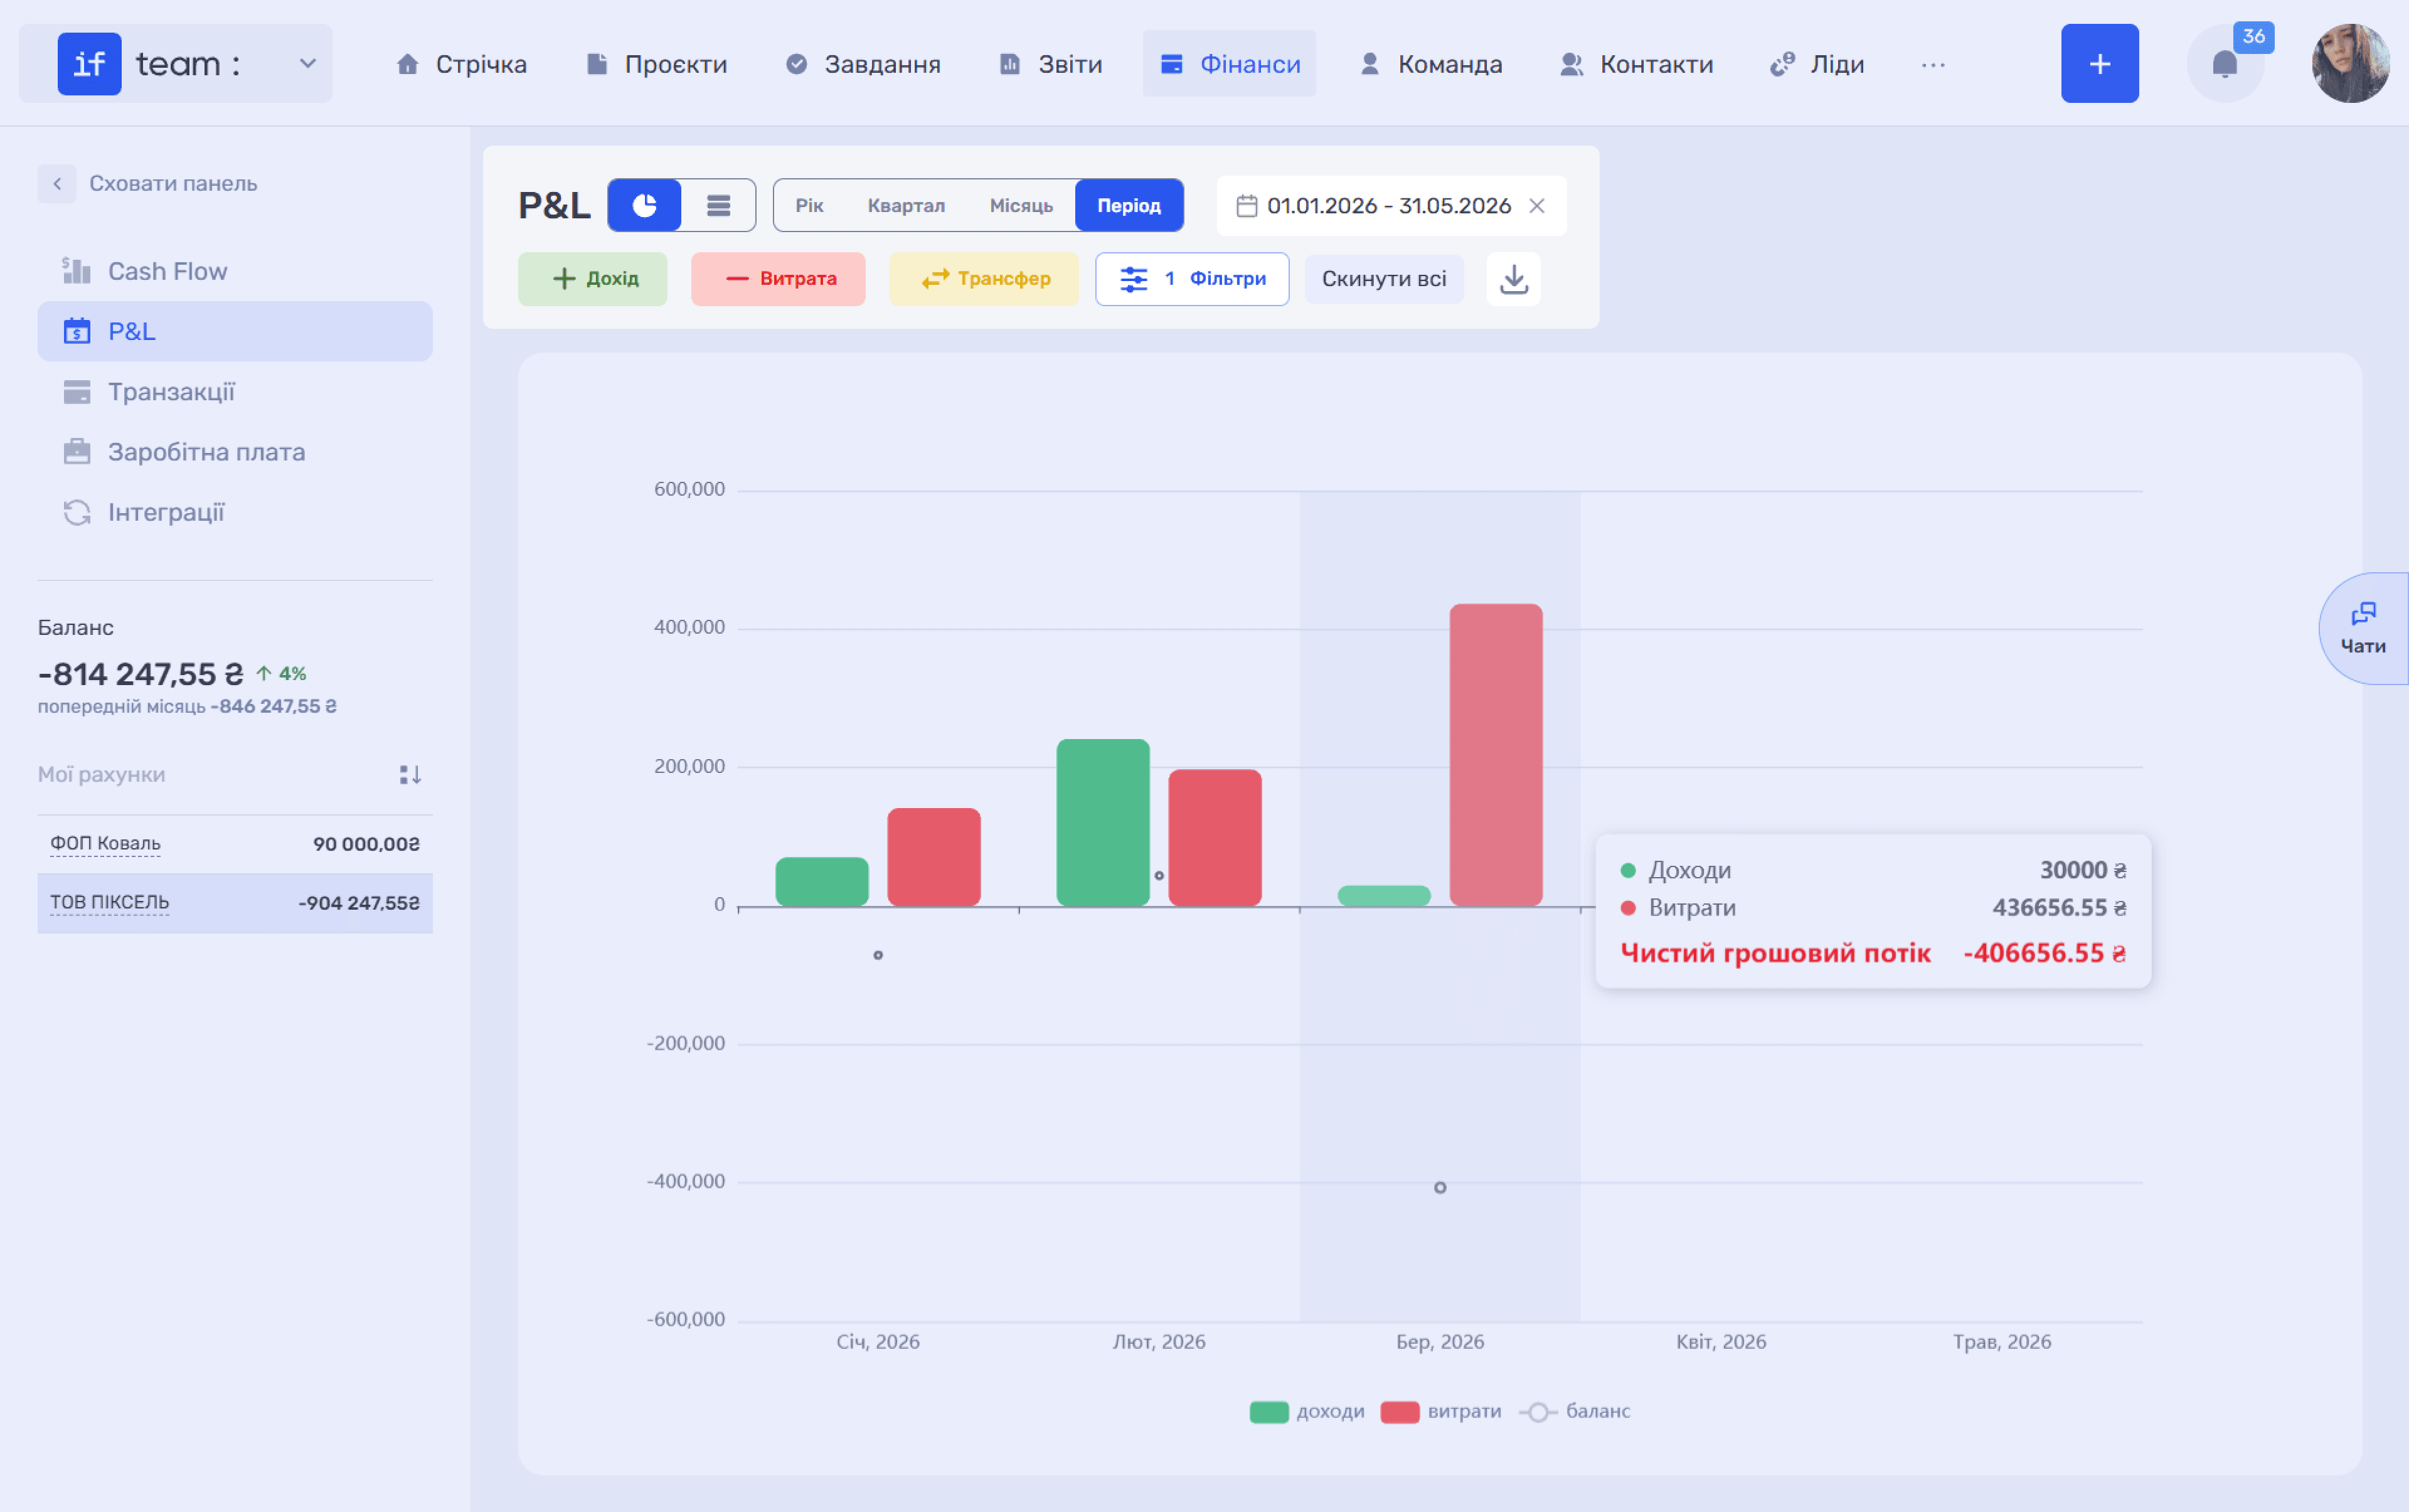
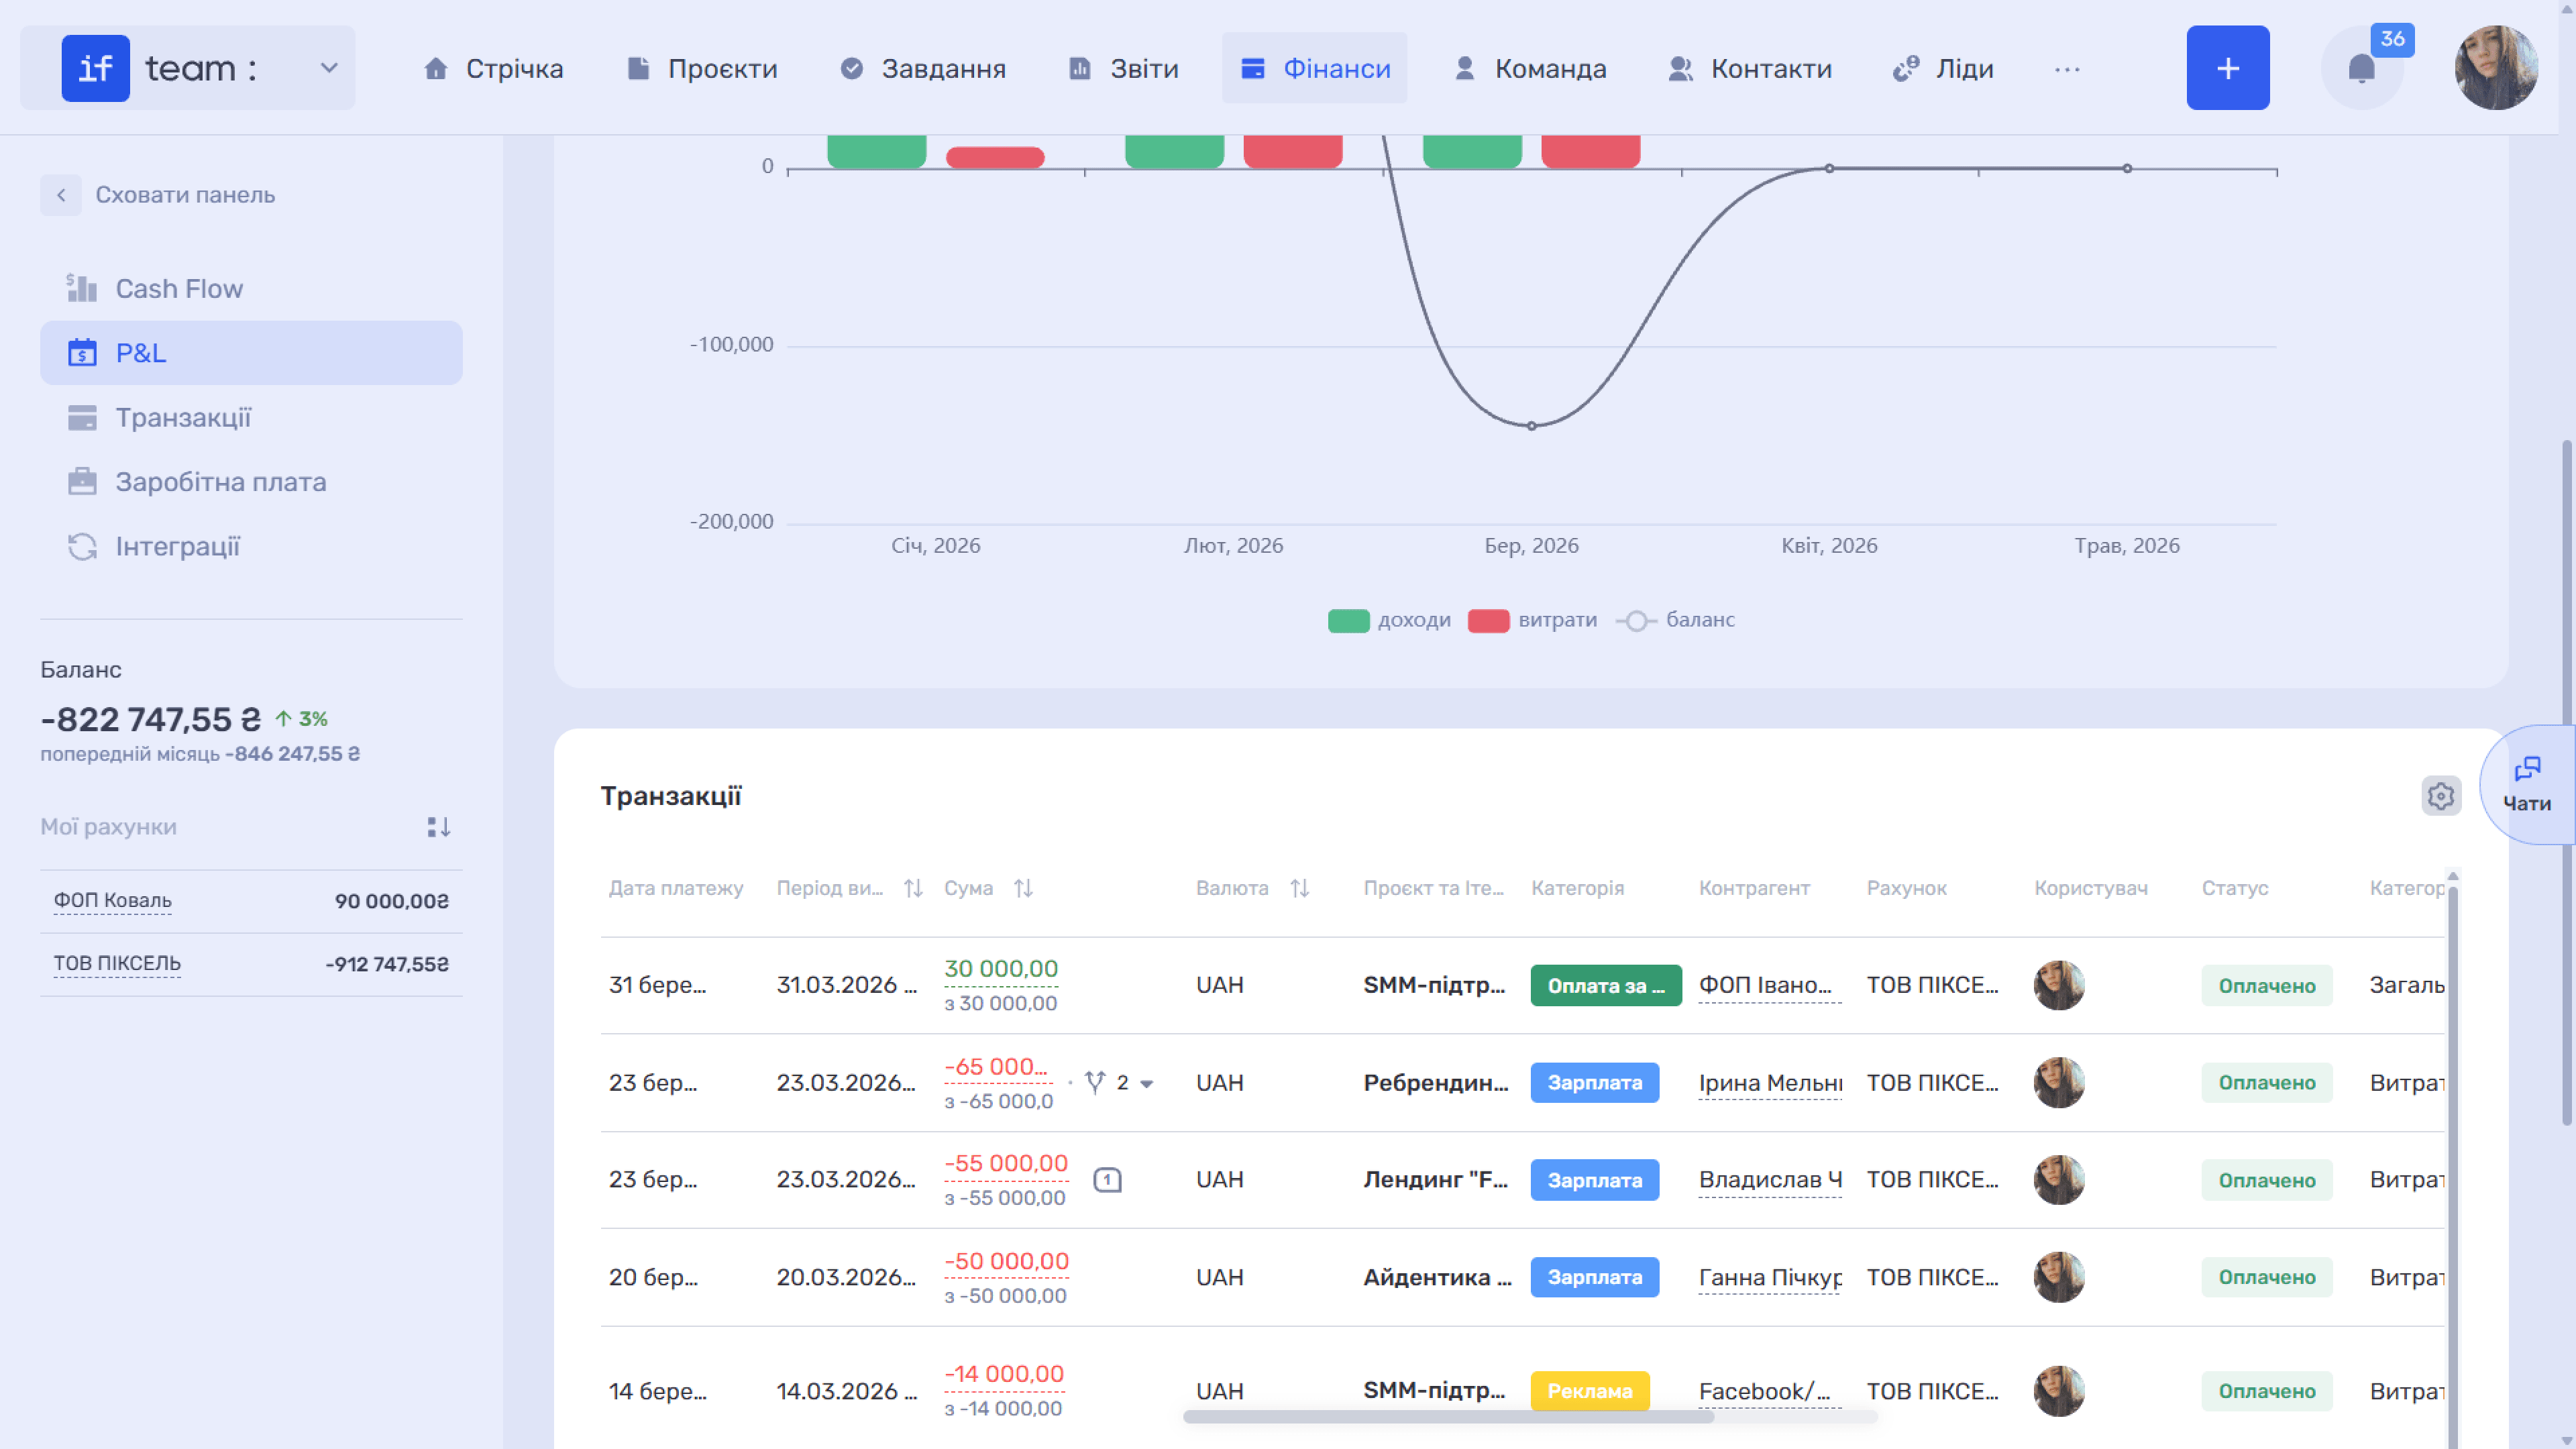
In Chart view, a chart of income, expenses, and balance by month appears at the top, with a list of transactions for the period below it. Table view displays the P&L report itself.
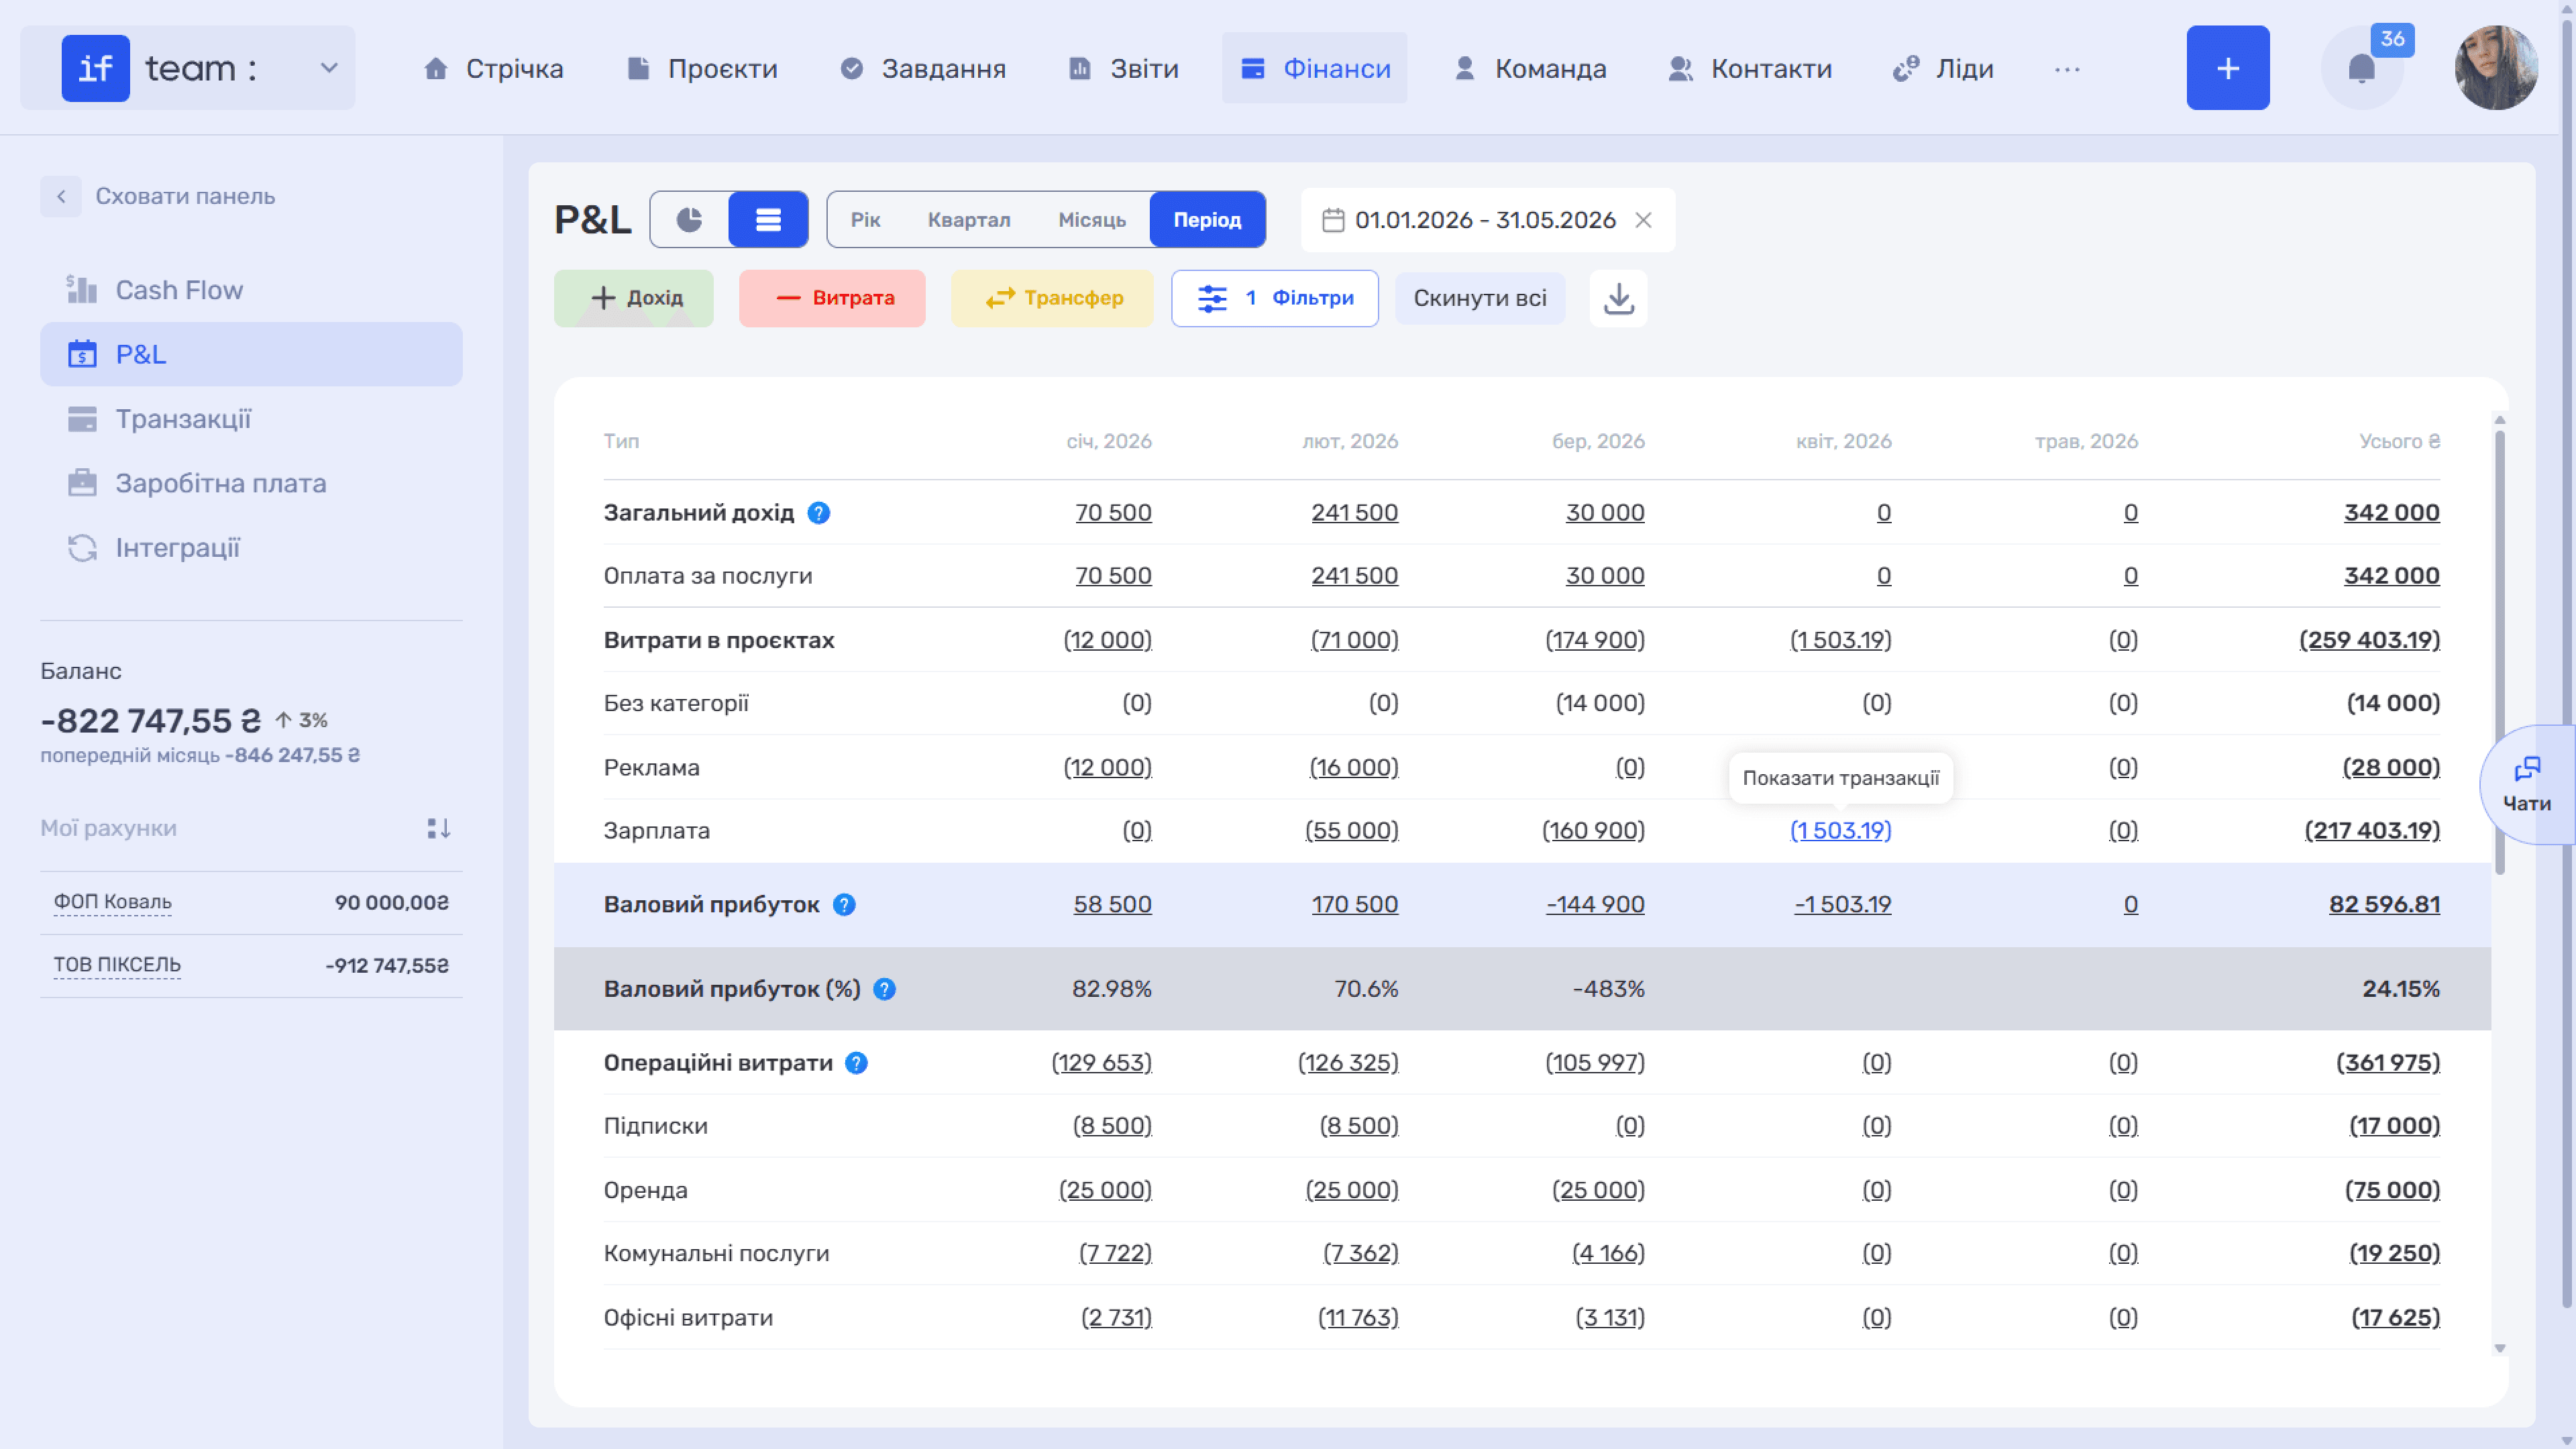
How to Read the Report
The table is structured as a profit waterfall: income appears at the top, followed by expenses deducted in sequence, with subtotal rows in between. The columns represent the months in the period, plus an overall Total column. Income and expense rows are broken down by category.
Key report rows:
- Total Income is the total income from selling goods or services. It expands into individual items, such as “Payment for Services.”
- Project Expenses are the cost of sales: expenses directly related to delivering projects.
- Gross Profit is the difference between income and project costs; Gross Profit (%) is its share of total income.
- Operating Expenses are expenses for core business activities that are not included in project costs, such as rent and utilities.
- EBITDA is operating profit before interest, taxes, depreciation, and amortization; EBITDA (%) is its share of income and reflects operating efficiency.
- Non-operating Income is income outside the company’s core business, such as proceeds from selling assets or interest on investments.
- Non-operating Expenses are expenses outside the company’s core business, such as interest on loans, penalties, and exchange-rate differences.
- EBT is profit before tax.
- Taxes is the amount of tax on profit earned.
- Net Profit is the final profit after all expenses, including taxes; Net Profit Margin is its share of income.
- Dividend Payment and Recapitalization represent the distribution of profit and contributions to capital.
- Financial Result is the remaining amount after accounting for profit or loss, dividend payments, and/or capital investments for the reporting month.
Rows that require an explanation have a ? icon next to them. Hover over it to see exactly how the metric is calculated, such as what is included in EBITDA or how the margin is calculated.
Transactions are assigned to rows automatically based on the P&L Category given to each entry when it is created. Clicking any table cell opens the list of transactions that make up that amount.
You can generate the report not only for a calendar month, quarter, or year, but also for any custom period—for example, the current and previous months combined.
Please note
If VAT accounting is enabled for the company, P&L uses amounts excluding VAT. This differs from Cash Flow, which shows the actual amounts including VAT.
For details, see VAT Accounting.
For a fuller walkthrough of the report structure and a worked example, see How to read a P&L: explanation and a calculation example.
Still have questions?
Maybe we haven't added this information yet. But you can always reach out:
Request a demo
Submit a request and we'll show you how the service works and its capabilities.
Book a demo