
What Is a KPI? Meaning, Examples and How to Measure It
KPI meaning in one sentence: a key performance indicator (KPI) is a measure a business uses to assess progress toward an important goal. If an agency wants to earn more from its projects, signing more contracts is only part of the picture. It also needs to know how much revenue remains after…

KPI meaning in one sentence: a key performance indicator (KPI) is a measure a business uses to assess progress toward an important goal. If an agency wants to earn more from its projects, signing more contracts is only part of the picture. It also needs to know how much revenue remains after delivering the work.
Examples include project margin, on-time delivery, client retention and proposal conversion. A measure becomes a KPI because it matters to a particular business decision, not because it appears on a dashboard.
This guide explains what a KPI means in business, how to choose one, how to calculate common examples and how to avoid misleading conclusions. We will also work through a project in if.team, connecting tasks, hours and financial data. All studio figures below are illustrative. They are not customer results or a promise of improvement.
Short answer. KPI definition: a number that shows whether the business is moving toward an important goal and points to a decision. For example, project margin = (revenue − direct costs) / revenue × 100%. To set one up, fill in the KPI definition template and pick a formula from the KPI examples table.
What is a KPI in business?
Imagine a studio with 600,000 UAH in revenue from completed projects this month, up from 500,000 UAH last month. Revenue has increased by 20%. The owner might reasonably expect the business to be doing better.
However, the direct cost of delivering those projects rose from 275,000 UAH to 360,000 UAH. The amount remaining after those costs increased from 225,000 UAH to 240,000 UAH, while the share of revenue retained fell from 45% to 40%.
Both observations are true. The studio earned a larger amount after direct costs, at a lower margin. Whether that is acceptable depends on its goals, overheads and ability to sustain the workload.
A KPI makes the question more precise. If the owner wants to understand delivery economics, the measure must include delivery costs. If the concern is making payroll before clients pay, a cash forecast is more useful. A single number cannot answer both questions.
A useful KPI connects to a decision. When it changes, someone knows what to investigate and what they can change. Without that connection, even an accurate report may do little more than describe the past.
The word “key” matters. A studio may track hundreds of data points without treating them all as KPIs. A count of uploaded files can be useful for finding missing documents, but it is unlikely to tell the owner whether the business is delivering profitable work.
KPI, metric, target and task: the difference
A metric is a measurable aspect of work. A KPI is a metric selected because it is important to a goal. The target is the desired value. A task is an action intended to help achieve it.
| Term | Studio example | Question it answers |
|---|---|---|
| Goal | Retain enough revenue after delivering client work | What are we trying to achieve? |
| KPI | Project margin after defined direct costs | How will we assess the result? |
| Target | At least 40% across the quarter | What result are we aiming for? |
| Supporting metric | Hours spent on unapproved scope changes | What might explain a gap? |
| Task | Agree the price of additional work before starting it | What will we do? |
The 40% target is an assumption for this example, not an agency benchmark. A business with expensive premises and a large sales team needs different economics from a small founder-led studio.
“Prepare ten proposals” is measurable too. But if the goal is more profitable contracts, the number of proposals alone does not show success. Ten documents sent to unsuitable prospects may produce less useful work than three well-qualified proposals.
Keep improvement tasks connected to the problem they address. “Update the estimate template because three recent projects omitted approval time” gives the team a reason to act. Our guide to online task management explains how to keep those actions, owners and decisions together.
How are KPIs different from OKRs?
OKRs describe an objective and the key results used to assess whether it has been achieved. A KPI measures an important aspect of ongoing performance. The same measure can play a role in both.
A studio may continuously track the percentage of milestones accepted on time. That is a KPI. If it sets a quarterly objective to make delivery more predictable, increasing that percentage from its current level to an agreed target could become a key result.
The labels are less important than the agreement behind them. Define the desired outcome, how it will be measured and what the team can do to influence it before choosing a management framework.
Why use key performance indicators?
KPIs help people agree on what “better” means. The owner, project manager and team can decide in advance which result matters, which data they will use and which constraints they must respect.
They can also provide an opportunity to act. A completed project cannot recover hours already spent. A forecast made while work is still underway can prompt a scope discussion, a revised estimate or a decision to stop unapproved additions.
A third use is checking whether a change helped. After introducing approval for extra work, the studio can look at unpaid hours, delivery time and client feedback. Having a new process is not itself evidence that the process works.
A specific, challenging goal can help direct work, but its effect depends on the conditions. Edwin Locke and Gary Latham examine those conditions in their review of 35 years of goal-setting research. This is research on goals and motivation, not proof that every KPI system improves a business.
Focusing on one target can draw attention away from other outcomes or encourage harmful ways of reaching it. The authors of Goals Gone Wild discuss these risks. Check how a result was achieved and what the measure leaves out.
For example, a support team might reduce first-response time by sending immediate template replies. The number improves, but customers may still wait just as long for a solution. A measure should not quietly replace the outcome it was meant to represent.
Types of KPIs
Lagging and leading indicators
A lagging indicator describes an outcome that has already occurred: margin on a completed project, client retention over a quarter or the share of milestones delivered on time.
A leading indicator concerns a condition or activity that may influence a later outcome. The share of extra work approved before it starts could help a studio control unpaid scope, for example.
The relationship still needs to be tested. An activity does not become a reliable predictor just because it is easy to count. Ten prospect meetings may generate fewer suitable contracts than three meetings with well-qualified buyers.
A margin forecast is slightly different. It estimates a future outcome using actual data and assumptions about the remaining work. It can provide an early warning, but it is only as useful as those assumptions. If remaining effort is out of date, the forecast is out of date too.
Company, team and individual KPIs
At company level, leaders may track revenue, profit, retention or forecast cash balance. At team level, measures might concern delivery reliability, project economics or the quality of handoffs.
For an individual, consider how much influence they have over the result. A designer does not independently set the contract price, select the entire team or control client approval times. Overall project margin is therefore a weak basis for judging that designer alone.
A shared measure still needs an owner. Someone must check the data, investigate changes and coordinate decisions. Owning the KPI process does not mean personally causing every movement in the number.
Outcome measures and safeguards
An important result often needs a check on possible side effects. Faster delivery can be considered alongside work returned for correction. Higher planned utilization can be checked against delivery reliability and the time available for internal work.
This does not require ten extra metrics for every KPI. Choose the risk that matters in your process. If people close tasks before the work is reviewed, clarify what “complete” means and check acceptance. Another decorative chart will not fix the definition.
How to choose KPIs for your team
1. Start with a problem and a decision
Replace “we need KPIs” with a specific question: “We are selling more work, but we do not know which projects leave enough money to support the company.”
That question points toward project revenue and delivery costs. Meetings, tasks and messages may help explain the work, but they do not answer the financial question directly.
Then list the decisions the information could support: changing prices, agreeing scope, adjusting the delivery approach or declining an unsuitable type of project. Measurement has limited value if nobody can act on what it reveals.
2. Define the formula and its boundaries
“Margin” can mean different calculations to different people. One person subtracts contractors, another includes employee time, and a third also allocates office costs.
Specify what counts as revenue, which costs are included, the reporting period and the treatment of unfinished work. A transparent management calculation can be simple, but the definition must remain consistent across the projects being compared.
Avoid borrowing a benchmark before understanding its definition. A figure from another company may use a different cost base, service mix or accounting period. Similar labels do not guarantee comparable numbers.
3. Check the source data
Who records time? When do contractor invoices appear? Are discounts, refunds and approved scope changes included? Can the same expense accidentally be assigned twice?
The first reporting cycle may reveal gaps in data collection rather than poor performance. That is useful information. Fix the records before using the result to judge people or make major changes.
If a value is incomplete, label it as incomplete. Missing hours are not zero hours. An invoice that has not yet been entered does not make delivery cheaper.
4. Establish a baseline
Review several comparable periods or completed projects. If there is little history, describe the baseline as provisional. One unusually large contract can dominate a monthly result.
Separate work with different economics where that distinction affects the decision. Fixed-price projects, hourly work and retainers expose the business to different risks. Seeing those differences can be more useful than producing one blended figure.
A baseline describes where you are starting. It does not automatically define acceptable performance. A consistently poor result can still be a reliable baseline.
5. Explain the target
A target can come from business economics, contractual commitments, previous performance or a tested improvement. “Another agency uses it” is not enough to show that it is appropriate for your team.
Consider the resources needed to achieve the target: training, tools, time or authority to change scope and priorities. Raising a target while leaving the underlying constraints untouched may simply create a larger gap.
Some measures need a range rather than a maximum. Filling every available hour with planned client work can leave no room for interruptions, coordination or learning. Decide which work belongs in the capacity calculation before interpreting the percentage.
6. Agree what happens when the number changes
Write down the response. If forecast project margin falls below the agreed threshold, the project manager checks remaining hours, expected expenses and unapproved scope before the next planning meeting.
Start with investigation. A deviation might reflect missing data, a one-off investment or a deliberate commercial decision. An automatic penalty gives people a reason to hide the problem instead of explaining it.
A practical KPI definition template
A short definition prevents the team from renegotiating the meaning of a measure whenever the result is uncomfortable.
| Field | Example |
|---|---|
| Name | Margin on completed projects after direct costs |
| Purpose | Assess the economics of delivering client work |
| Formula | (Revenue − defined direct costs) / revenue × 100% |
| Included costs | Internal labor cost, contractors and direct purchases |
| Period | Completion month, also reviewed across the quarter |
| Sources | Project revenue and expenses, time records, internal cost rates |
| Owner | Operations lead |
| Baseline | Calculated from comparable projects |
| Target | Agreed after reviewing business economics |
| Response | Investigate by project and cost category |
| Limitations | Does not show company net profit or cash balance |
Also record changes to the definition. If project management time is added to direct costs next month, the margin may fall without any deterioration in delivery. The report should explain the change in the calculation.
Keep a record of which definition applied to each period. Where possible, recalculate earlier periods on the new basis for comparison. Where that is impractical, mark the break in the series instead of presenting it as a continuous trend.
KPI examples and formulas
The following examples are a menu, not a mandatory scorecard. Choose the ones that support your current decisions.
| KPI | Formula | What to check |
|---|---|---|
| Project margin | (Revenue − direct costs) / revenue × 100% | The exact cost scope |
| On-time acceptance rate | Milestones accepted by their due date / all milestones due in the period × 100% | Agreed dates and acceptance criteria |
| Effort variance | (Actual hours − planned hours) / planned hours × 100% | Whether plan and actual cover the same scope |
| Correction effort share | Hours correcting errors / total delivery hours × 100% | Errors separated from additional scope |
| Proposal conversion | Won proposals / all proposals in a defined cohort × 100% | The observation window and unresolved proposals |
| Client retention | Clients from the starting cohort retained / clients at the start × 100% | What “retained” means for the service |
| Overdue receivables share | Overdue amount / total receivables at the reporting date × 100% | Due dates, disputed sums and included balances |
| Planned utilization | Planned hours / available hours × 100% | Absence, internal work and relevant skills |
When the denominator is zero, the percentage is undefined. Show “no calculation base” and the underlying figures. Zero revenue does not turn a negative financial result into a zero margin.
Project margin: the share remaining after defined costs
The studio has 600,000 UAH in revenue from completed projects and 360,000 UAH in direct delivery costs.
Project margin = (600,000 − 360,000) / 600,000 × 100% = 40%.
Here, direct costs include internal labor, contractors and direct purchases. Office rent, company marketing and other overheads have not been deducted. The remaining 240,000 UAH is therefore a result after those specified costs, not net profit.
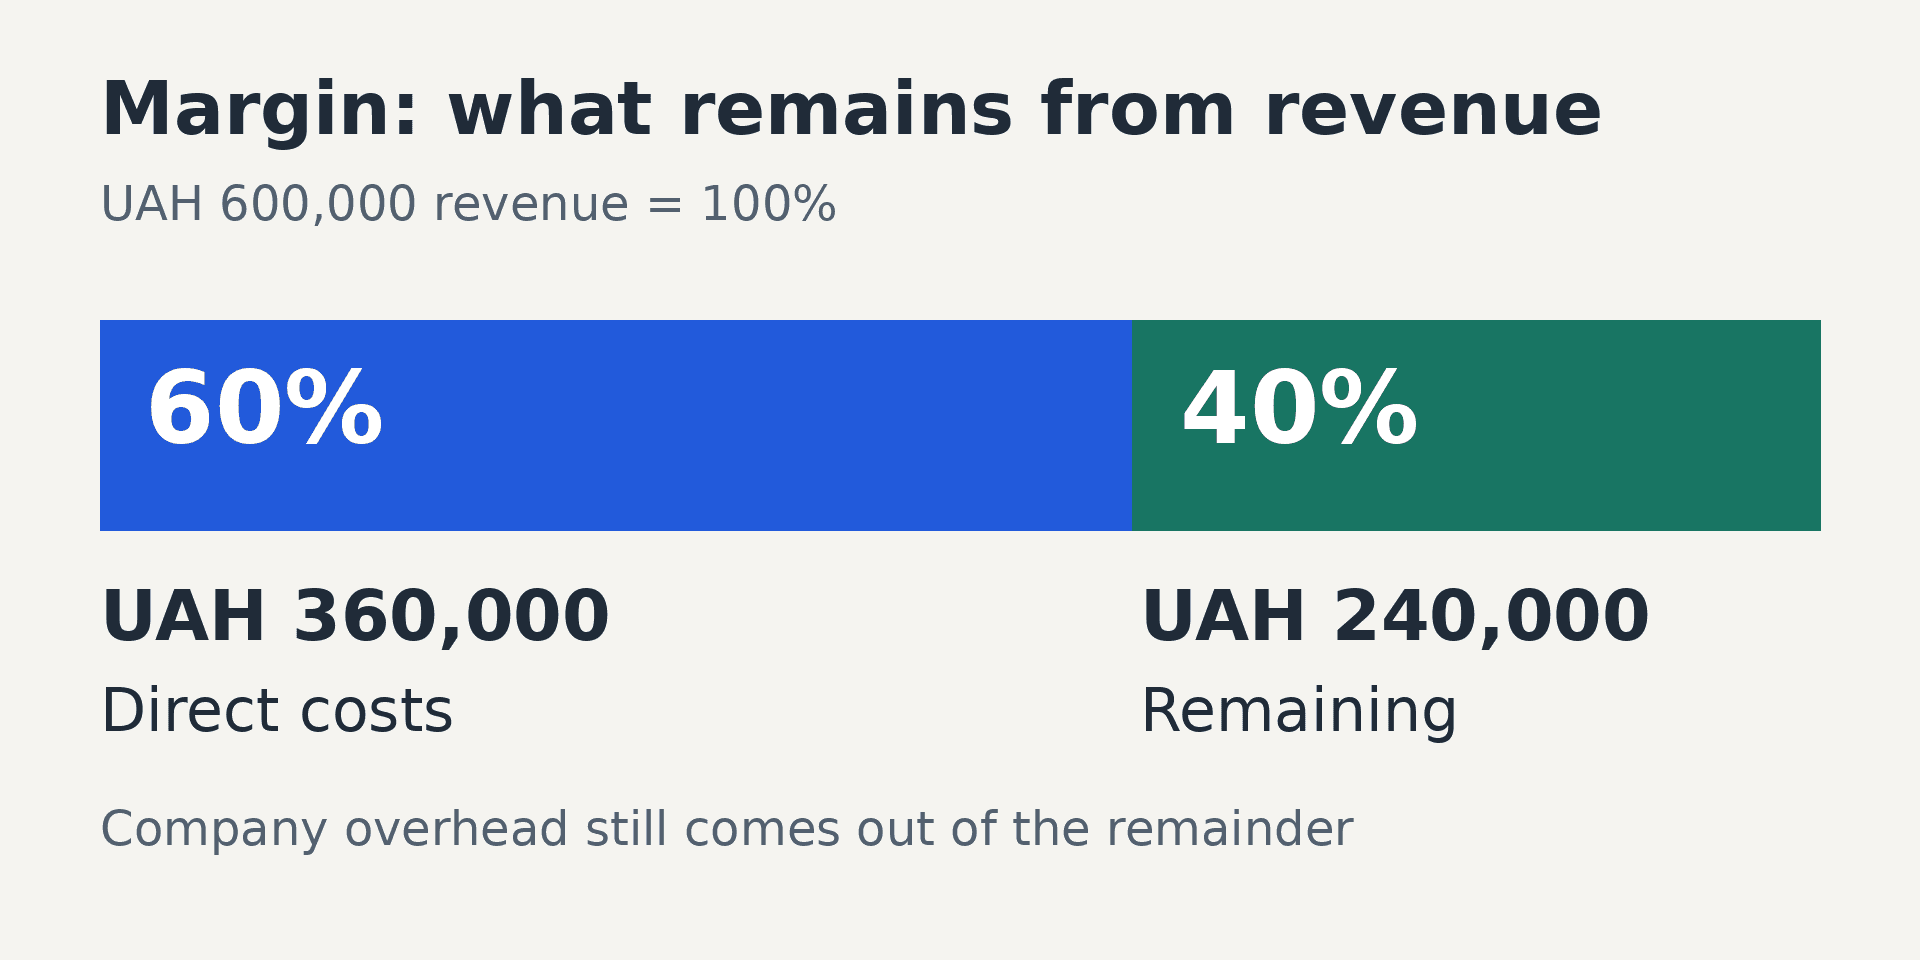
UAH 240,000 after direct costs is 40% of revenue. It is neither company net profit nor the bank balance.
Do not confuse margin with a return calculated against cost. In the same example, 240,000 / 360,000 × 100% = 66.7%. The difference comes from the denominator. If a report labels a figure “profitability,” check its formula before comparing it with margin.
The timing must also match. Comparing a full contract value with only the costs incurred halfway through delivery overstates the apparent result. Use completed work or a clearly labelled estimate of total costs, depending on the question.
Delivery reliability: include everything that was due
Suppose 20 milestones were due for acceptance this month. Sixteen were accepted on time, two were accepted late and two remain unfinished.
On-time acceptance rate = 16 / 20 × 100% = 80%.
Dividing by only the 18 completed milestones would produce 88.9%. That removes the unfinished overdue work from the denominator and makes performance look better. In this definition, the denominator includes every milestone due in the period.
Date changes need a rule too. Preserve the original commitment and record any agreed revision. Otherwise, a team can make the report look healthy by moving all missed dates.
A client delay may explain a missed milestone, but it should not silently disappear from the data. Show the reason separately. The team can then distinguish delivery problems from approval delays while retaining an honest record of commitments.
Effort variance: compare the same scope
A project was estimated at 200 hours. The client then approved another 30 hours of work. Total actual effort was 250 hours.
Compared with the original 200-hour plan, the increase is 25%. That is a valid comparison with the original baseline, but it does not explain the reason.
Compared with the revised 230-hour plan, the overrun is (250 − 230) / 230 × 100% = 8.7%. Keep both views: how much scope was added and how much actual effort exceeded the agreed estimate.
Do not overwrite the original estimate merely to remove a variance. The point is to learn whether estimating, scope control or execution needs attention.
Quality: separate errors from new requests
A team spends 40 out of 500 delivery hours correcting its own errors. The correction effort share is 8%.
Another 25 hours go into a new version requested after the client approved the previous one. Those hours should not automatically be classified as errors.
Agree the categories before reviewing results. Otherwise, one team will label every revision “new scope” while another calls every revision “rework.” Comparing them would say more about their labels than their quality.
The measure also needs context. A small correction caught internally can prevent a costly defect later. Reducing recorded correction hours is not always desirable if it means reducing review or hiding problems.
Sales: give proposals time to reach a decision
Of 20 proposals in one cohort, ten are won, six are lost and four are still open. Conversion among resolved proposals is 10 / 16 = 62.5%. The won share of the full cohort so far is 10 / 20 = 50%.
These are different measures. Name the one you use and avoid comparing a new, unresolved cohort with an older cohort whose decisions are complete.
For a long sales cycle, reporting proposals sent and contracts signed in the same calendar month as a single conversion rate can mix unrelated groups. Track the connection between the proposals and their outcomes.
Retention: define the starting group
Suppose a studio starts a period with 20 active retainer clients. Eighteen of those clients remain at the end. Retention for the starting cohort is 18 / 20 = 90%.
Three new clients joined during the period, bringing the ending total to 21. They are important for growth, but they do not belong in the numerator of that retention calculation.
For one-off project work, “active client” needs a different definition. A customer who buys a website every three years should not automatically be treated as lost after one quiet month. Choose a window that fits the service and explain it.
How to interpret KPI results
Percentages and percentage points
A margin moving from 45% to 40% has fallen by five percentage points. Its relative decline is 5 / 45 × 100%, or approximately 11.1%.
A short management report can show the old value, new value and percentage-point change. “Margin fell by 5%” is ambiguous in this situation.
Use the same care with growth. Revenue rising from 500,000 to 600,000 UAH is a 20% increase. A later fall from 600,000 to 500,000 UAH is a 16.7% decrease because the starting base is different.
An unweighted average can hide the main result
Project A earns 100,000 UAH with a 60% margin. Project B earns 500,000 UAH with a 36% margin. Their simple average margin is 48%.
However, the total amount remaining is 60,000 + 180,000 = 240,000 UAH. Combined margin is 240,000 / 600,000 × 100% = 40%.
The larger project has more influence on the studio’s finances. To calculate combined margin, add revenue and costs first, then calculate the ratio. A simple average answers a different question: the average percentage per project regardless of project size.
Show the number of observations
If one of four milestones is late, the on-time rate is 75%. If one of 40 is late, it is 97.5%. Show the count alongside the percentage: 3/4 or 39/40.
Avoid declaring a trend from one month alone. Check project mix, seasonality, sample size and unusual events. A movement may matter without proving that the underlying process has changed.
Small teams do not need to imitate enterprise reporting. A short explanation of the few projects behind the change may be more informative than a chart with a smooth trend line.
A change after an intervention does not prove causation
Margin improves after the studio introduces scope approval. The rule may have helped. But the studio may also have raised prices or completed a less complex project in the same period.
Compare similar work, examine unapproved hours and check whether the team actually followed the new process. A small business cannot always run a controlled experiment, but it can avoid treating a coincidence as proof.
Write down the expected mechanism before the change. For example: “Approval before starting extra work should reduce unpaid delivery hours.” That gives the team something more specific to test than “performance should improve.”
How a scope change affects forecast margin
Fictional Contour Studio agrees a project fee of UAH 240,000 and wants to retain 40% after direct costs. Its cost ceiling is UAH 144,000. This is an assumption for the example, not a benchmark for other businesses. All figures use a consistent basis without mixing tax components.
The initial plan includes 200 hours at an internal cost of UAH 500 per hour, UAH 20,000 for a contractor and UAH 10,000 in other costs. Total cost is UAH 130,000, giving a 45.8% margin. An internal cost rate is different from the hourly rate charged to a client.
At the next review, the team revises the remaining work:
| Component | Calculation | Amount |
|---|---|---|
| Work already performed | 150 hours × UAH 500 | UAH 75,000 |
| Other costs already incurred | Recorded costs | UAH 20,000 |
| Remaining work | 90 hours × UAH 500 | UAH 45,000 |
| Other expected costs | Current plan | UAH 10,000 |
| Forecast total cost | Actual plus remaining costs | UAH 150,000 |
Forecast margin is (240,000 − 150,000) / 240,000 × 100% = 37.5%. Costs exceed the ceiling by UAH 6,000. Subtracting only the UAH 95,000 already incurred from the contract fee would leave unfinished work out of the calculation.
The manager investigates the additional hours, separating new client requests from error corrections and work already covered by the contract. The client agrees an additional UAH 20,000 for the extra scope. That work is already included in forecast costs, so the revised margin is (260,000 − 150,000) / 260,000 × 100% = 42.3%. If the agreement adds work beyond that forecast, its cost must be included too.
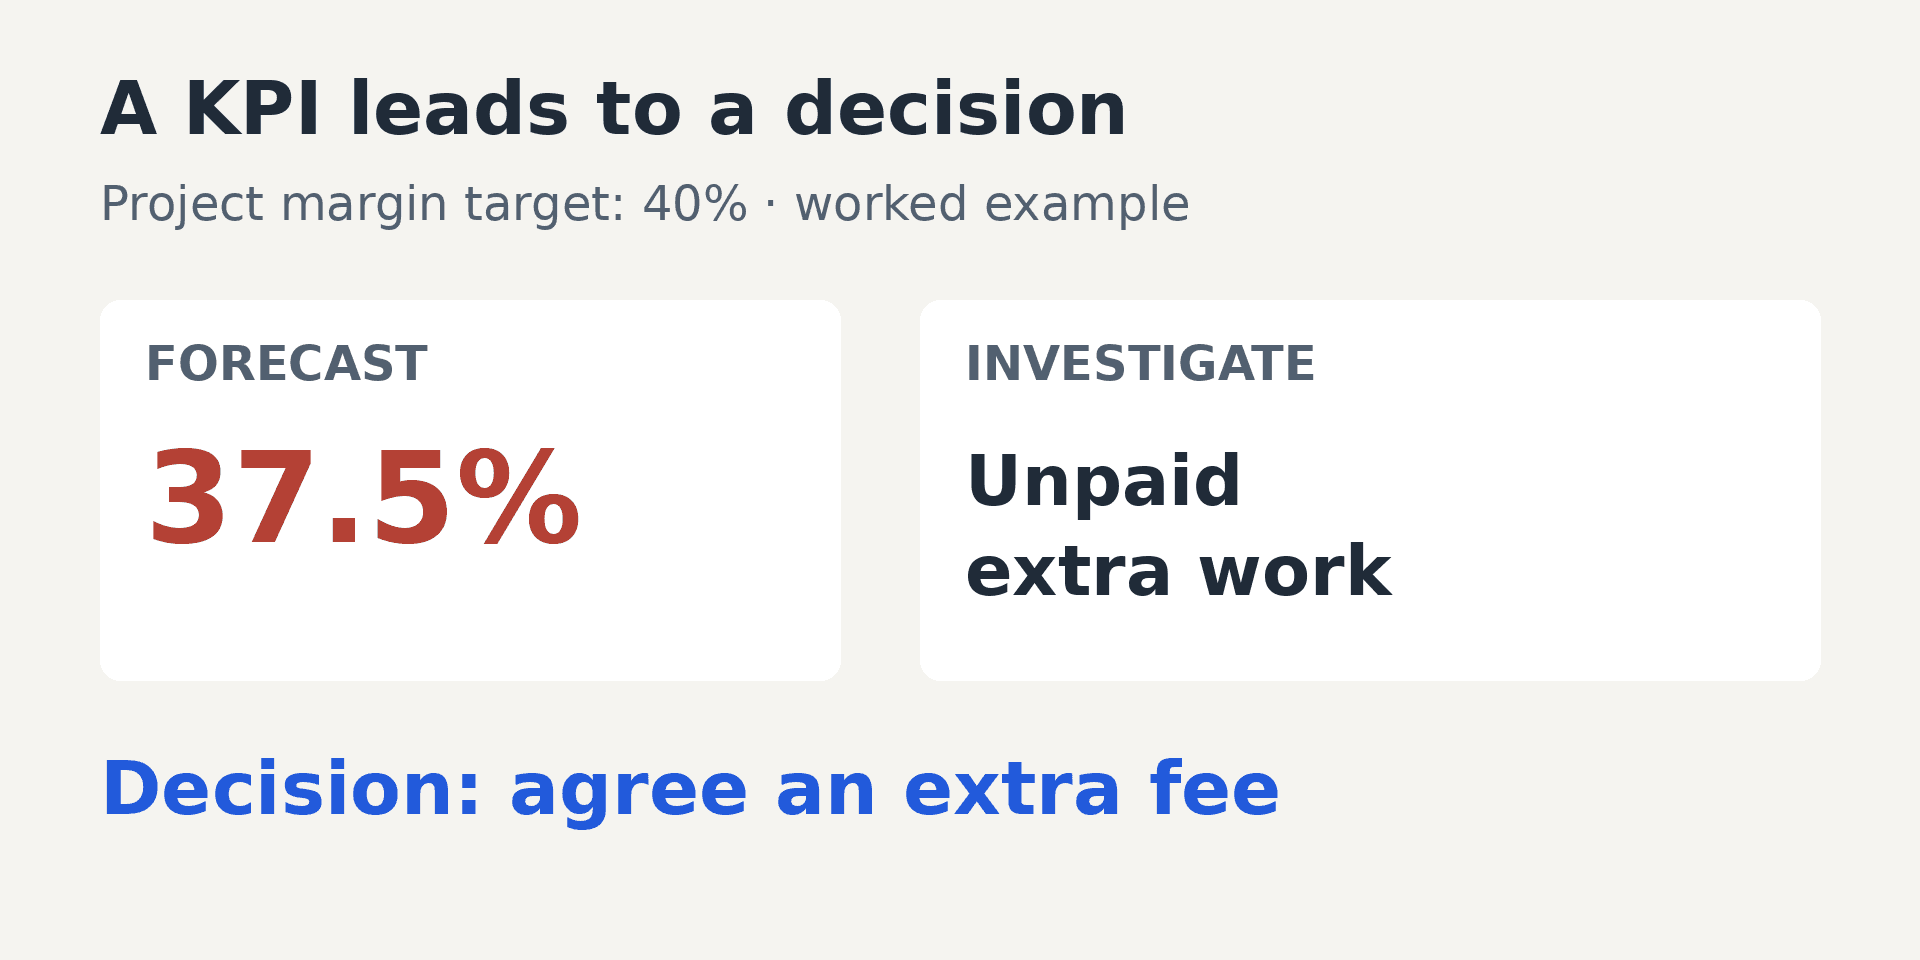
Worked example: forecast margin is below target. After checking the extra scope, the manager discusses an additional fee with the client.
Record the client’s approval, agreed scope, responsible manager and next review date. An additional fee does not create available hours: check people and delivery dates separately.
Practice in if.team: what to check on screen
A KPI needs reliable source records. These if.team screens support four checks: task records, labor costs, forecast expenses and company performance.
Tasks: check the planning inputs
Owners and dates appear alongside actual and estimated hours. A completed task can exceed its estimate: the visible “Final BIM Model Audi…” row shows 57 hours against 20. Use that variance to investigate scope and effort, not to assign blame from the percentage alone.
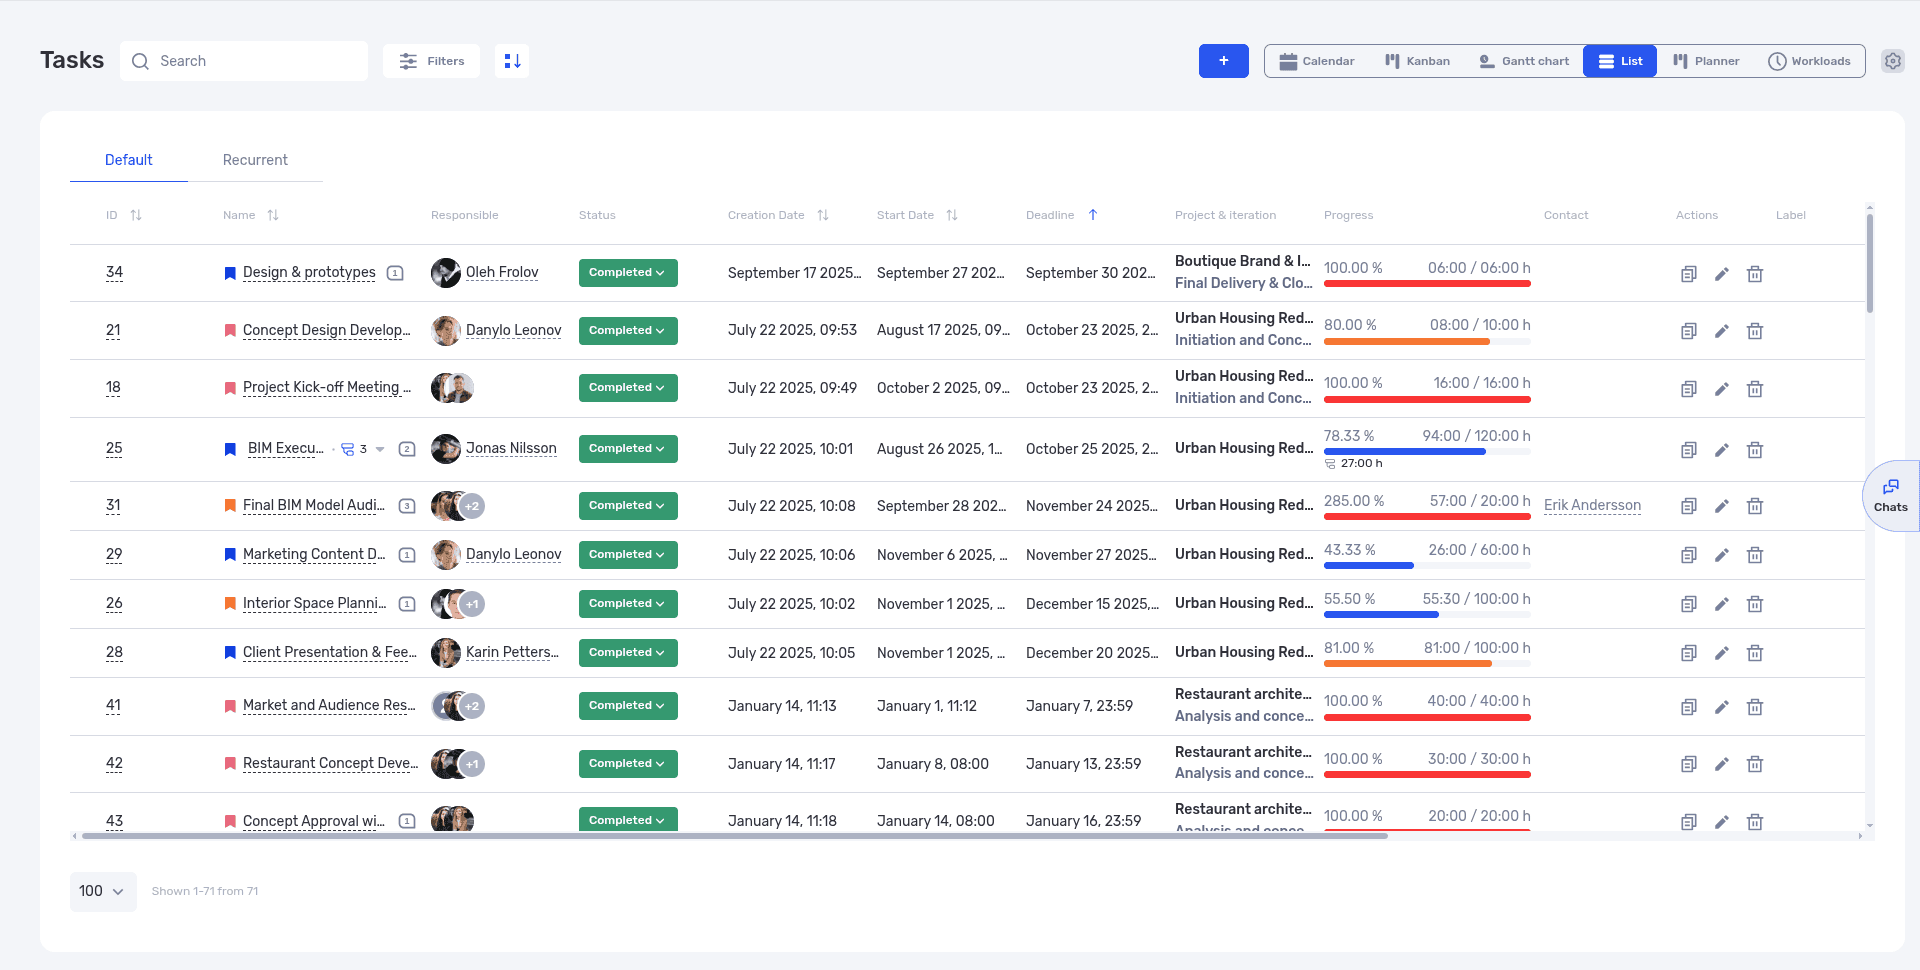
The task list shows owners, dates and recorded time alongside the estimate.
Report: check hours and labor costs
The report connects recorded hours, estimates and labor costs. The visible “Design & prototypes” row shows 6 hours against a 6-hour estimate. Check that records and internal rates are complete before using costs in a KPI.
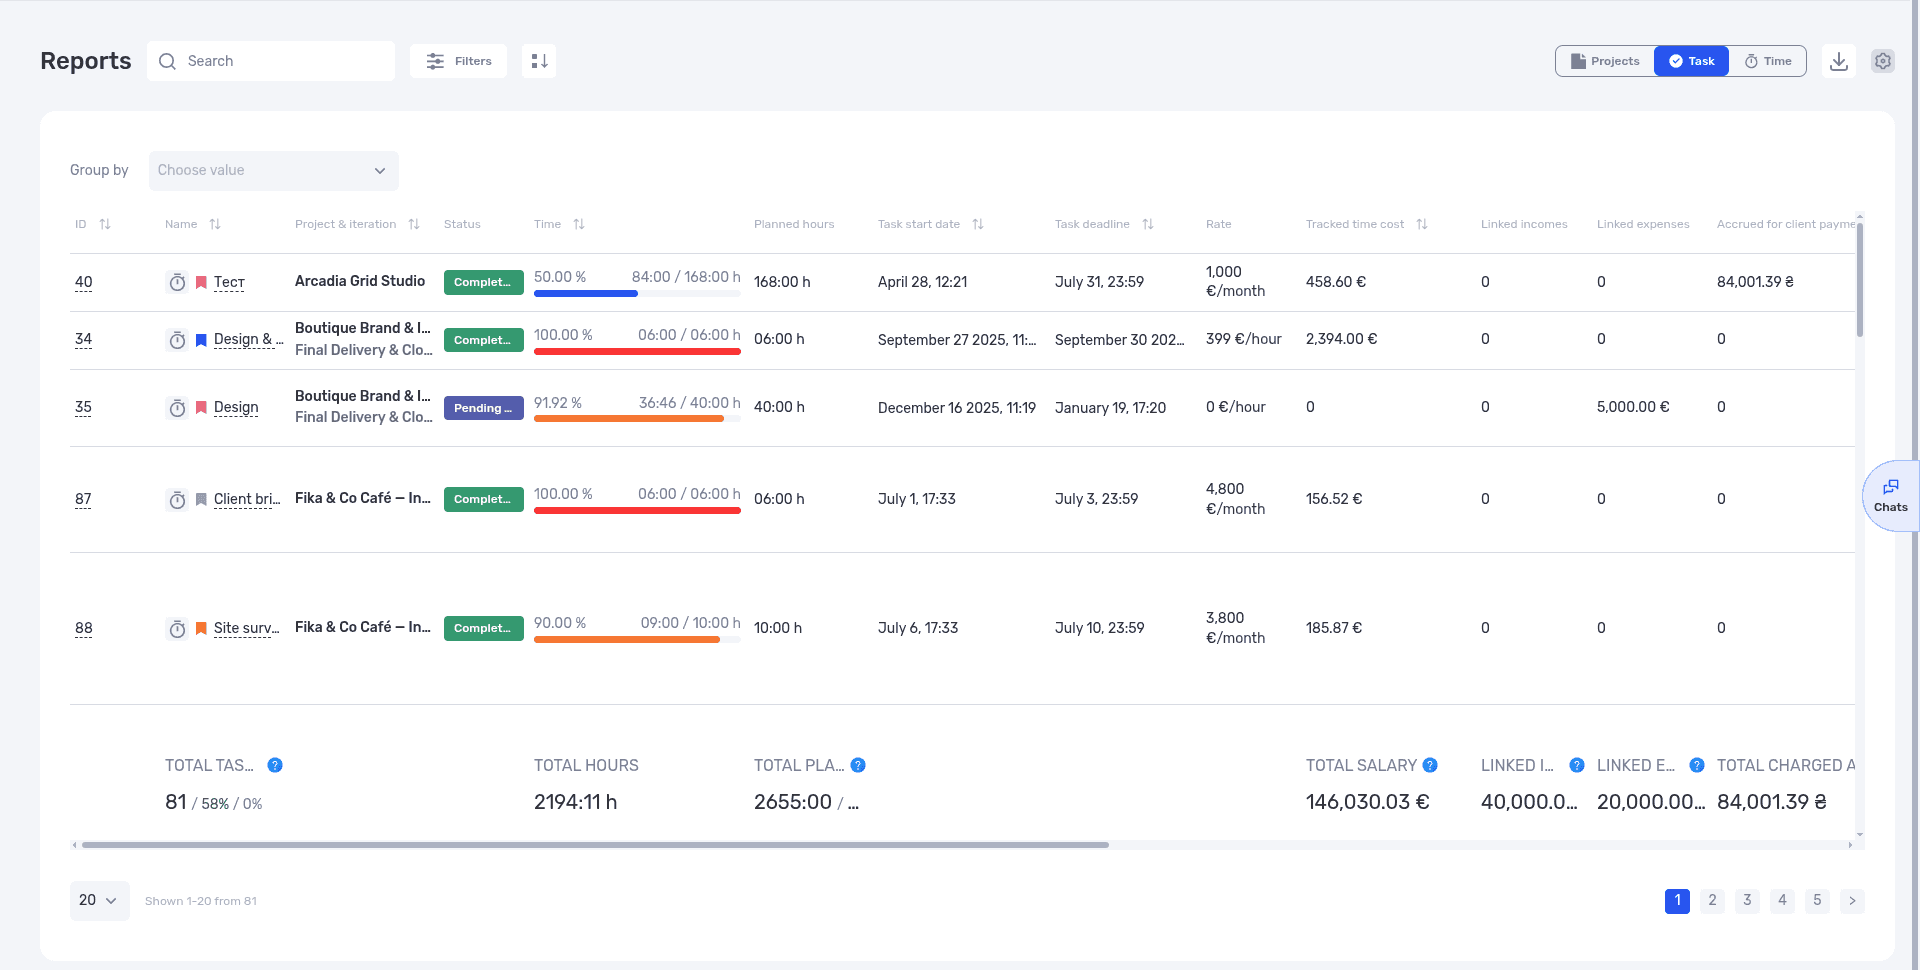
Compare recorded time with estimates and check the cost of the work in the report.
Forecast: compare actual and full planned costs
With Planning enabled, Total Expenses shows €128,035.97 actual and €212,932.13 planned — a difference of €84,896.16. Check the hours and expense records behind that difference. Do not add the full planned total to actual costs: first establish whether the plan already includes work performed.
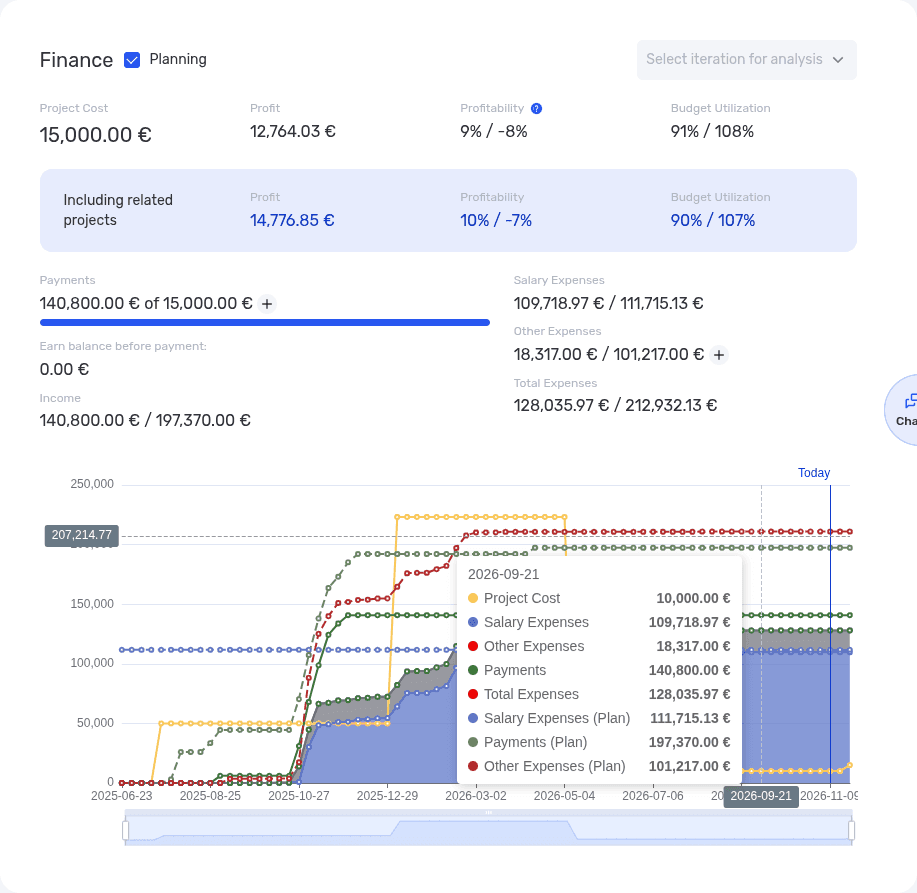
Planning adds forecast values alongside actual project costs.
P&L: review the company result
P&L compares company income and expenses for the selected period. Check that costs outside individual projects are included. Review Cash Flow and payment dates separately when assessing cash availability.
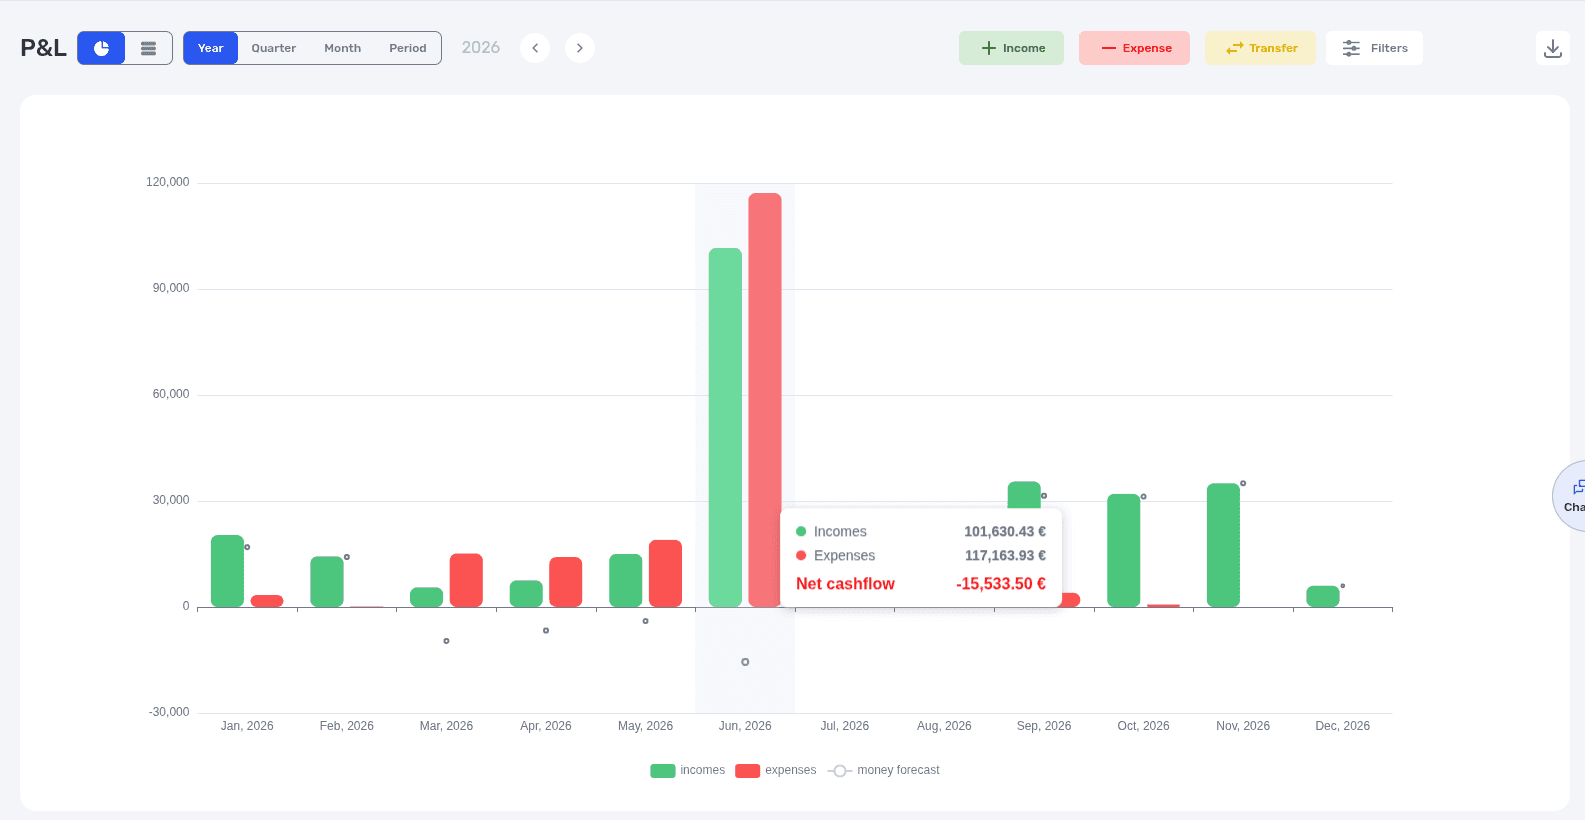
Use P&L to review company performance, including costs outside projects. Check cash availability separately in Cash Flow.
Check the forecast inputs before using a KPI
In project financial planning, check whether planned hours mean total effort or remaining effort. In the Contour calculation, 150 hours worked plus 90 remaining means 240 hours in total. Entering 90 in a total-effort field would understate the plan. Retain the original 200-hour estimate for comparison.
Check internal cost rates and missing records. Do not add salary costs again if the same labor has already been costed through hours and rates. A salaried employee’s allocated hourly cost is not necessarily an additional cash payment. Before comparing the article’s margin with an interface percentage, check its denominator and included costs.
Review shared workload before accepting additional work. For company performance, use the P&L guide; review cash flow separately. Contract value, revenue and money received serve different purposes in these calculations.
What the system provides and what the team defines
if.team connects tasks, time, budgets, financial transactions, planning and reports. Choosing KPIs, setting targets and defining calculation rules remain management decisions.
The on-time acceptance rate, proposal conversion and correction effort share in this article are separate calculations with explicit definitions. Do not assume that every formula is already available as a built-in interface card. Some measures may require a spreadsheet or another report based on the available data.
Check whether the required fields and events exist. A task completion timestamp is not automatically the client’s acceptance date. They can be used interchangeably only if the team’s process genuinely treats them as the same event.
Likewise, a task being overdue does not tell you why. The underlying discussion may show a missing client input, an unrealistic estimate or an internal delay. The report should lead to that evidence rather than replace it.
Introduce one KPI and use it to make a decision
For the first cycle, choose one measure, such as completed-project margin. Calculate it manually for several projects and compare it with the system's data. If the results differ, check hours, rates and included costs.
At the next review, investigate one deviation. Suppose two projects contain unpaid additional revisions. The manager checks the scope and agrees an extra fee or a boundary for further work with each client. Record an owner and a date to check the outcome.
Match the review frequency to the decision: remaining hours on a risky project belong in weekly planning; final margin is reviewed at completion. On the project dashboard, show the period, actual or forecast value, target and source records. Add a brief decision note: “Extra fee approved; review remaining hours on Friday.”
Why not link every KPI to a bonus immediately?
A management measure and a pay rule serve different purposes. Once compensation depends on a number, every ambiguity becomes more consequential: what counts as complete, who owns an external delay and how additional scope is treated.
A bonus based solely on closed tasks encourages small task counts to grow or difficult work to be avoided. A bonus based solely on speed can encourage handing over unreviewed work.
First establish that the measure is reproducible, related to the desired outcome and substantially within the person’s influence. Discuss exceptions and disputed cases. Shared work often needs team context and professional judgement as well as numbers.
Hours should not become a simple ranking of employee value. More time may reflect a harder task, learning, unclear requirements or a technical problem. Time records help with costing and planning, but do not independently measure the quality of someone’s contribution.
Consider what happens when the target is met in the least useful possible way. If that behavior would harm the business, revise the measure, the incentive or the safeguards before applying it.
Three reporting errors that are easy to miss
Missing records look like savings. Unlogged designer hours or a missing contractor invoice understate costs. Mark the data as incomplete and collect the records before judging margin.
Unlike work is combined into one average. Support, development against an agreed brief and exploratory work have different uncertainty. Compare similar work and show the breakdown alongside the overall result.
The formula changes without a note on the chart. If costs now include the manager's hours, mark when the definition changed. Otherwise a lower margin may look like deteriorating delivery when it reflects a change in accounting.
KPI FAQ
What does KPI stand for?
KPI stands for Key Performance Indicator. It is a measure selected to assess an important outcome or aspect of performance. Its usefulness depends on a clear definition, reliable data and a decision it supports.
Is a KPI a target or an actual result?
The KPI is the measure. It can have a target, an actual value and a forecast. For example, the target margin may be 40%, the current forecast 37.5% and the final margin a separate value after completion.
Is there one formula for calculating KPIs?
No. The formula depends on the question. Actual divided by target can describe attainment for some measures, but it does not work as a universal performance score. Lower costs or fewer errors may be better, while some measures need an acceptable range.
How many KPIs should a team have?
Enough to support its important decisions without creating unnecessary reporting. Start with a specific problem. If a measure does not influence any decision over several reviews, reconsider whether it is still key.
How do you measure creative or complex work?
Combine relevant data with review of the output: acceptance, quality of reasoning and fit with requirements. Counts of deliverables or hours cannot replace professional evaluation. Agree the criteria before work starts.
Can you track KPIs in a spreadsheet?
Yes. A spreadsheet can be a good starting point when definitions, ownership and source data are clear. As copying hours, expenses and task information becomes repetitive, connect the underlying sources and use spreadsheets for calculations that still need them.
Should KPIs change every quarter?
Not automatically. Review them when goals, processes or available data change. A useful measure can remain relevant for years. Targets and definitions may change more often, but those changes should be explained.
What should happen when a KPI is missed?
Check the data, investigate the cause and then decide what to change. A missed target may reveal a process issue, an unrealistic plan or a deliberate trade-off. The number alone does not determine who is responsible.
Can a business meet its KPIs and still perform badly?
Yes, if the measures leave out an important outcome or encourage the wrong behavior. Fast replies can coexist with unresolved customer problems. Revenue growth can coexist with weaker margins. Review the result and the way it was achieved.
Test your KPI formula on real projects
Choose one result that matters now. Write down the formula, data source, baseline and decision you will make when performance changes. Test the calculation against a few real examples.
For a project team, one practical starting point is the economics of a single job: agreed scope, planned hours, actual costs and an up-to-date estimate of remaining work. In if.team, these records can be connected to tasks and project finances. The KPI then helps the team decide whether to change the plan, scope or price—and check the outcome of that decision.
Author
Vladyslav ChesnokovPublished
Mar 2, 2026
More articles to read
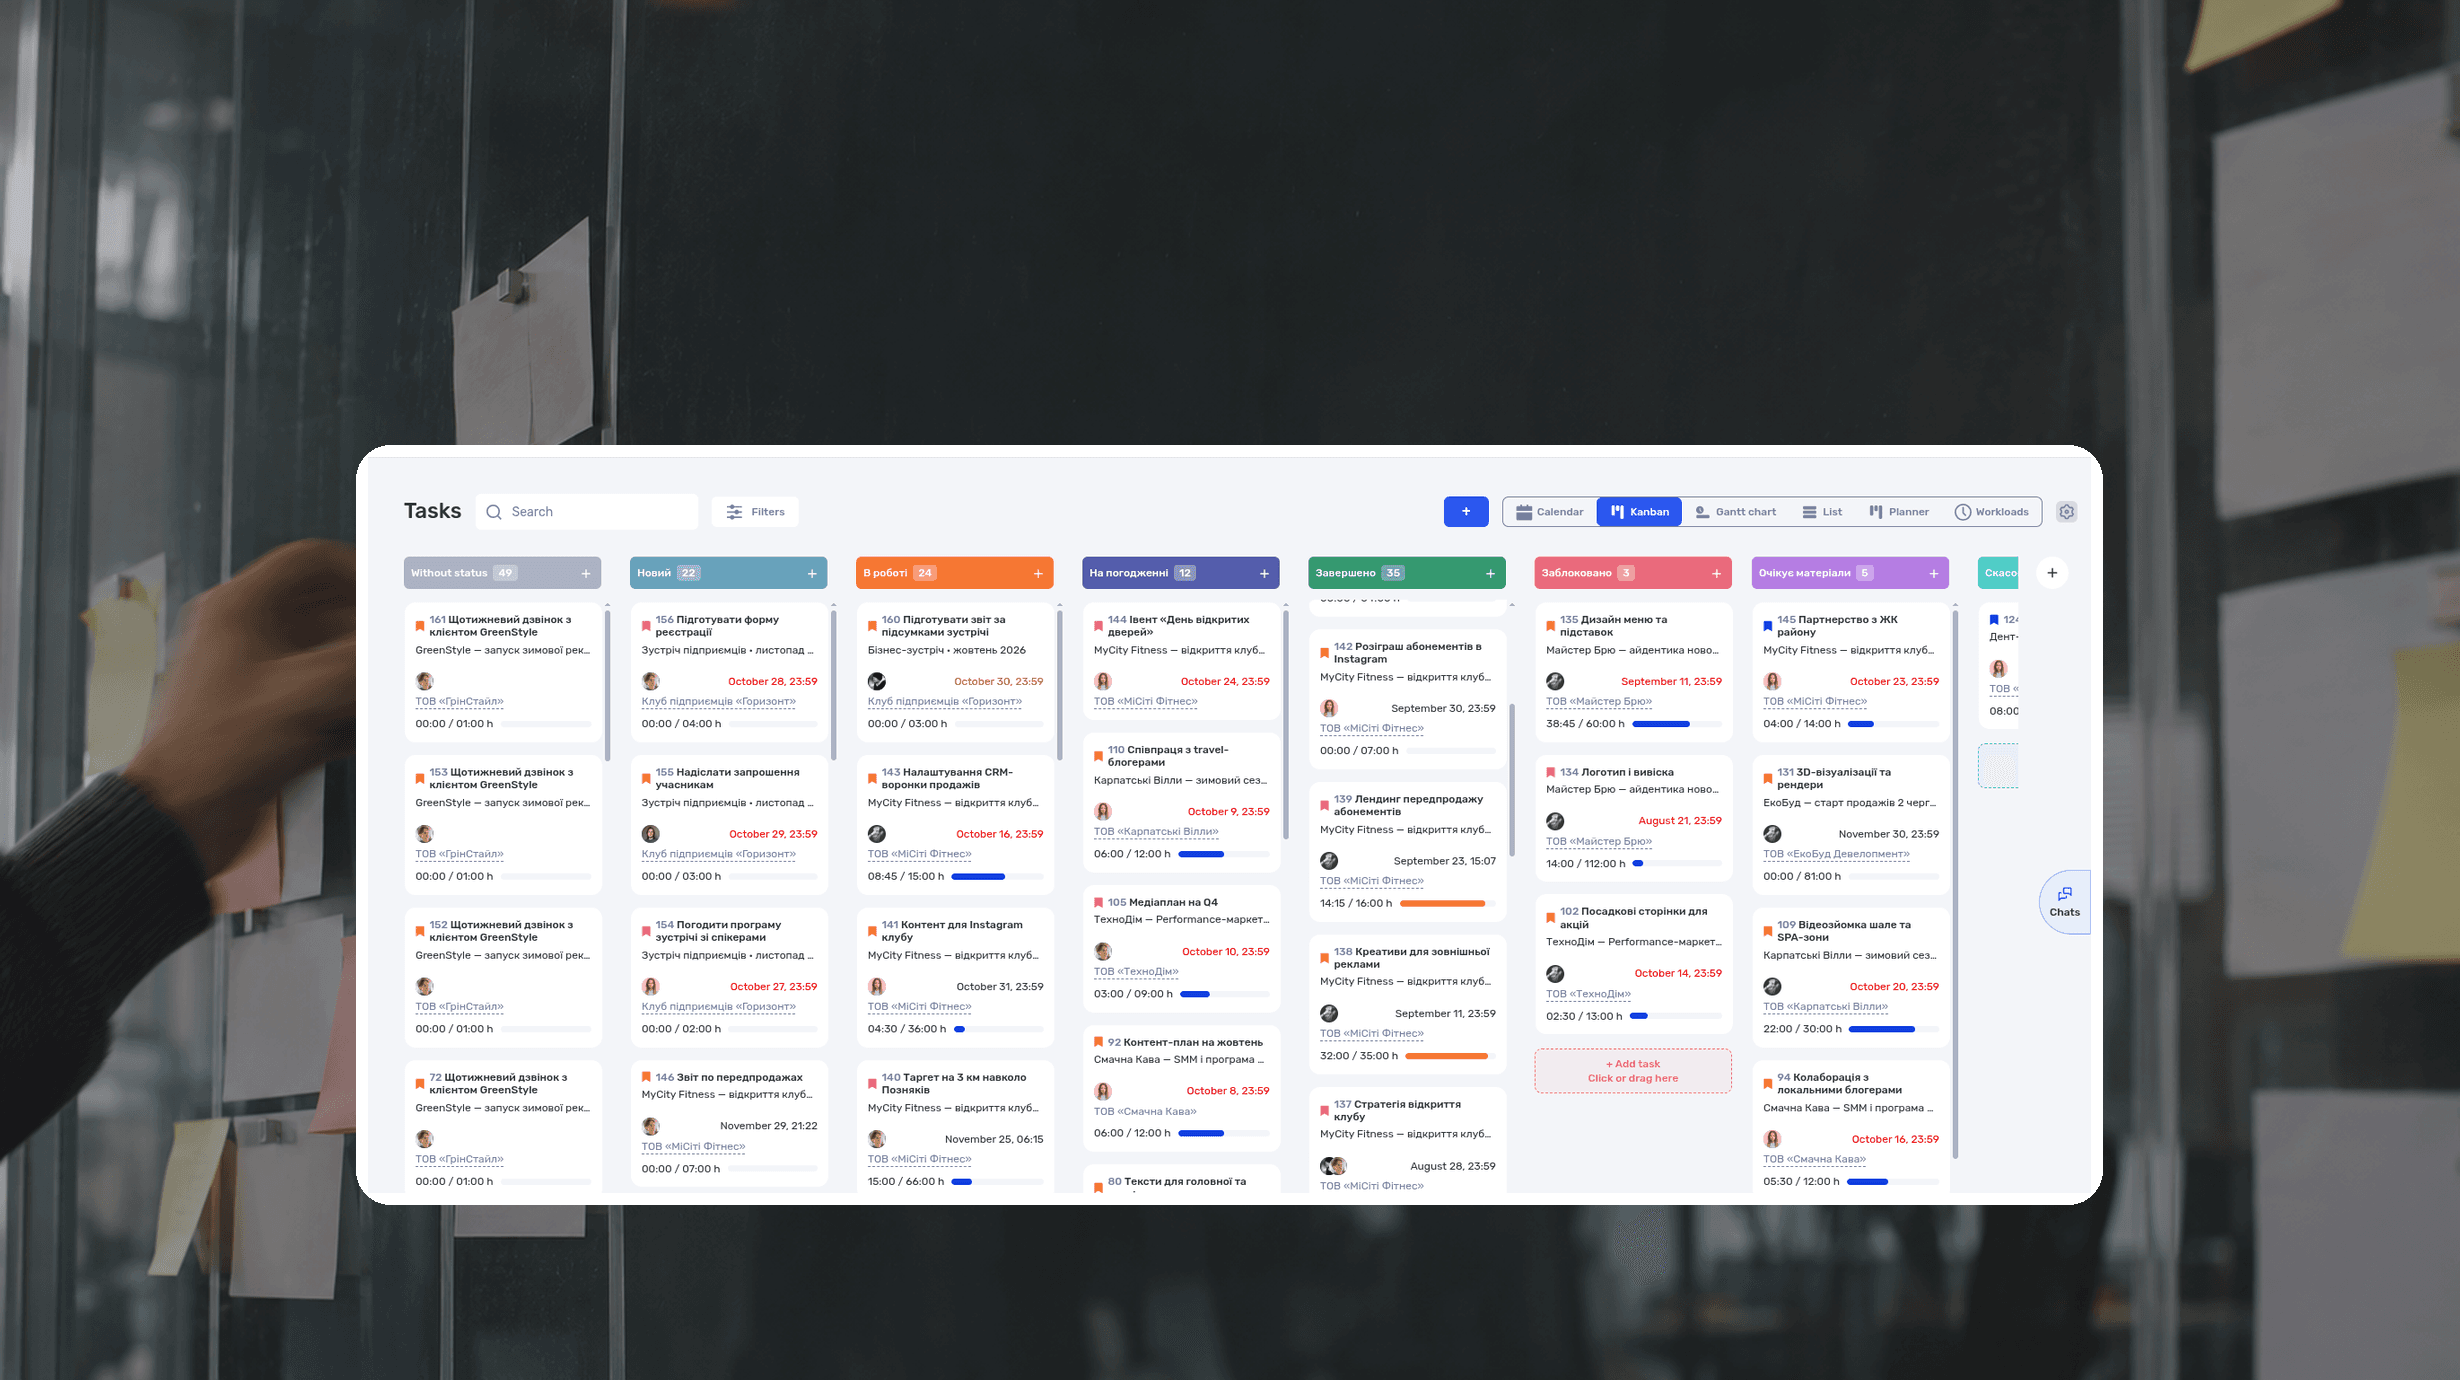
What Is a Kanban Board? Definition, Examples, Setup
A Kanban board is a visual workflow tool that represents work as cards moving through columns. The columns show each stage of the process, while work-in-progress limits control how many items a team handles at once. The board makes blocked work, queues, and delays visible.

RACI Matrix: Definition, Free Template and Example
A RACI matrix is a table that shows who does the work on a project, who accepts the result, who gives input, and who gets updates. The name comes from the four roles: Responsible, Accountable, Consulted, Informed. Rows are deliverables or decisions, columns are people or roles.
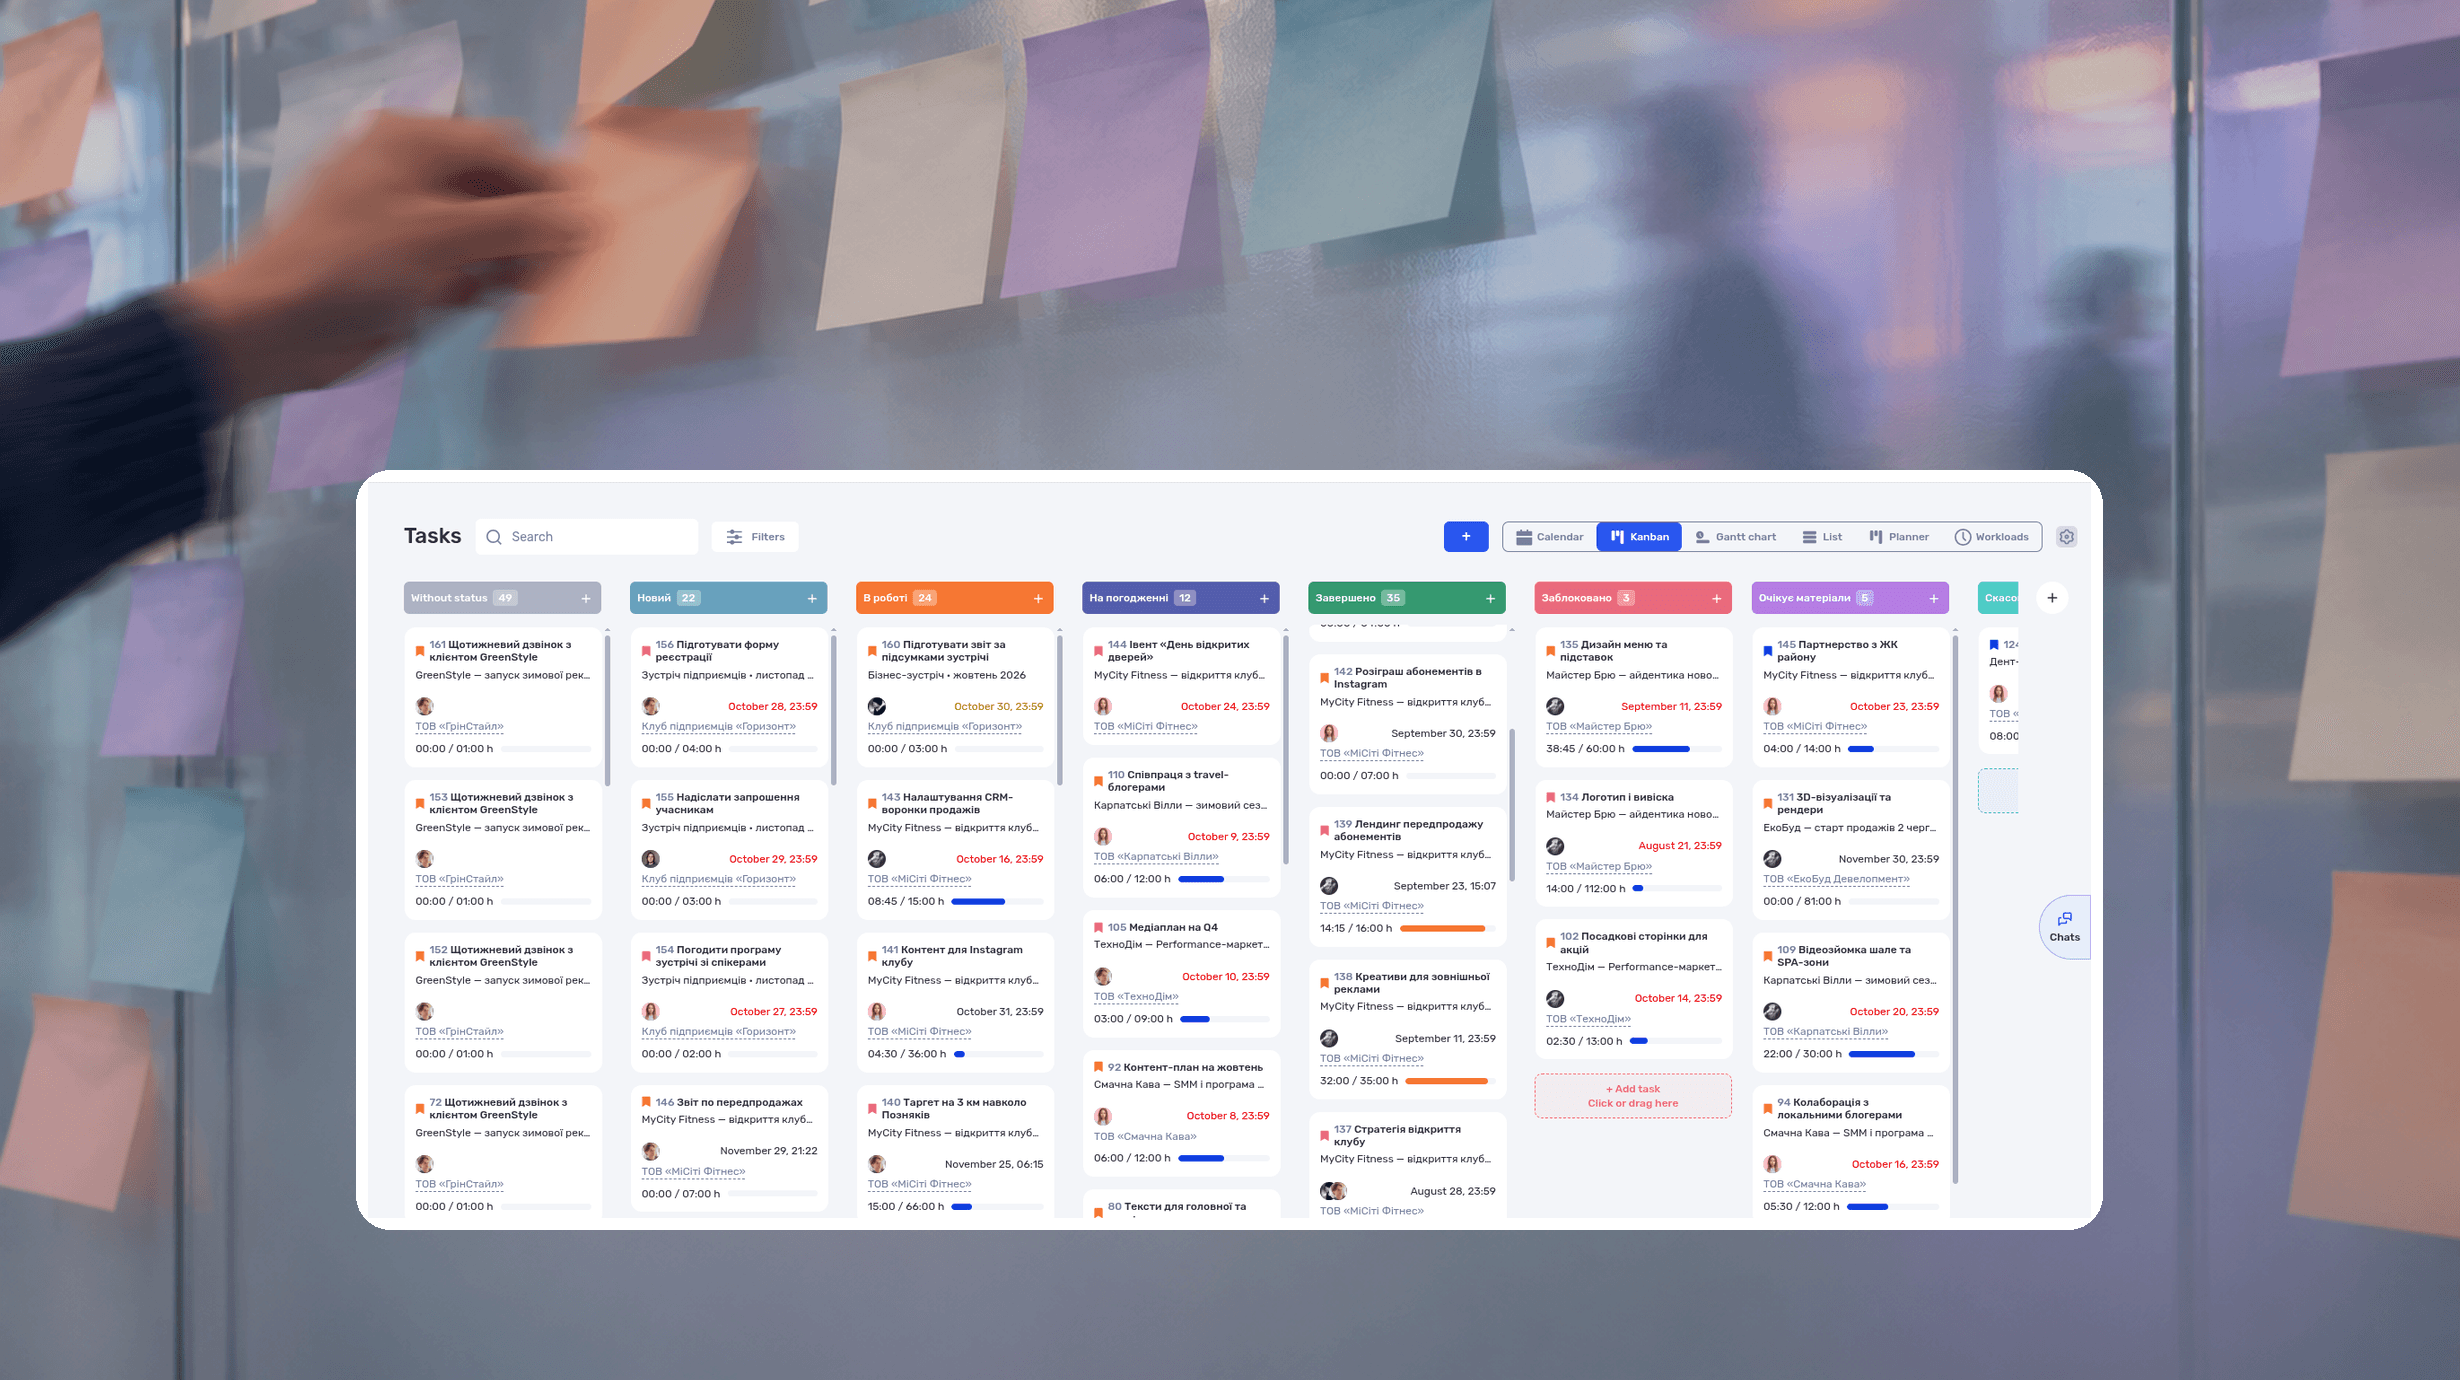
Agile Methodology: What It Is, Principles, Example
Agile methodology is an approach to project management in which a team delivers results in short cycles, shows them to the client and adjusts the plan based on feedback. Instead of one big six-month plan, agile project management works in a series of small, tested steps.
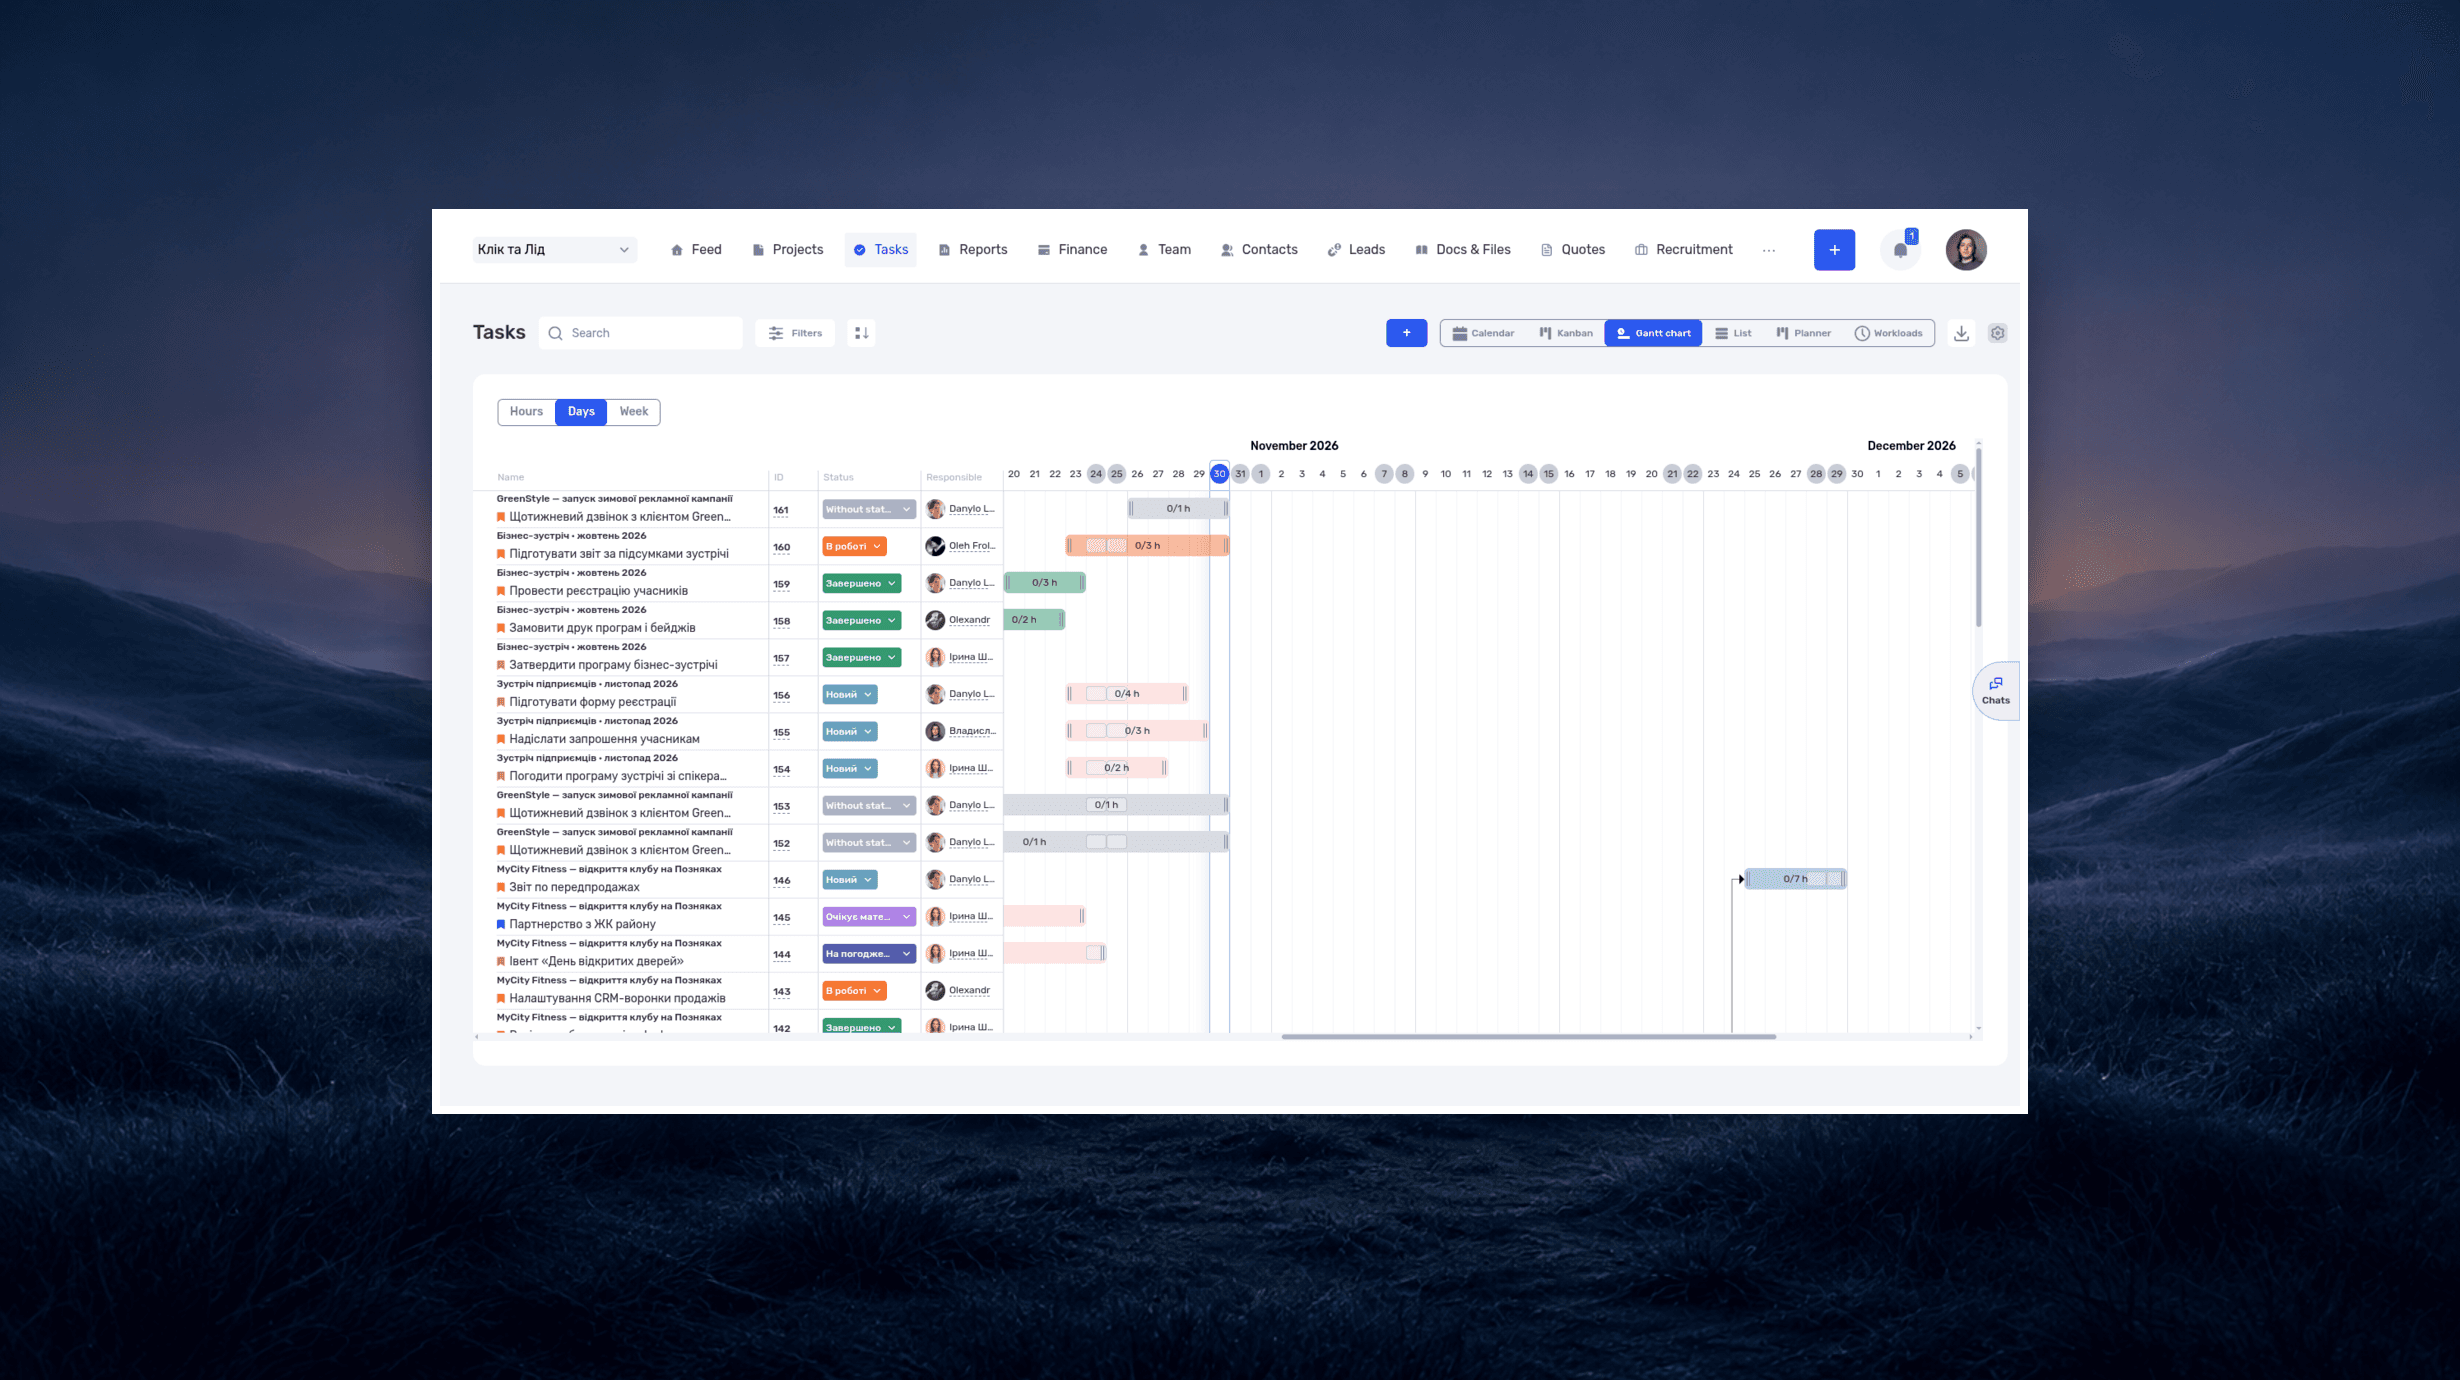
What is a deadline? How to set and meet realistic deadlines
Why six hours of work can take several days—and how to build a schedule around availability, review, and revisions. With a practical if.team walkthrough.
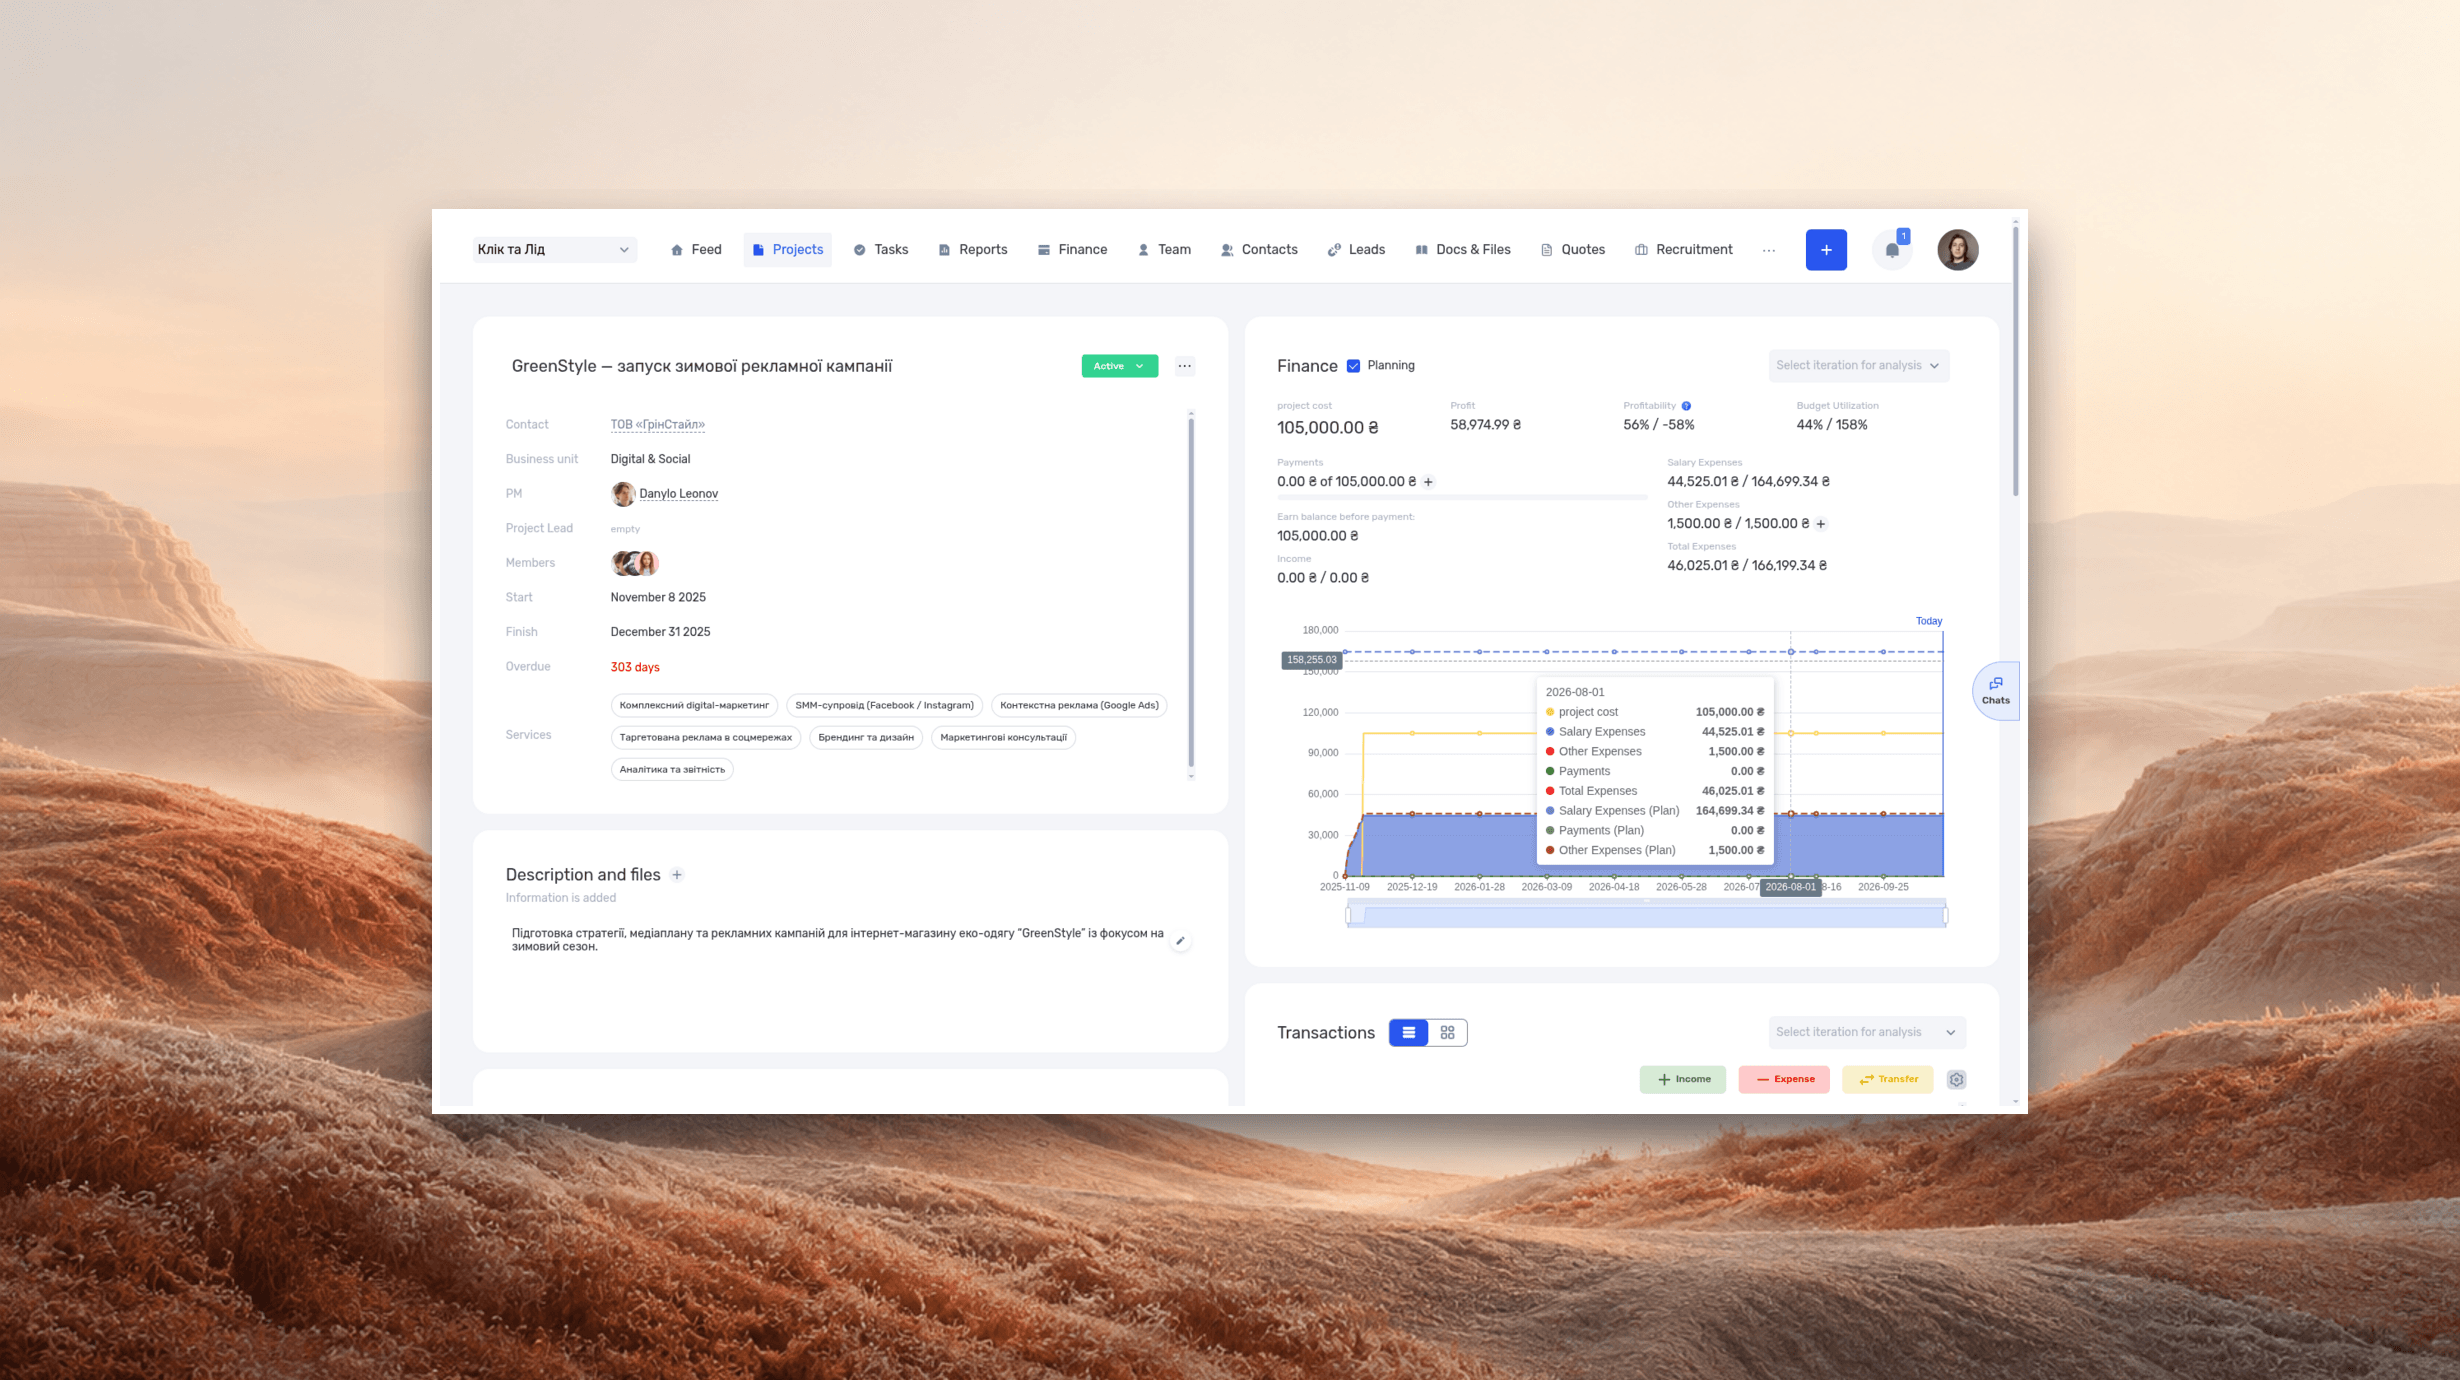
ERP systems explained—what they do and when your business needs one
See how ERP connects sales, delivery, and finances, with a worked example and a practical walkthrough in if.team.
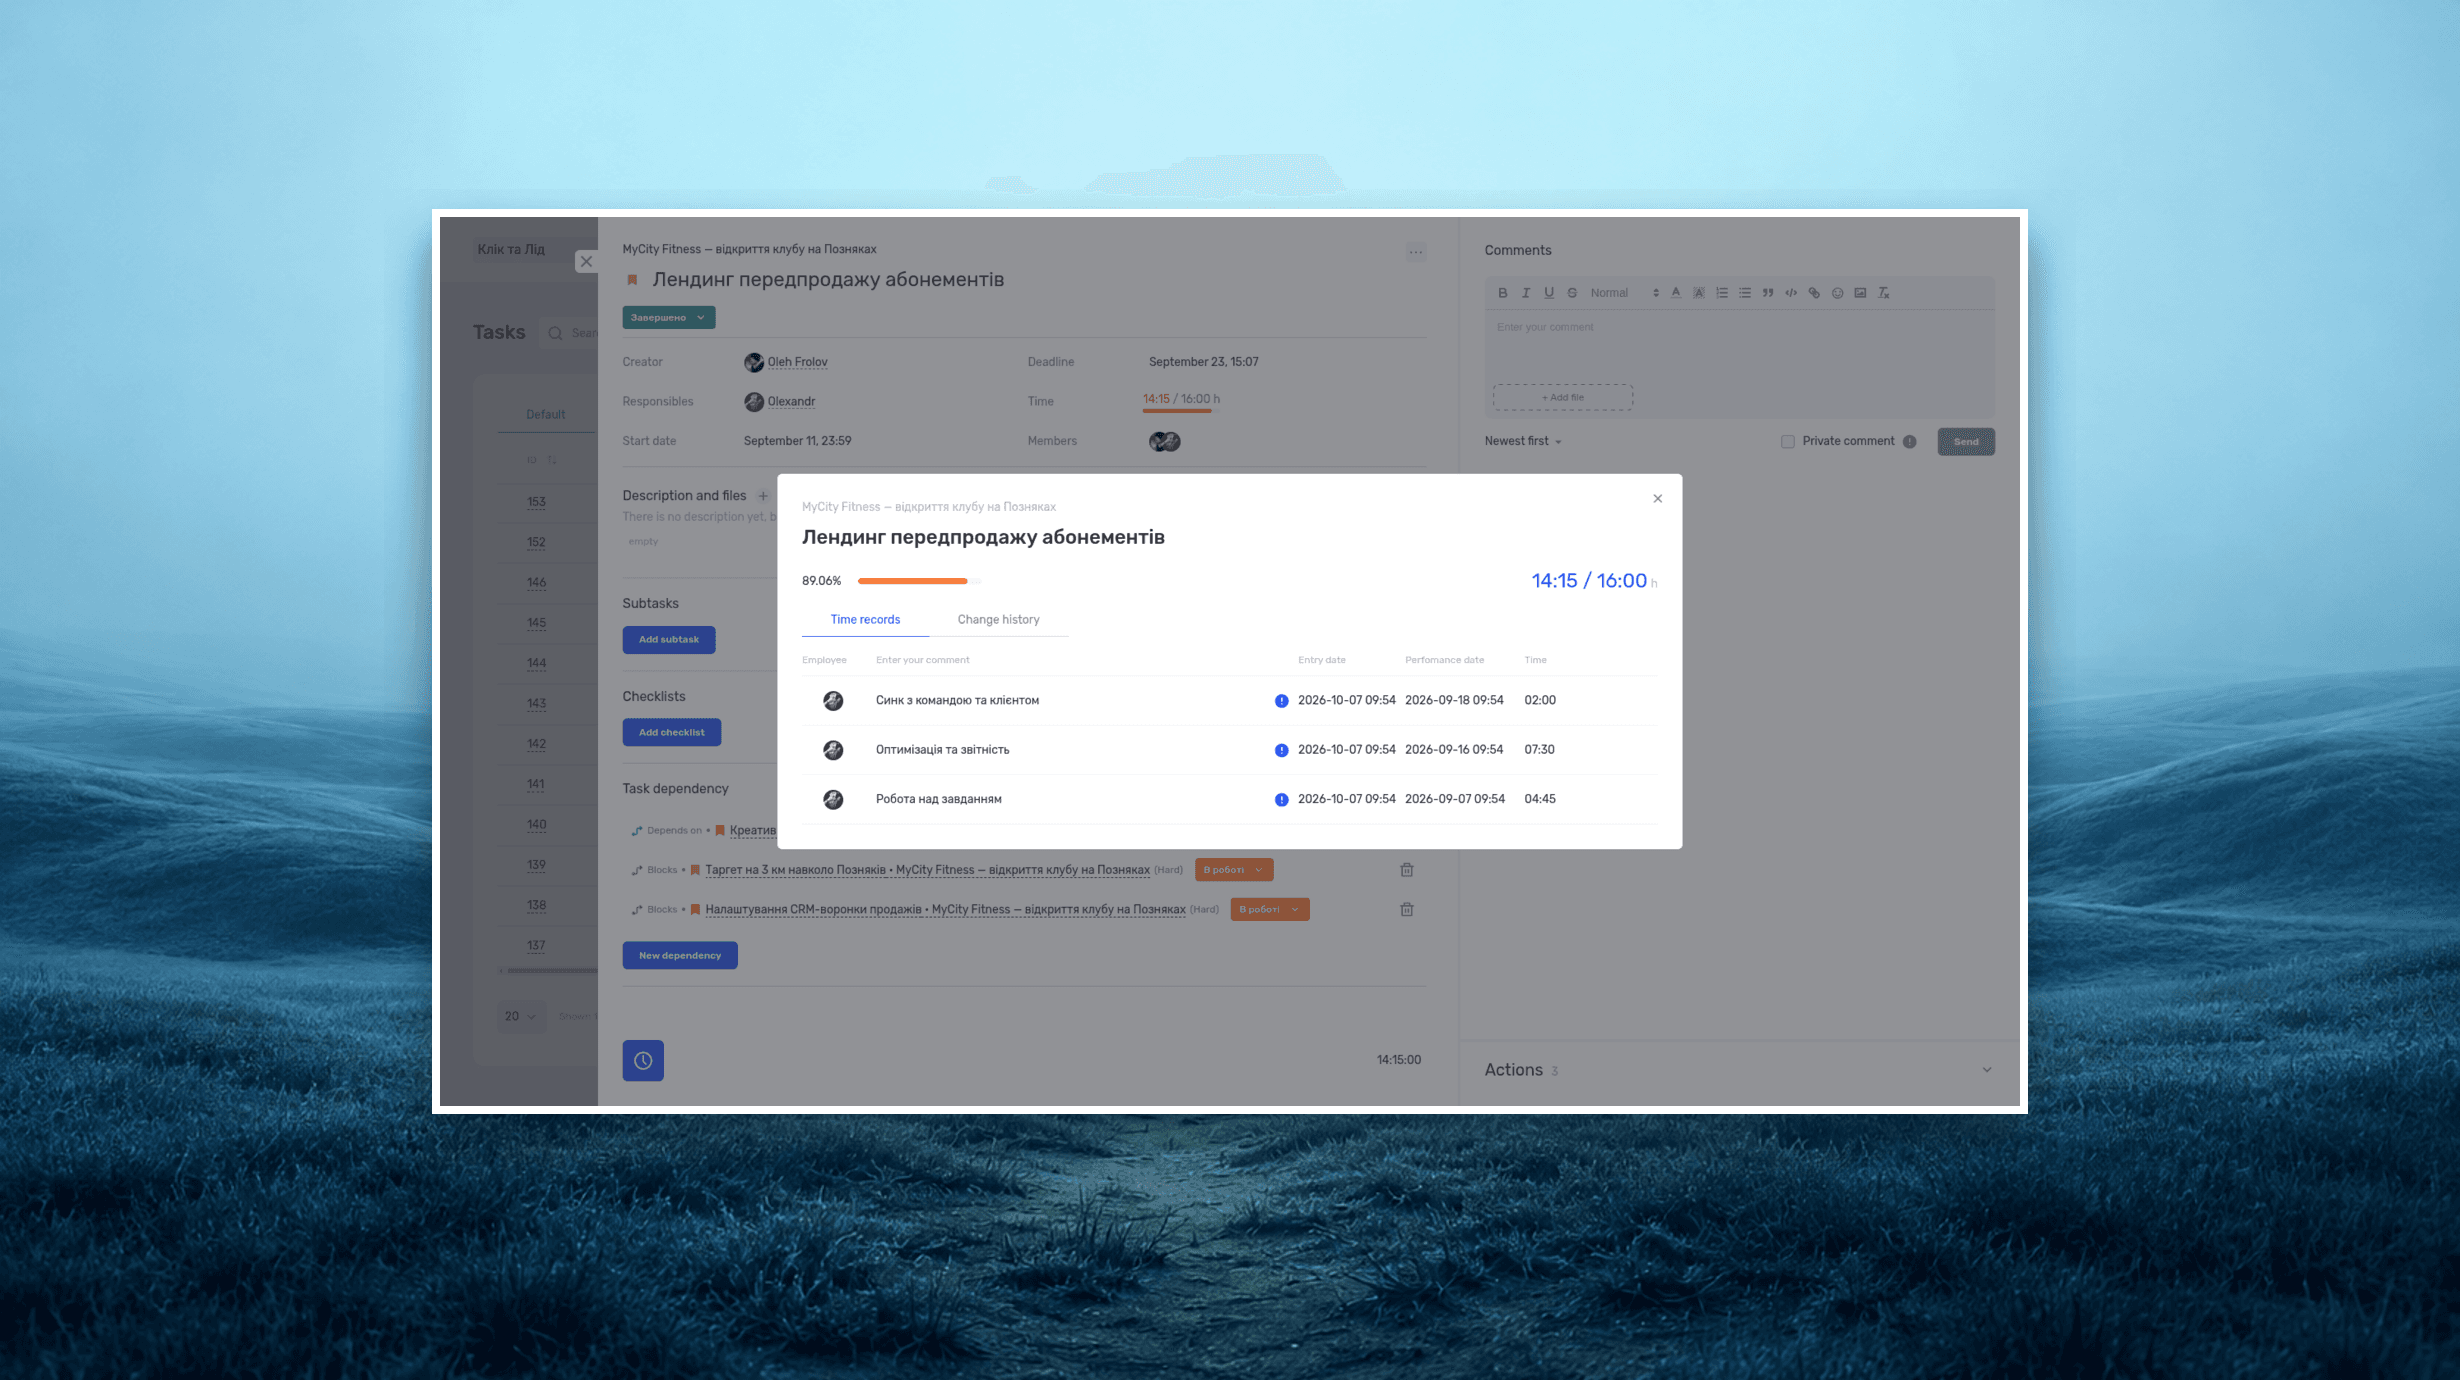
Project time tracking — how to track team hours and costs
A practical guide to recording project hours, understanding overruns, and calculating team costs, with a worked example and a walkthrough in if.team.
See if.team in action for your company
We’ll show how projects, team time and finances connect in one system, using your processes as an example.