
Profit and Loss Statement (P&L): What It Is, How to Prepare and Analyze It
We explain what a profit and loss statement is, how it differs from Cash Flow, and why profit is not the same as the cash left in your account. We break down the P&L structure from revenue to net profit, walk through a calculation for a service company and show how to build your first report.
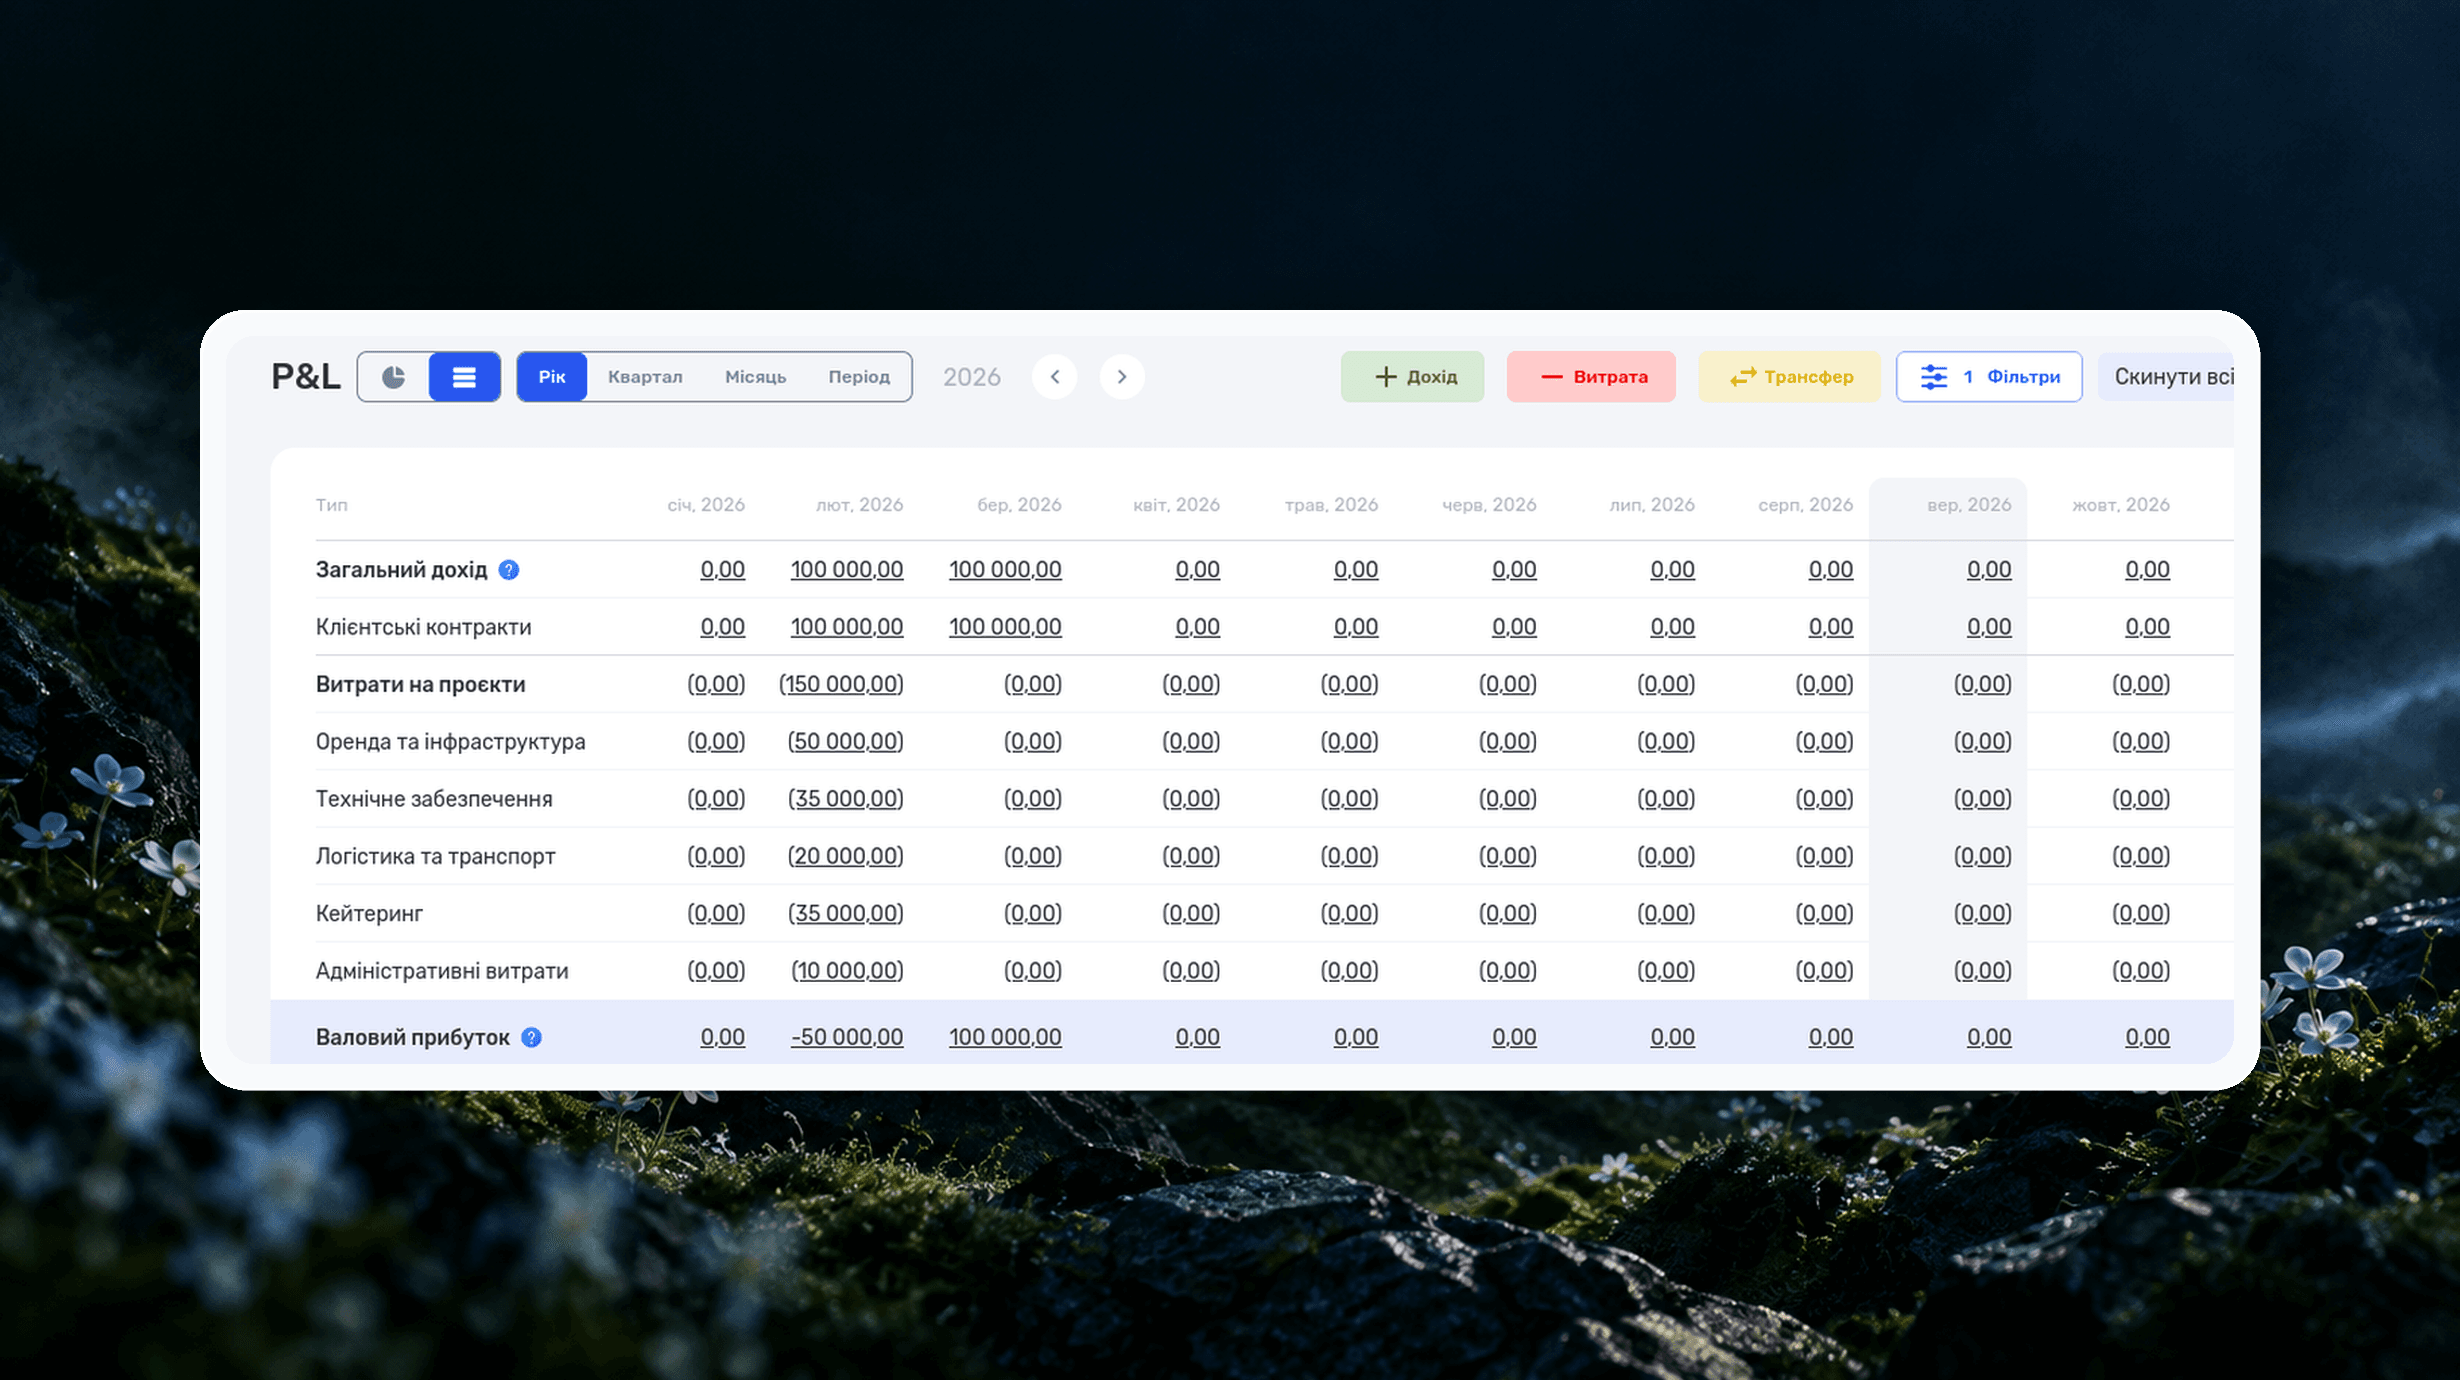
A profit and loss statement shows how much a company earned over a month, quarter, or year and which expenses affected the result. It is also called a P&L, short for Profit and Loss. You may also see it written as a PNL report. The statement helps an owner check whether the team’s work pays off, how much it costs to run the company, and what remains after all expenses.
A report like this often becomes necessary when the workload grows but earnings barely change. A studio takes on new projects, clients pay their invoices, and the manager brings in contractors. The company appears to be growing. But revisions consume part of the budget, urgent tasks require more expensive specialists, and spending on software and advertising increases. At the end of the month, the company discovers that its profit is lower than before.
We will examine this situation using a studio as an example: see how a P&L is structured, calculate the result for two months, and identify the reasons for the changes. Then we will show how to enter this income and these expenses in if.team and check the completed report.
Contents
What a P&L Is and What It Shows
A P&L brings income and expenses together for one period and calculates the difference. A positive result means a profit; a negative result means a loss. Dividing expenses into groups helps explain how this result was formed.
Here we are looking at a management report for the owner and managers of a service business. Its level of detail can be adapted to the company’s work: services, team costs, contractors, or business areas can be shown separately. Statutory financial statements have their own requirements for content and presentation.
How to See Where the Company’s Revenue Goes
A single profit figure is not enough to understand what is happening in a business. Two companies may both earn UAH 80,000 but arrive at that result in different ways. One may generate strong revenue from orders while paying a high price to maintain an office. Another may have low overhead, but almost the entire project budget goes toward delivery.
This is why a P&L divides expenses into groups. First, the cost of services is deducted from revenue to see what remains after completing client work. Then the report accounts for company-wide expenses, other income, other expenses, and taxes. This shows exactly which amounts reduced the final profit.
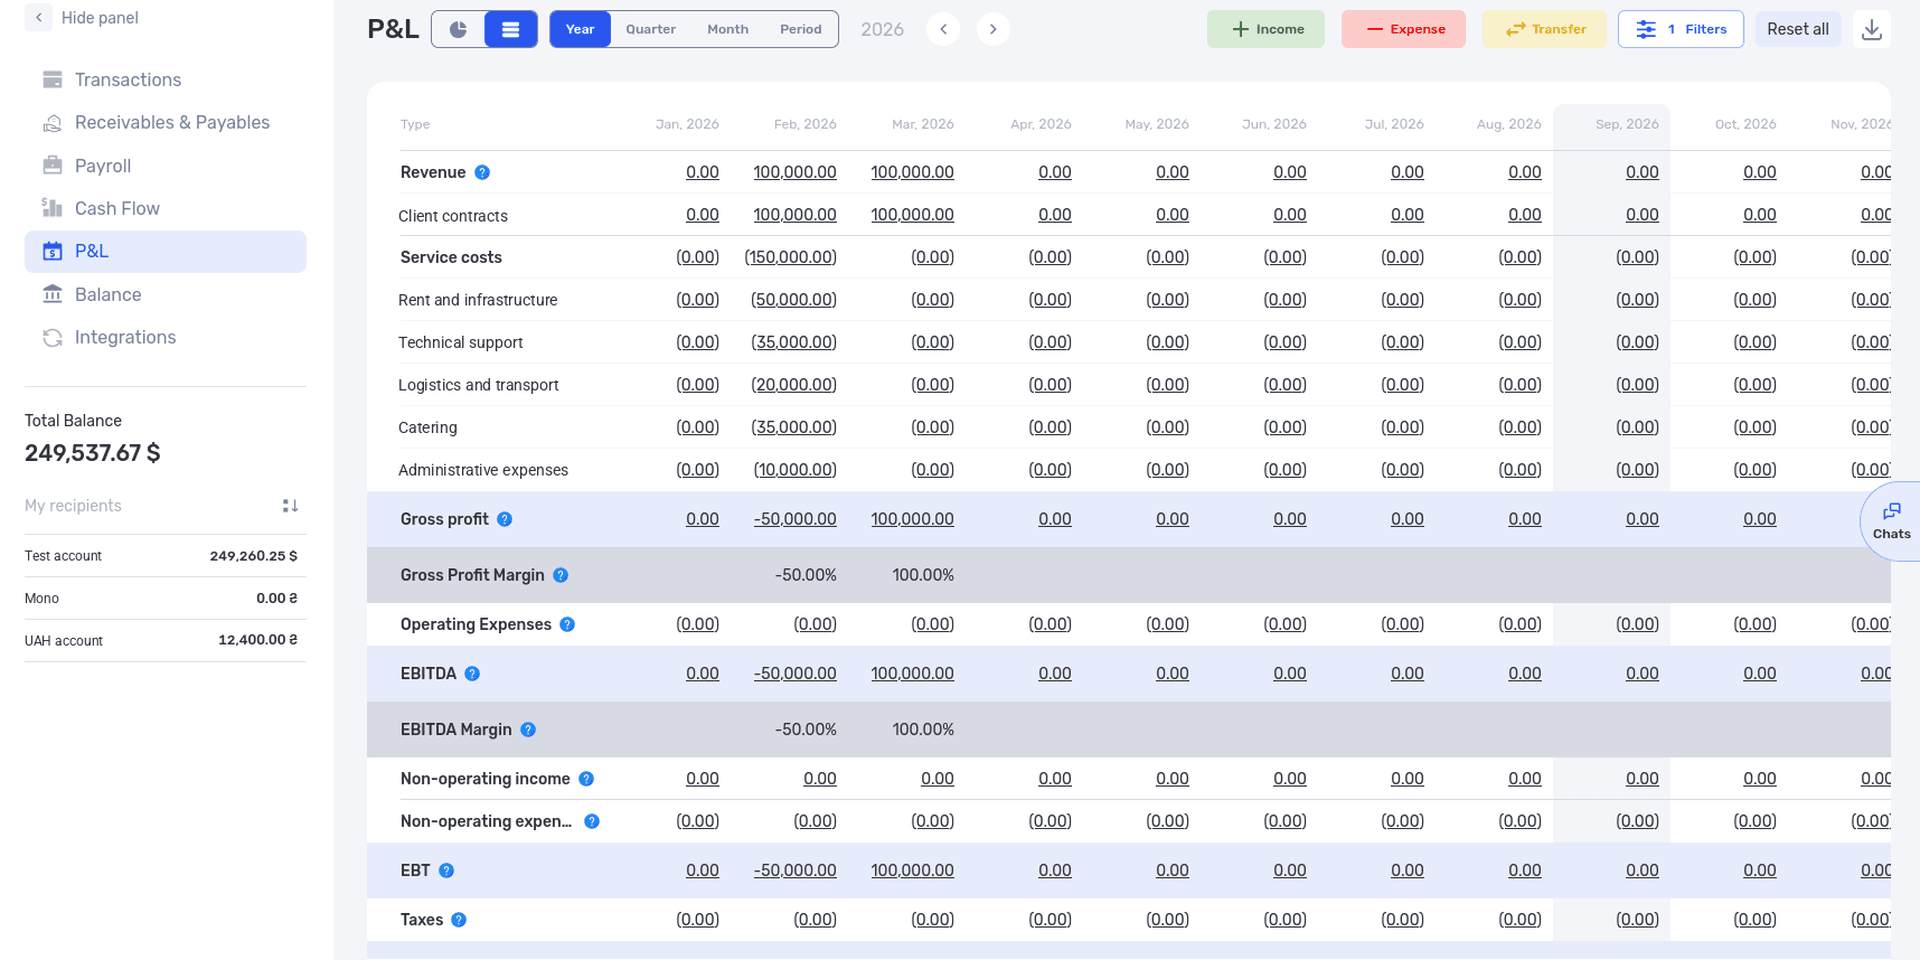
The P&L shows how revenue and different groups of expenses form the company’s profit.
When figures for several months appear side by side, changes that disappear within total turnover become visible. For example, the studio may receive more orders but need to buy more contractor hours for each one. Revenue grows, while the share left after completing the work gradually falls.
What Questions a Profit and Loss Statement Answers
A P&L lets an owner check whether project earnings are enough to cover the administrative team’s salaries, rent, and other monthly expenses. If the company plans to hire, the report helps assess its current result. If profit is falling, it shows which expense groups changed the most.
The next step is to look at the details. Suppose the report shows that contractor costs increased by one third. The reason could be new orders, more complex work, or revisions that were not included in the price. To find out, the manager opens project expenses and checks the tasks and agreements with clients.
The months do not necessarily have to look the same. The studio may hire someone before a large order begins or pay to launch a new business area. Changes like these should be explained next to the figures, so no one has to reconstruct the reason for the higher expenses a month later.
Why Profit Is Not the Same as the Bank Balance
A bank statement makes it easy to check how much money came in and went out. It is harder to understand which work those payments relate to. A client may have paid for the previous month or made an advance payment for the next one. The owner may have put in personal funds so the company could pay salaries on time.
All of these transactions change the bank balance. To calculate profit, you need to understand what is behind each one.
When the Work Is Complete but the Money Has Not Arrived Yet
Consider a fictional studio called Kontur. At the end of September, it completed a website design project worth UAH 180,000. The client accepted the work, and the studio delivered everything agreed upon for the project. Payment arrived on October 10.
The website revenue belongs to September because that is when the studio completed the work. In October, the client settled the outstanding amount. If the revenue were also recorded in the October P&L, the reports would show UAH 360,000 instead of the UAH 180,000 actually earned.
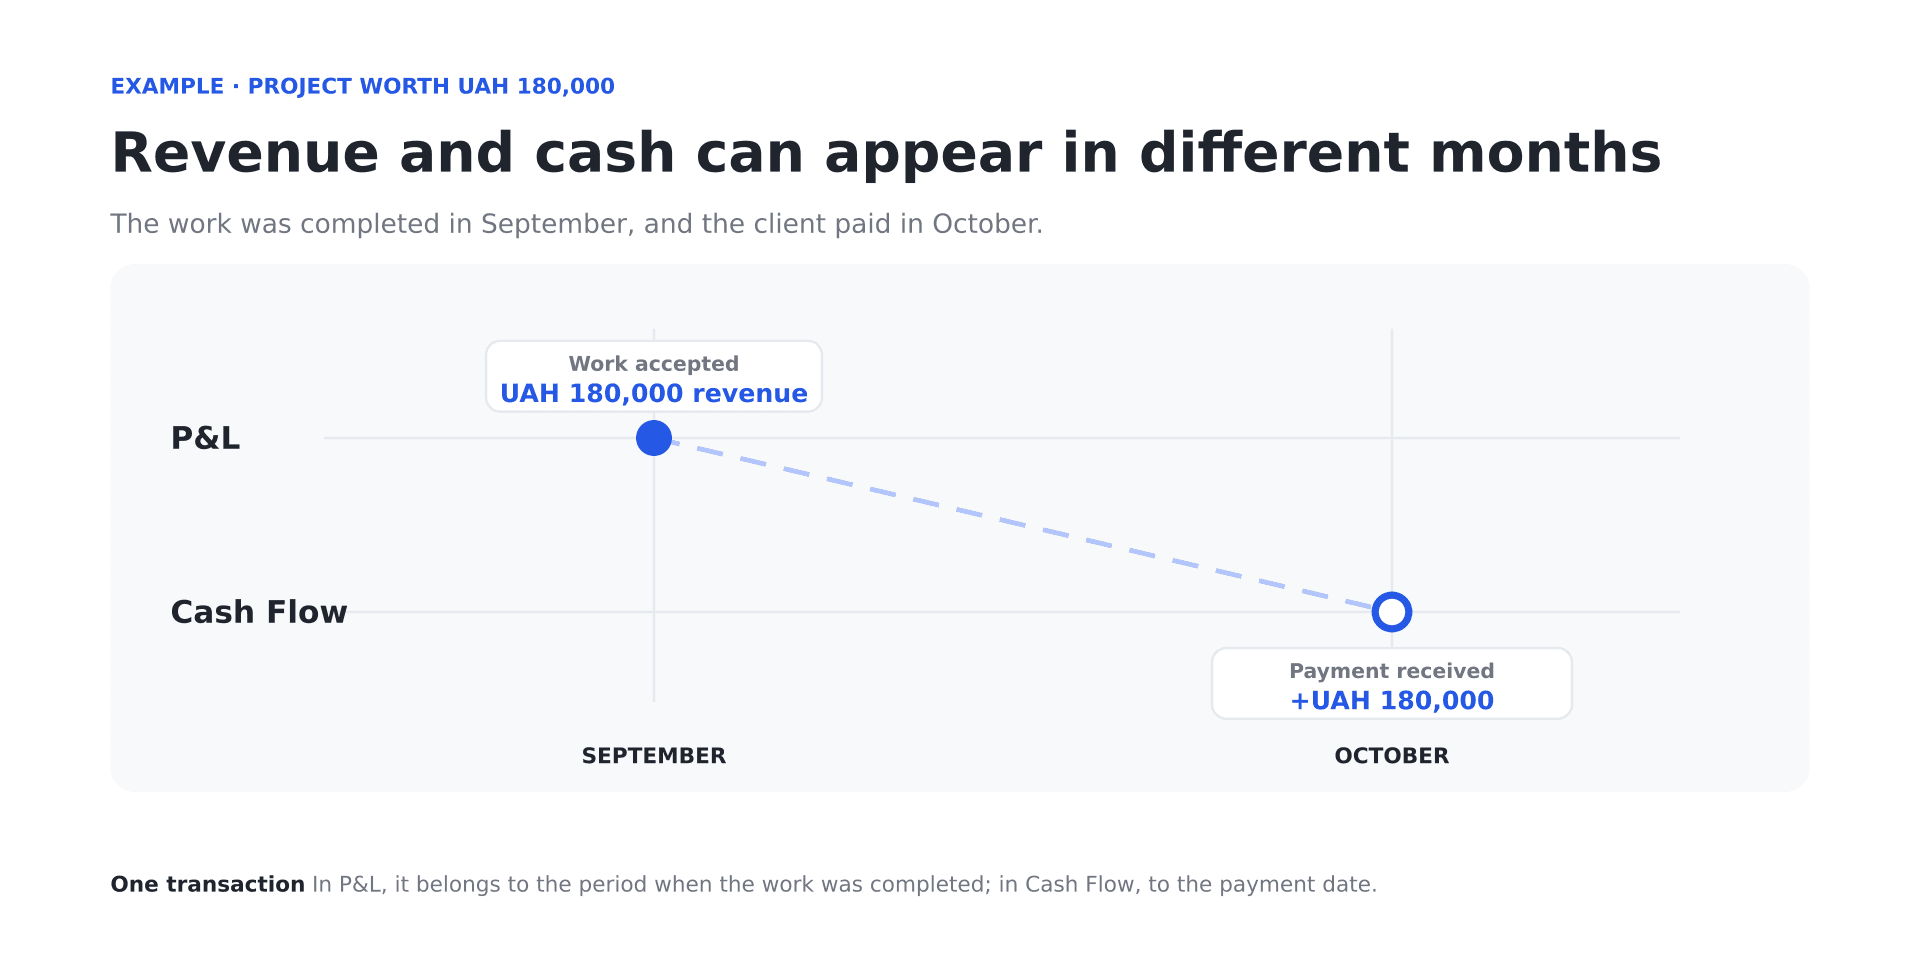
The project revenue belongs to September even though the client paid in October.
The reverse applies to advance payments. A client may pay in August even though the studio will do the work in September. The money is already in the account, but the team still has to deliver the project. Under the assumptions in this example, we recognize the revenue in September, when the client receives and accepts the finished work.
For long-term projects, revenue is sometimes recognized in stages as the work is completed. This depends on the contract, the nature of the services, and the company’s accounting policies. That is why the final delivery date of an entire project should not automatically be used for every engagement.
Which Month an Expense Belongs To
Now suppose a contractor worked on the September website project. The contractor completed their part in September, but the studio paid them in October. This expense also belongs to the September result. If it remains in October, September will show the website revenue without part of the cost of earning it.
The month or other time period to which revenue or an expense belongs is called the recognition period. For payroll, this may be the month in which an employee worked; for rent, the month in which the premises were used. The payment date is recorded separately because it is needed to monitor settlements.
When choosing the period, rely on documents and on what actually happened—for example, accepted contractor work or a payroll calculation. This brings together the revenue and expenses related to a given month, even if the cash moved on different dates.
How P&L Differs from Cash Flow
Cash Flow, or the cash flow statement, is used to monitor cash. It will show the October website payment in October. The P&L will show the revenue from the same work in September. The difference between profit and cash movement is also explained in the SEC guide to reading financial statements.
Both reports are needed when an owner decides whether the company can afford a new expense. The P&L may show a healthy profit, but if clients have not paid yet, there may not be enough cash for the next payroll. In that case, the timing of receipts and payments needs to be checked.
The concert agency BigShow uses this approach as well: the team tracks the economics of individual concerts and uses Cash Flow and P&L to analyze the company’s finances. Our BigShow case study shows how this is organized in if.team.
P&L Structure: How Revenue Becomes Net Profit
The content of a profit and loss statement depends on how a company earns money. At a design studio, people’s work may account for a significant share of the cost of services. At an event agency, this may also include equipment rental, materials, and event services. That is why the detailed line items vary.
They are easier to understand if you first look at the full calculation. Different groups of expenses are deducted from revenue in sequence, producing an intermediate result after each one. Below, we will walk through this process using our studio’s figures.
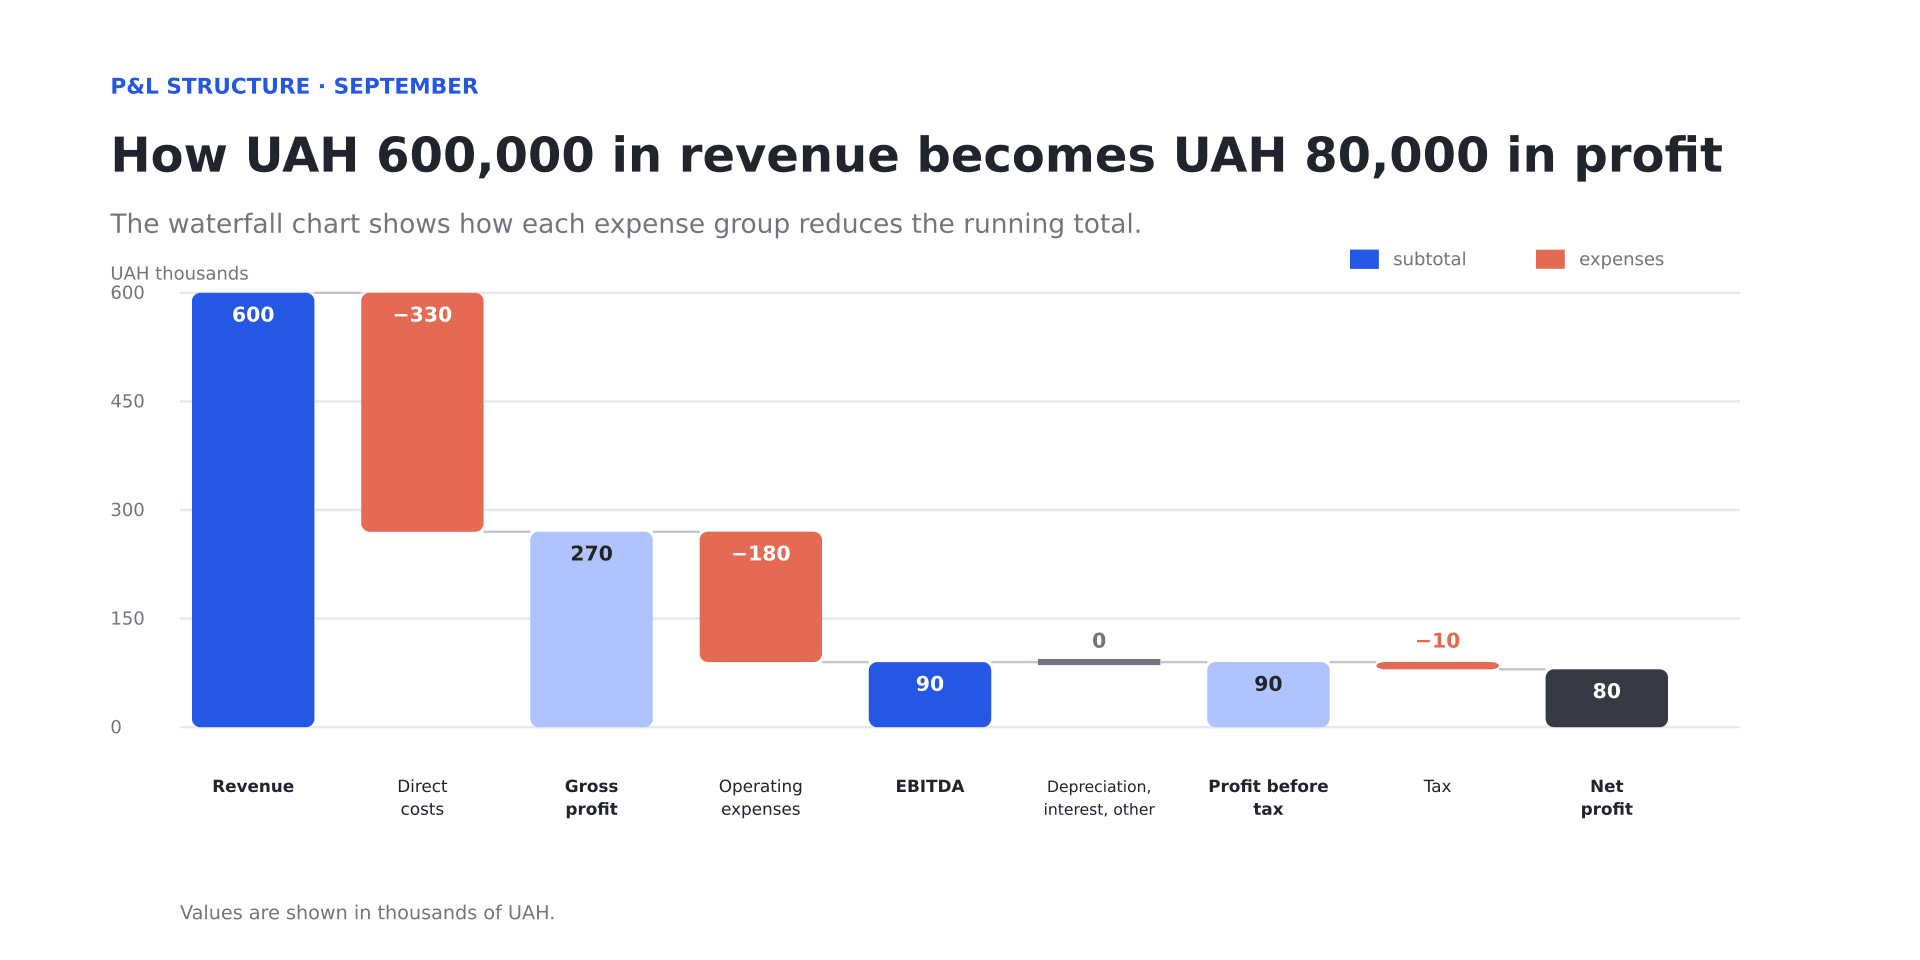
Each intermediate metric helps show which expenses affected the result.
Each intermediate metric answers a different question. Gross profit shows the result after delivering client work, while net profit shows the result after all expenses and taxes. Let us look at them one by one.
Revenue from Core Operations
The studio earns money from website design, brand identity work, and ongoing client support. The monthly P&L includes revenue from services that, under the company’s accounting policies, belong to that month. For example, it includes UAH 180,000 for a website accepted in September. A contract for a new website that the team has not started yet remains a future engagement for now.
Services can be shown on separate lines. This lets the owner see what drove growth: ongoing client support, a larger number of small engagements, or one major project. It also helps with planning the coming months. A one-off project does not guarantee that the company will earn the same revenue again.
Direct Project Delivery Costs
To earn revenue from an engagement, the studio uses the team’s time, hires contractors, and sometimes buys materials or individual licenses. Expenses that can be linked to delivering a specific piece of work are included in its cost of services. In our model, this is the work of the project team and contractors.
It is important to understand why a service was purchased. If a designer creates layouts for a client’s website, their work is a project cost. If the same designer creates advertising banners for the studio itself, that is a marketing expense. The supplier and the name of the service may be the same, but the purpose of the work is different.
Gross Profit and Gross Margin
After deducting the cost of services from revenue, we get gross profit. The company still has to cover administrative work, office costs, advertising, and other expenses from this amount.
Gross profit = revenue − cost of services.
In September, the studio earned UAH 600,000 in revenue and spent UAH 330,000 on project delivery. This left UAH 270,000 in gross profit. To understand what share of revenue remained after the direct costs of client work, we calculate the gross margin:
Gross margin = gross profit ÷ revenue × 100%.
270,000 ÷ 600,000 × 100% = 45%. In other words, after direct costs, the studio keeps 45 kopecks from every hryvnia of revenue. If revenue grows the following month but the margin falls to 35%, it is worth checking the cost of services: a larger share of the money earned is being spent on delivering the work.
Operating Expenses and EBITDA
After client work has been delivered, the company still has expenses related to day-to-day operations. It needs to pay the administrative team, rent an office, use shared services, and find new clients. In our report, these amounts are grouped under operating expenses, separately from project delivery costs.
In September, they amounted to UAH 180,000. We deduct them from UAH 270,000 in gross profit, leaving UAH 90,000. In the studio’s simplified example, this is EBITDA: the result before interest, income tax, depreciation, and amortization.
Depreciation and amortization are used when the cost of an asset is allocated over its useful life. For example, a company may buy equipment that it will use for several years. Under this accounting treatment, the expense appears gradually over those years. EBITDA excludes it, while operating profit includes it. That is why the two metrics differ at companies that record depreciation or amortization.
EBITDA is useful for comparing operating performance, but cash in the bank needs to be checked separately. Even with positive EBITDA, a company may still be waiting for a client payment or facing a large loan repayment.
Other Income, Expenses, and Taxes
In addition to services, a company may have other sources of income and expenses: interest on a deposit, interest on a loan, or foreign-exchange differences. Showing them separately makes it easier to assess how much the work with clients itself generated.
For example, the studio may have sold old equipment. The money came in, but the sale says nothing about the success of client projects. In addition, the profit from the transaction depends on the equipment’s carrying amount. Simply adding the entire payment received to profit would produce an inaccurate result.
After accounting for depreciation, amortization, finance items, and other items, we get earnings before tax, or EBT. In our example, all these additional items are zero, so EBT remains UAH 90,000. We then deduct income tax.
Other taxes may be included in the cost of services or in operating expenses. Their place in the report depends on what the company pays them for. That is why all tax payments should not automatically be grouped into a single line at the end of the P&L.
Net Profit and Net Margin
After accounting for all income, expenses, and taxes, we get net profit. For September, assume UAH 10,000 in taxes: after deducting them from UAH 90,000, UAH 80,000 remains. In our example, this is the studio’s final result for the month.
It can also be expressed as a share of revenue:
Net margin = net profit ÷ revenue × 100%.
80,000 ÷ 600,000 × 100% ≈ 13.3%. This means the company earned approximately 13 kopecks in net profit from every hryvnia of revenue.
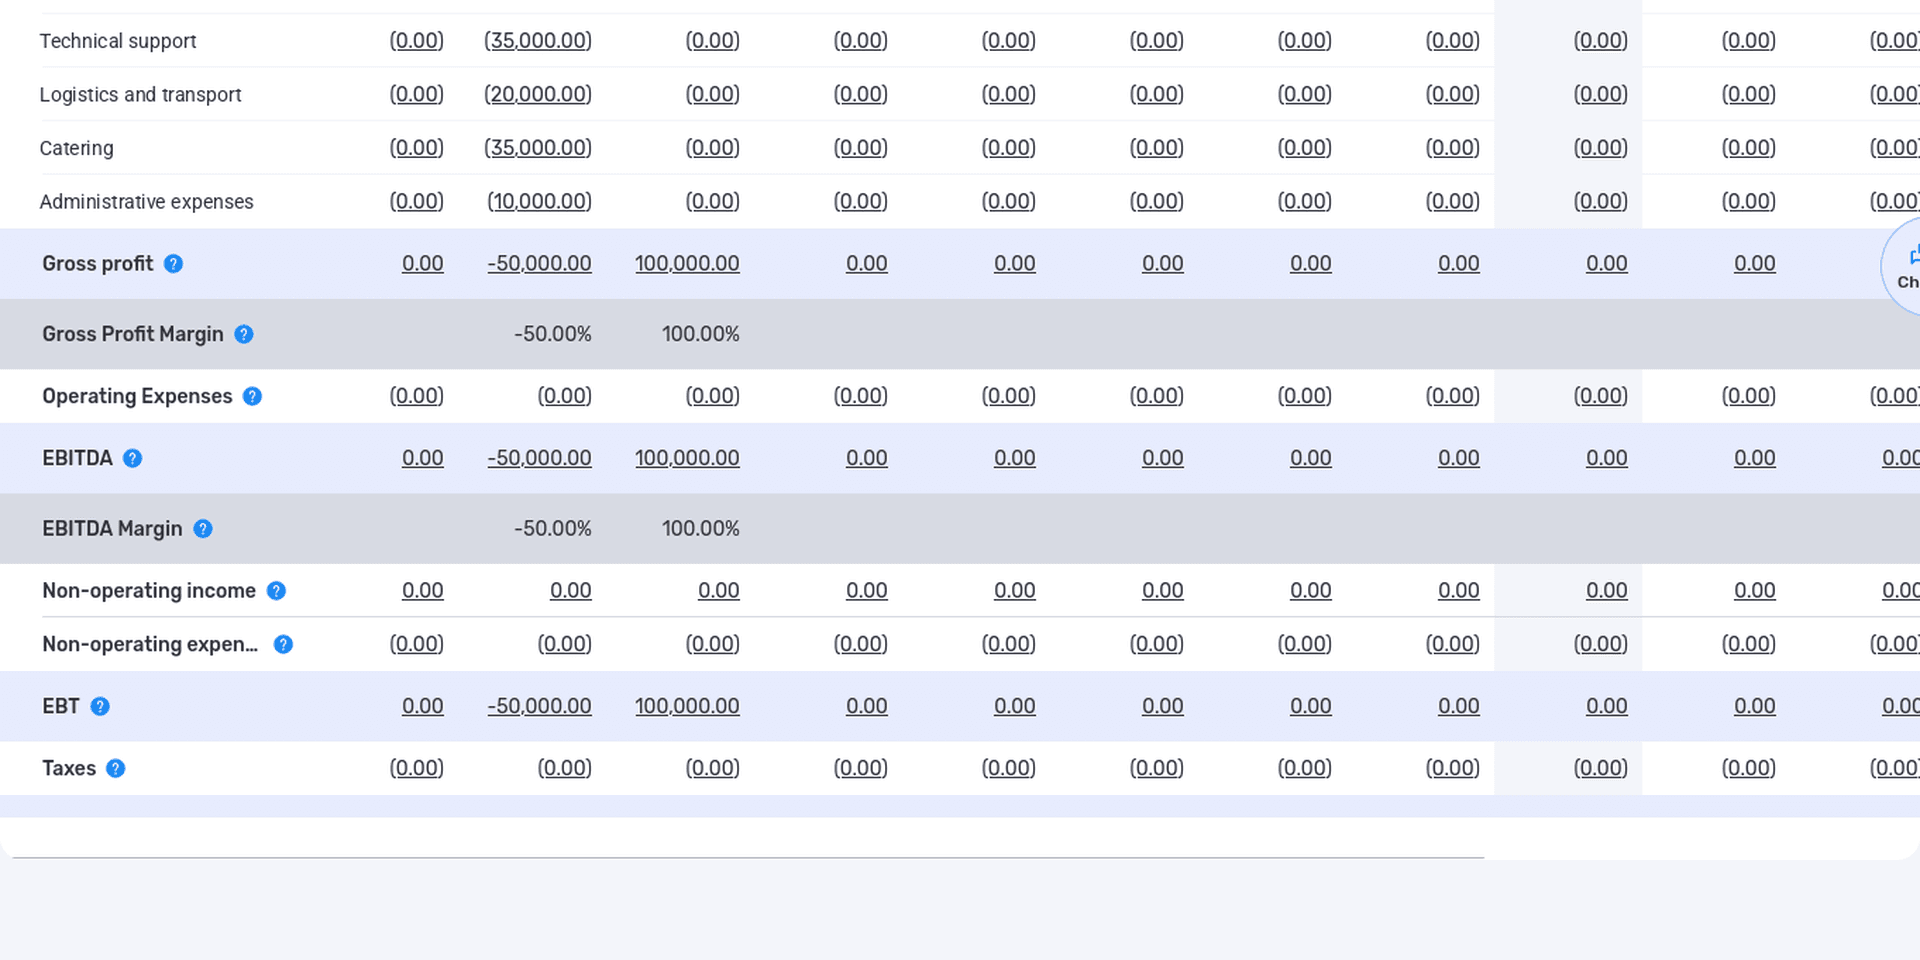
Amounts show the size of the profit; percentages show its share of company revenue.
To assess this 13.3%, you need a comparison. What was the result before? What margin was included in the plan? Is the amount earned enough to meet the company’s goals? A percentage on its own says very little without this context.
Look at the amount of profit as well. A high margin on a small volume of work may generate less money than a moderate margin on a steady flow of projects. The owner needs both metrics to assess earnings and the resources used to produce them.
Dividends and Capital Contributions
After calculating profit, the owner may decide to pay part of it out to themselves. This is a distribution of profit already earned. Paying dividends does not increase the cost of the website and does not change how much the studio earned from its services.
Funds contributed by the owner are also recorded separately. A contribution may help cover current payments, but it does not become client revenue. If these transactions are mixed together, a loss-making month may appear profitable solely because the owner added money to the account.
In the if.team table, dividends and additional capital contributions have separate lines below net profit. They are included in an additional metric called “Financial Result.” When analyzing the report, pay attention to the line name: this metric is different from net profit, while actual cash balances need to be checked in the accounts. For more details on the table structure, see the P&L documentation.
Profit and Loss Statement: A Service Company Example
Now let us bring the Kontur studio’s figures together in one report and compare two months. The company, project names, and all amounts are fictional and used for explanation. They are not financial data from if.team clients.
What the Studio Earned in September
The studio’s revenue was UAH 500,000 in August and UAH 600,000 in September. The September amount consists of three projects: “Website” — UAH 180,000, “Brand Identity” — UAH 240,000, and “Support” — UAH 180,000. All these services were delivered in September and, under the assumptions in this example, belong to that month’s revenue.
The client paid for the website in October, as discussed above. This does not affect the September P&L. All amounts are shown excluding VAT; in this example, the studio has no depreciation, amortization, interest, or other additional income or expenses. Taxes remain a fixed illustrative amount so that we can focus on calculating profit.
Project delivery costs amounted to UAH 330,000 in September: the project team’s work cost UAH 210,000, and contractor services cost another UAH 120,000. We will enter some of these transactions into if.team below. They are already included in the totals, so they should not be added to the report a second time.
How to Calculate Profit for Two Months
In the table, regular rows show revenue and individual expenses, while highlighted rows show totals and profitability metrics. For example, the project team’s work and contractor services together make up direct costs. The total row is not another expense.
Let us walk through the September calculation. From UAH 600,000 in revenue, we deduct UAH 330,000 in direct costs, leaving UAH 270,000 in gross profit. We then deduct UAH 180,000 for running the company as a whole, leaving EBITDA of UAH 90,000. There are no additional adjustments in the example, so profit before tax is the same. After the specified UAH 10,000 in taxes, net profit is UAH 80,000.
Why Revenue Grew but Profit Fell
The studio’s revenue increased by 20%, while direct costs increased by 32%. Of the additional UAH 100,000 in revenue, only UAH 20,000 remained after the work of the team and contractors. At the same time, spending on running the company and on marketing increased by UAH 30,000. As a result, net profit fell by UAH 10,000.
The manager should start by examining project costs. Did the specialists’ rates change? Did the work take more hours than planned? Was all additional work included in the client’s invoice? The answers will help explain what happened to the gross margin.
The next step is to look at operating expenses. The table shows that marketing increased from UAH 30,000 to UAH 50,000. It is too early to cut it solely because of this difference: the studio may have launched a campaign in September and expect it to generate new projects in the coming months. The company needs to check what the money was spent on, what inquiries it generated, and whether the result matches the plan.
After this review, the owner has specific tasks—for example, revisiting how additional work is estimated and checking the results of advertising. To repeat this analysis every month, the company now needs to establish a reliable data collection process.
What Data You Need to Prepare a P&L
A profit and loss statement is only as reliable as the data the company collects. If a contractor invoice is omitted, profit will be overstated. If the same invoice is recorded twice, profit will be understated. Before preparing the first report, the team needs to agree on who records transactions, how categories are selected, and when the month is reviewed.
Collect Revenue and Expenses for the Required Month
For every transaction, you need to know the amount, what caused it, and which period it belongs to. If you want to analyze individual engagements, add the project and, if necessary, the stage of work. Keep the payment date and status separately so you can see which amounts have already been settled and who is still waiting for payment.
All expenses for a month rarely appear on the same day. Payroll is calculated after the month ends, a service invoice may arrive later, and a manager may not pass on information about accepted work immediately. Set a deadline by which the team must submit information, and review the report once the data has been collected.
Keep work that has already been completed separate from future work. If a contractor completed a September task, the expense belongs to September even if payment is still pending. If the contractor is only due to begin work in October, it is still a planned expense. Without this distinction, the actual P&L will be mixed with the forecast.
Agree on Where to Record Each Type of Expense
To begin with, it is enough to use the categories the owner actually wants to monitor. For our studio, these are the project team, contractors, the administrative team, rent and services, marketing, and other expenses. If the studio later needs to analyze advertising channels separately, the marketing category can be broken down further.
Write simple rules for recurring transactions. For example, a contractor’s work for a client belongs to project costs, while services used for the studio’s own advertising belong to marketing. This prevents different employees from assigning identical payments to different lines.
Bank import reduces manual work, but the accounting details still need to be checked afterward. The bank knows when money was transferred and to whom. The team knows which project the payment relates to and which month the work belongs to. Our Creatura case study shows this process: a transaction is imported from the bank, after which its project, category, and recognition period can be specified in if.team.
Account for Team Work and Shared Expenses
At a service company, payroll is often one of the largest expenses. If an employee works on several engagements, the cost of their work needs to be allocated to estimate the cost of each one. One approach is to track the hours actually spent.
Consider a separate example of this allocation. An employee’s work costs the company UAH 40,000 per month. Of 160 recorded hours, they spent 80 on the website, 48 on the brand identity project, and 32 on internal tasks. The hourly cost for this calculation is UAH 250. This assigns UAH 20,000 to the website, UAH 12,000 to the brand identity project, and UAH 8,000 to internal work. These amounts illustrate the allocation method and are not added to our summary table.
This level of detail shows how much the client work itself costs. Internal hours also remain in the report: the company pays for them even though it does not invoice a client for them. They may cover training, preparation of the company’s own materials, or work on the studio’s processes.
When time tracking and payroll are maintained together, duplicate entries need to be avoided. The cost of hours may be a way to allocate the UAH 40,000 already accrued among different types of work. If another UAH 40,000 payroll expense is then added, total expenses will double. The company should also agree on where leave, taxes, and other team-related costs are recorded.
Rent and administrative expenses can also be allocated among projects, but this requires a separate rule. For example, the company may use each project’s share of working hours. The chosen method will affect the result of each project, so it is better to keep direct costs and the allocated share of shared expenses available for separate review.
How to Prepare a Profit and Loss Statement in if.team
Once the accounting rules have been agreed on, they need to be reflected in the system records. Two fields in if.team are especially important for P&L: the recognition period determines when the transaction belongs, while the P&L category determines which line of the report it appears in. The project, counterparty, and detailed category will help you investigate the final amount later.
Below, we will enter several transactions for the Kontur studio: revenue from the website project, a contractor expense, and a payment for work on two projects. They are already included in the September totals in the table. To prepare the full report, the remaining revenue and expenses need to be collected in the same way. A general overview of the module is available in the financial management documentation.
The interface screenshots use demo data, so the amounts and project names may differ from those in the instructional example.
Add Revenue and Specify the Recognition Period
Open “Finances” and click “+ Income.” Select the “Website” project, enter UAH 180,000, and specify the account and client. The transaction category describes what the revenue was received for, while the P&L category determines its place in the report. This engagement requires the general revenue category.
We are looking at the record after the client has already paid. The payment date is October 10, and the status is paid. The recognition period remains September because that is when the studio completed and delivered the work. The two different dates in this record reflect what happened with the engagement.
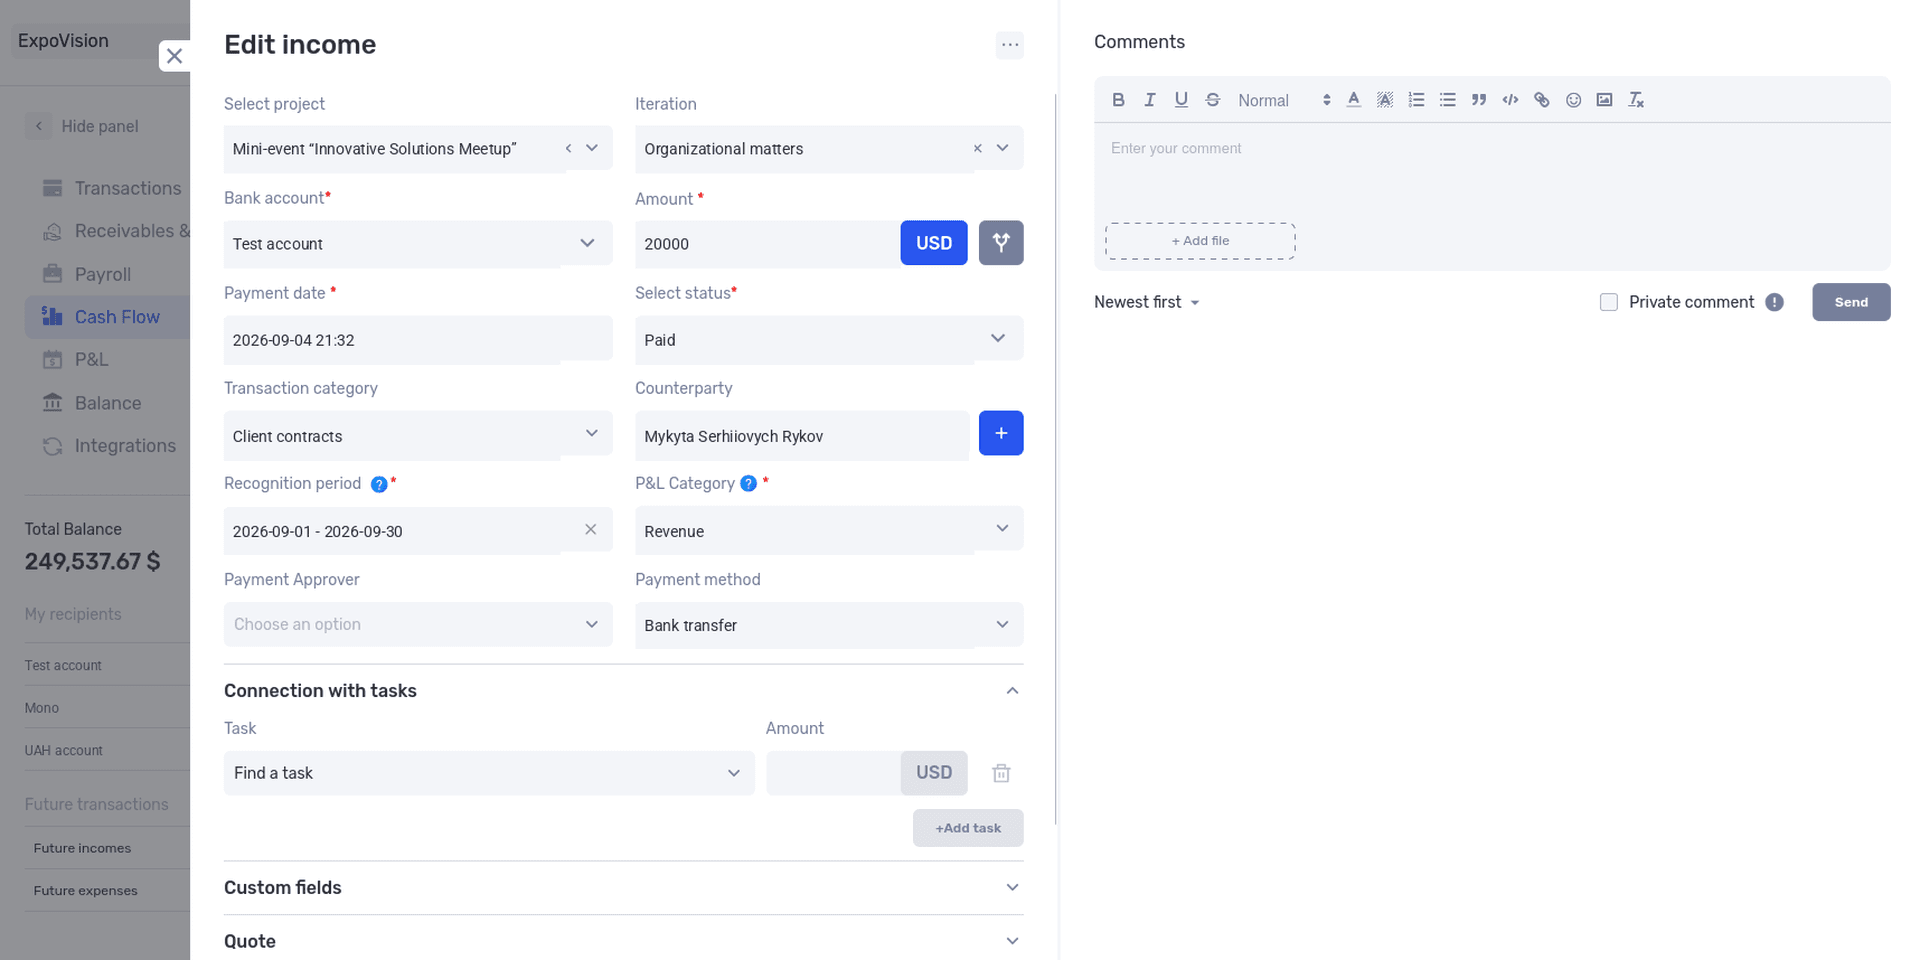
The payment date and recognition period answer different questions: when the money was received and which month the revenue belongs to.
Before the money arrives, keep the record marked as unpaid. Once the client pays, update the status and payment date; the recognition period for this engagement remains September.
If the payment has already been imported from the bank, find the existing transaction and complete its fields. There is no need to create a second record for the same payment.
Add a Contractor Expense
The studio hired a contractor for one of its September engagements at a cost of UAH 25,000. This amount is already included in the UAH 120,000 total for contractor services in the table. Click “− Expense,” then specify the amount, contractor, account, and “Website” project. The recognition period is September, and the P&L category is project expenses.
It is important to distinguish between the detailed expense category and its place in the P&L. The detailed category may be called “Contractor Services.” The P&L category indicates that the amount is included in the cost of completed projects and reduces gross profit.
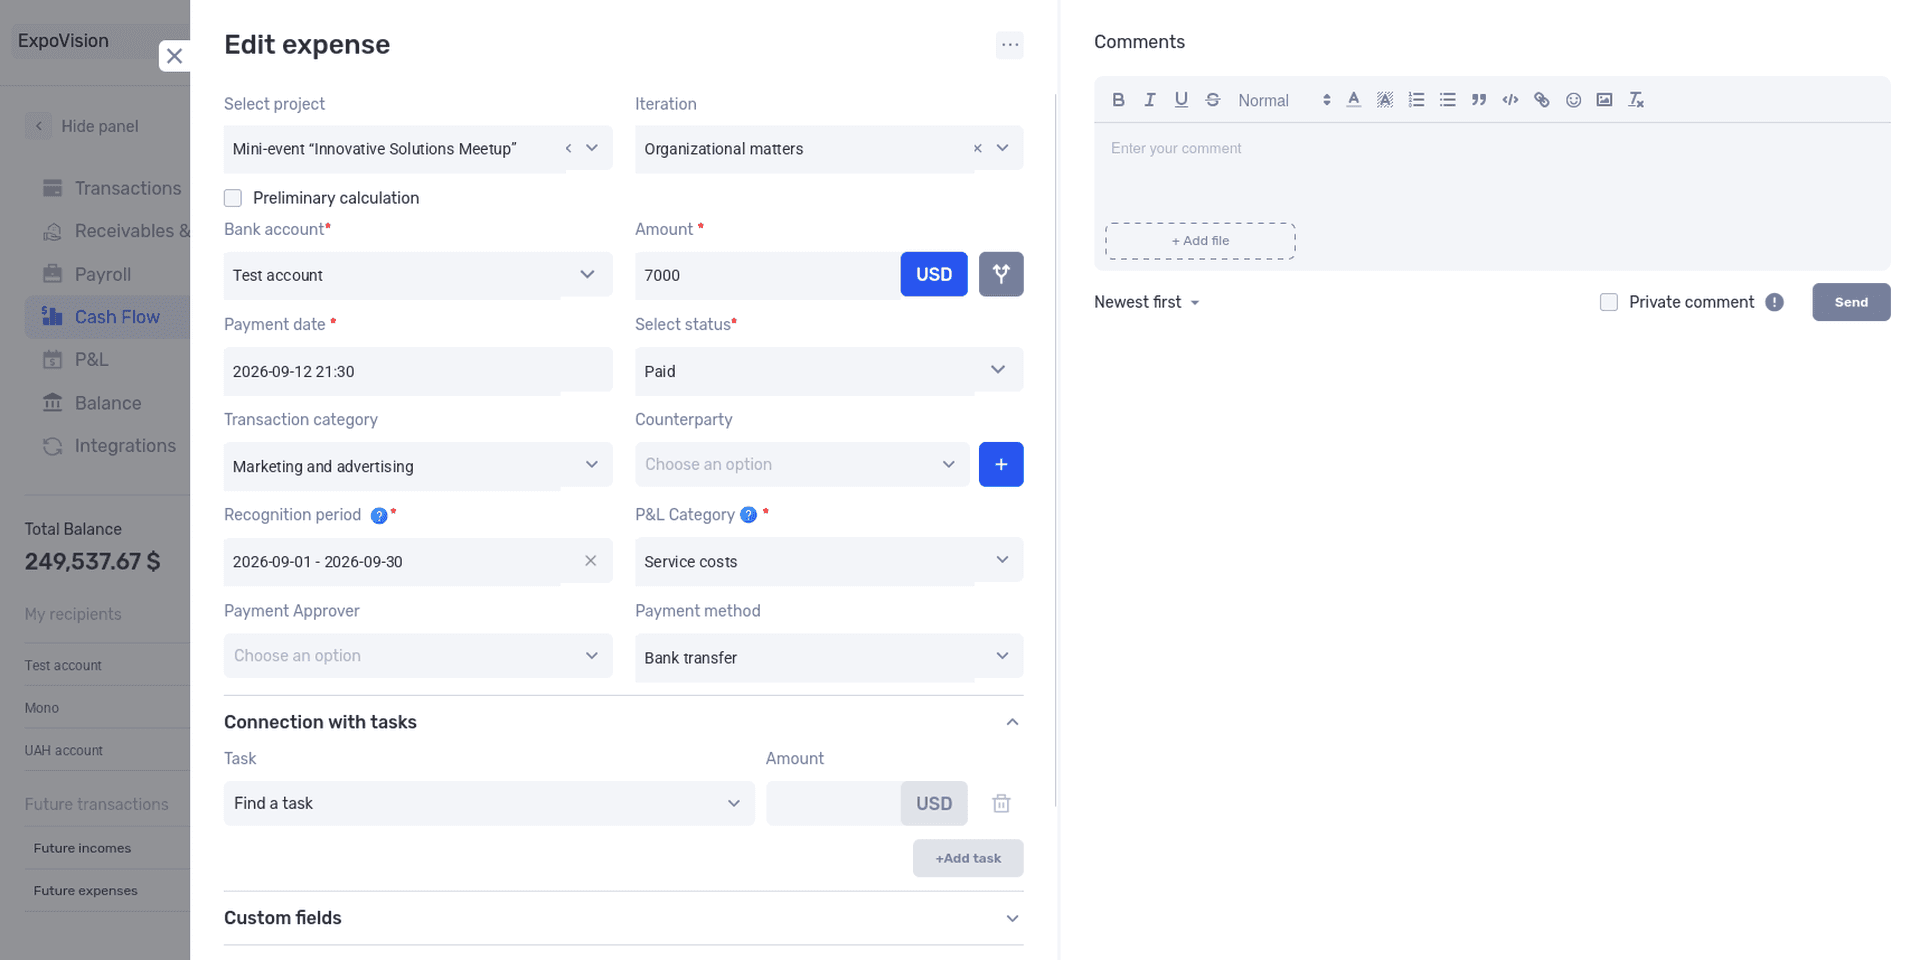
The P&L category determines which group of the report the expense is included in.
For comparison, office rent belongs to operating expenses in our model. It also reduces the studio’s earnings, but it is accounted for after gross profit. If the categories are mixed up, the total expense amount may remain correct while the conclusion about project costs changes.
After saving the transaction, check the month and the line it appears in. It is easier to catch an error immediately than to search for it later among dozens of expenses.
Split One Payment Between Two Projects
The studio paid another contractor UAH 30,000 for two pieces of work: UAH 18,000 for the website and UAH 12,000 for the brand identity project. Both were completed in September. In the overall P&L, this is UAH 30,000 in expenses, but project analysis requires you to know how much belongs to each project.
After entering the amount, open the transaction split. For the first part, select “Website” and enter UAH 18,000; for the second, select “Brand Identity” and enter UAH 12,000. For both parts, specify the September recognition period and the project expenses category.
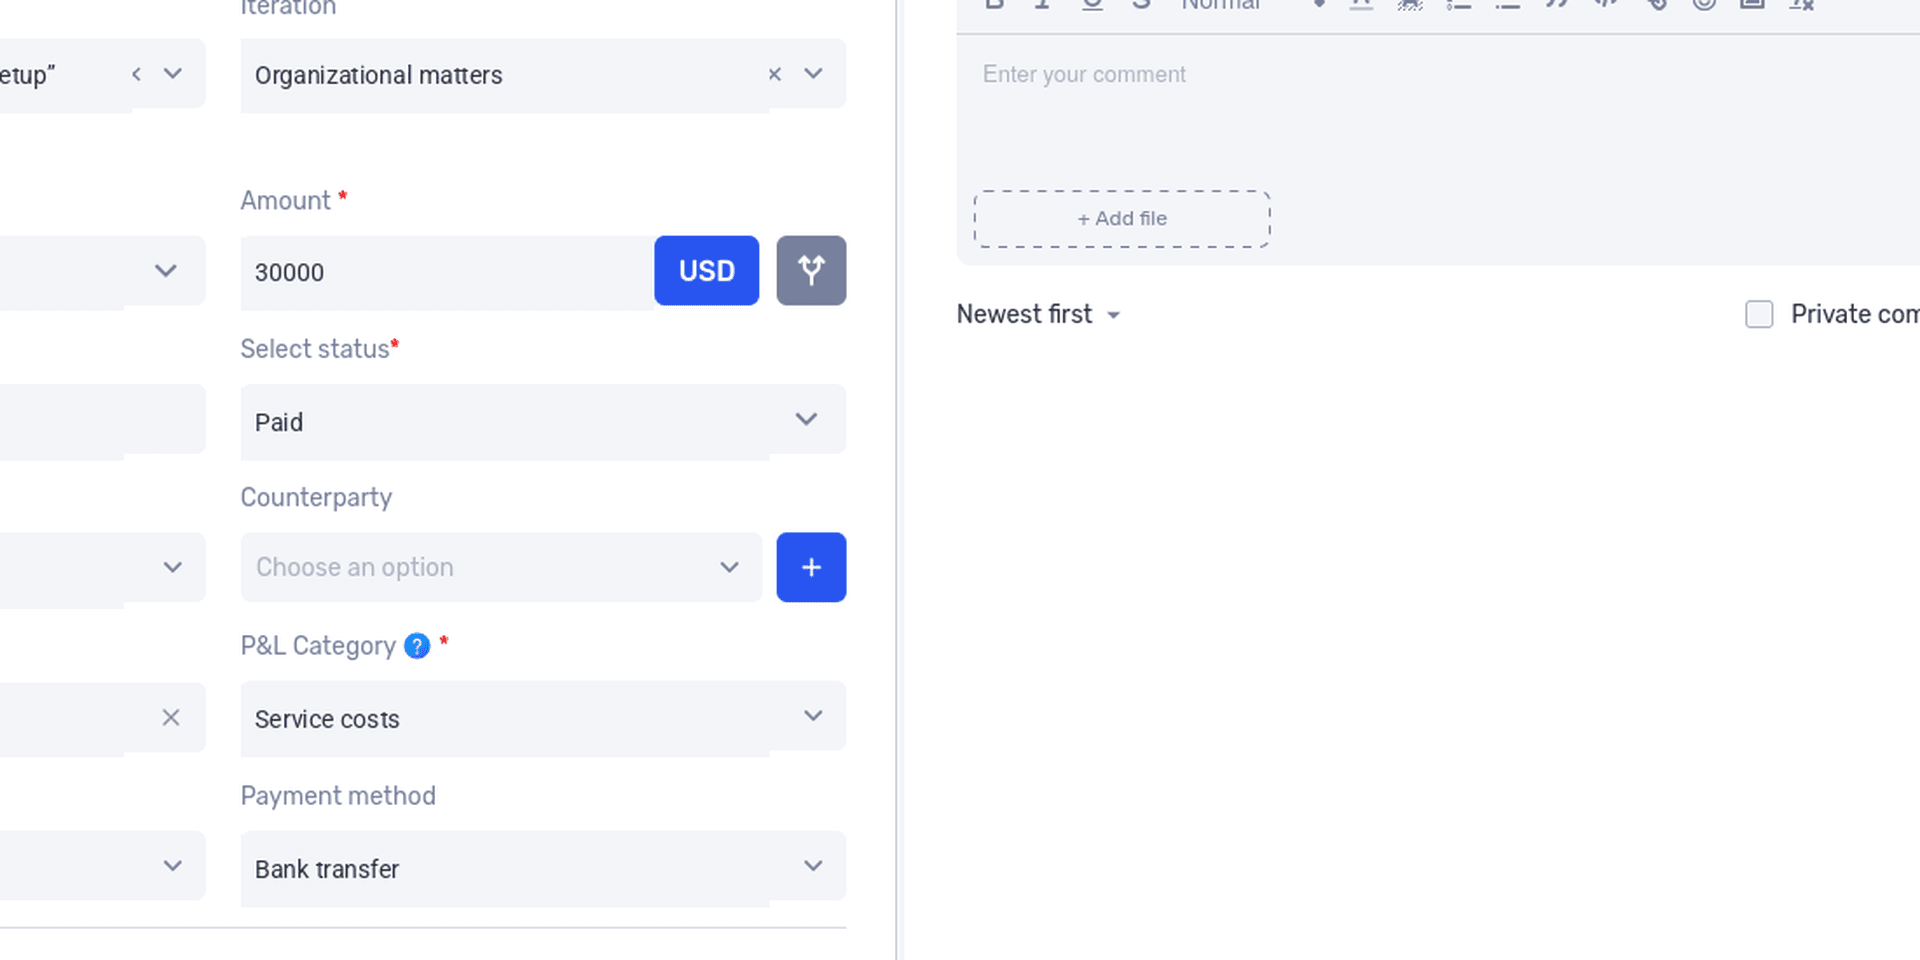
The button next to the currency opens the option to split a payment between projects or by other parameters.
Check the total of the parts: 18,000 + 12,000 = UAH 30,000. The allocation is now complete, so there is no need to add separate expenses for the same work.
Splitting is also useful when one payment covers services for different months. Each part can have its own recognition period. Choose it based on when the service was received: the allocation should correspond to the work that was paid for. Every field in the form is described in the guide to adding income and expenses.
Open the Report for the Required Period
In “Finances,” select P&L in the left-hand panel and switch to the table view. For our comparison, set the period from August through September. Check the active filters: if you previously viewed a particular project or account, some records may be hidden.
Once all the example data has been entered, the September totals should match the instructional table: UAH 600,000 in revenue, UAH 330,000 in direct costs, and UAH 180,000 in operating expenses. If there is a difference, check whether all transactions have been added and whether the correct categories and recognition periods were selected.
Pay attention to VAT as well. All amounts in our example are shown excluding VAT. If VAT accounting is enabled in if.team, the P&L uses amounts excluding VAT, while Cash Flow shows the actual payments including VAT. As a result, the amounts in the two reports may differ even when the payment date and recognition date are the same.
How to Analyze P&L in if.team and Check the Figures
The system now contains a report that can be analyzed in the same way as our table. Start with revenue and move gradually through expenses to profit. If you look only at the final amount, it is easy to miss where the change occurred.
Compare Amounts and Margins by Month
Find the changes we have already calculated in the table: revenue increased from UAH 500,000 to UAH 600,000, gross margin decreased from 50% to 45%, and net profit fell from UAH 90,000 to UAH 80,000. You can now move from these totals to the transactions that affected them.
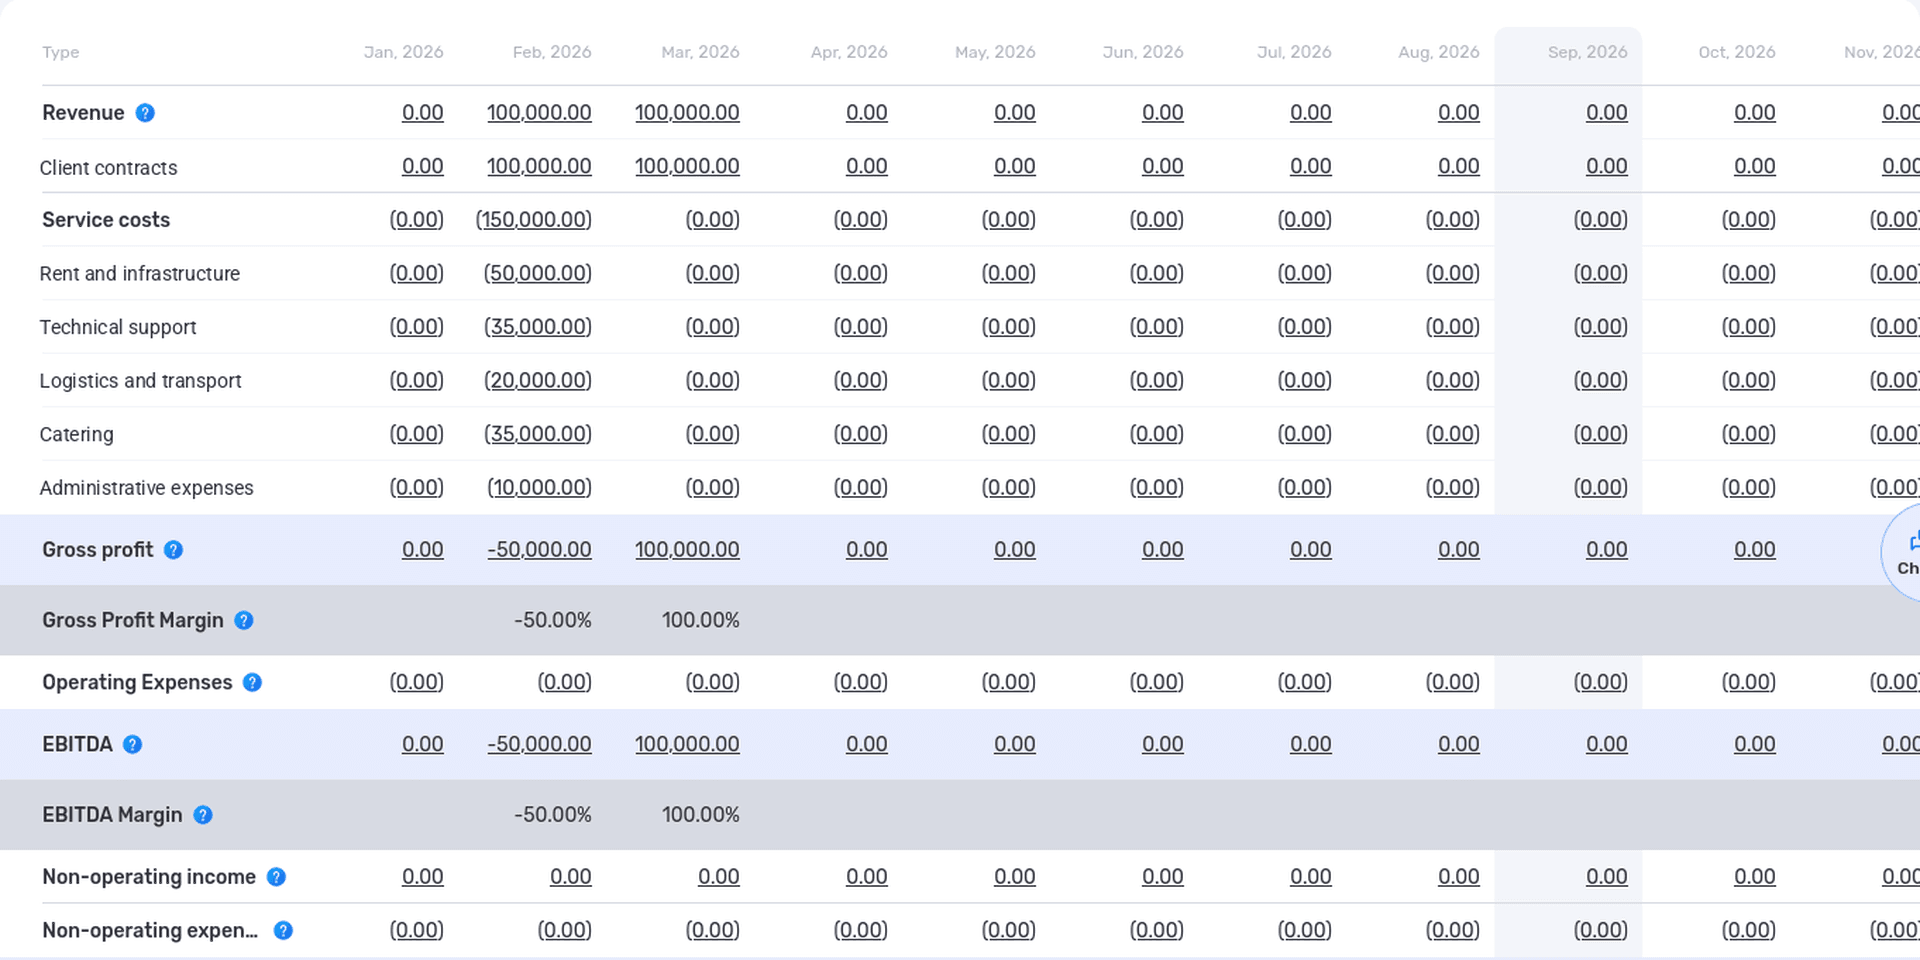
The P&L table view lets you compare revenue, expenses, and intermediate results by month.
For regular monitoring, you can choose several such metrics and agree in advance on what to do when they change. For example, when gross margin falls, the manager checks excess hours and contractor services in completed engagements. Our article on choosing and evaluating KPIs explains how to connect metrics with operating decisions.
Compare months for which all the data has already been collected. If the current period is not yet complete, treat any conclusions as preliminary: the result will change after payroll is accrued and the remaining invoices are entered.
Open the Transactions Behind an Amount
To explain a change in expenses, click the relevant amount in the P&L table. This opens the transactions that make up the figure. From there, you can open a specific record and check what was paid for, which project the work belongs to, and which recognition period was specified.
For the studio, we will start with contractors: spending on their services increased from UAH 80,000 to UAH 120,000. We will review the September transactions and check whether they all truly belong to that month and whether there are any duplicate records.
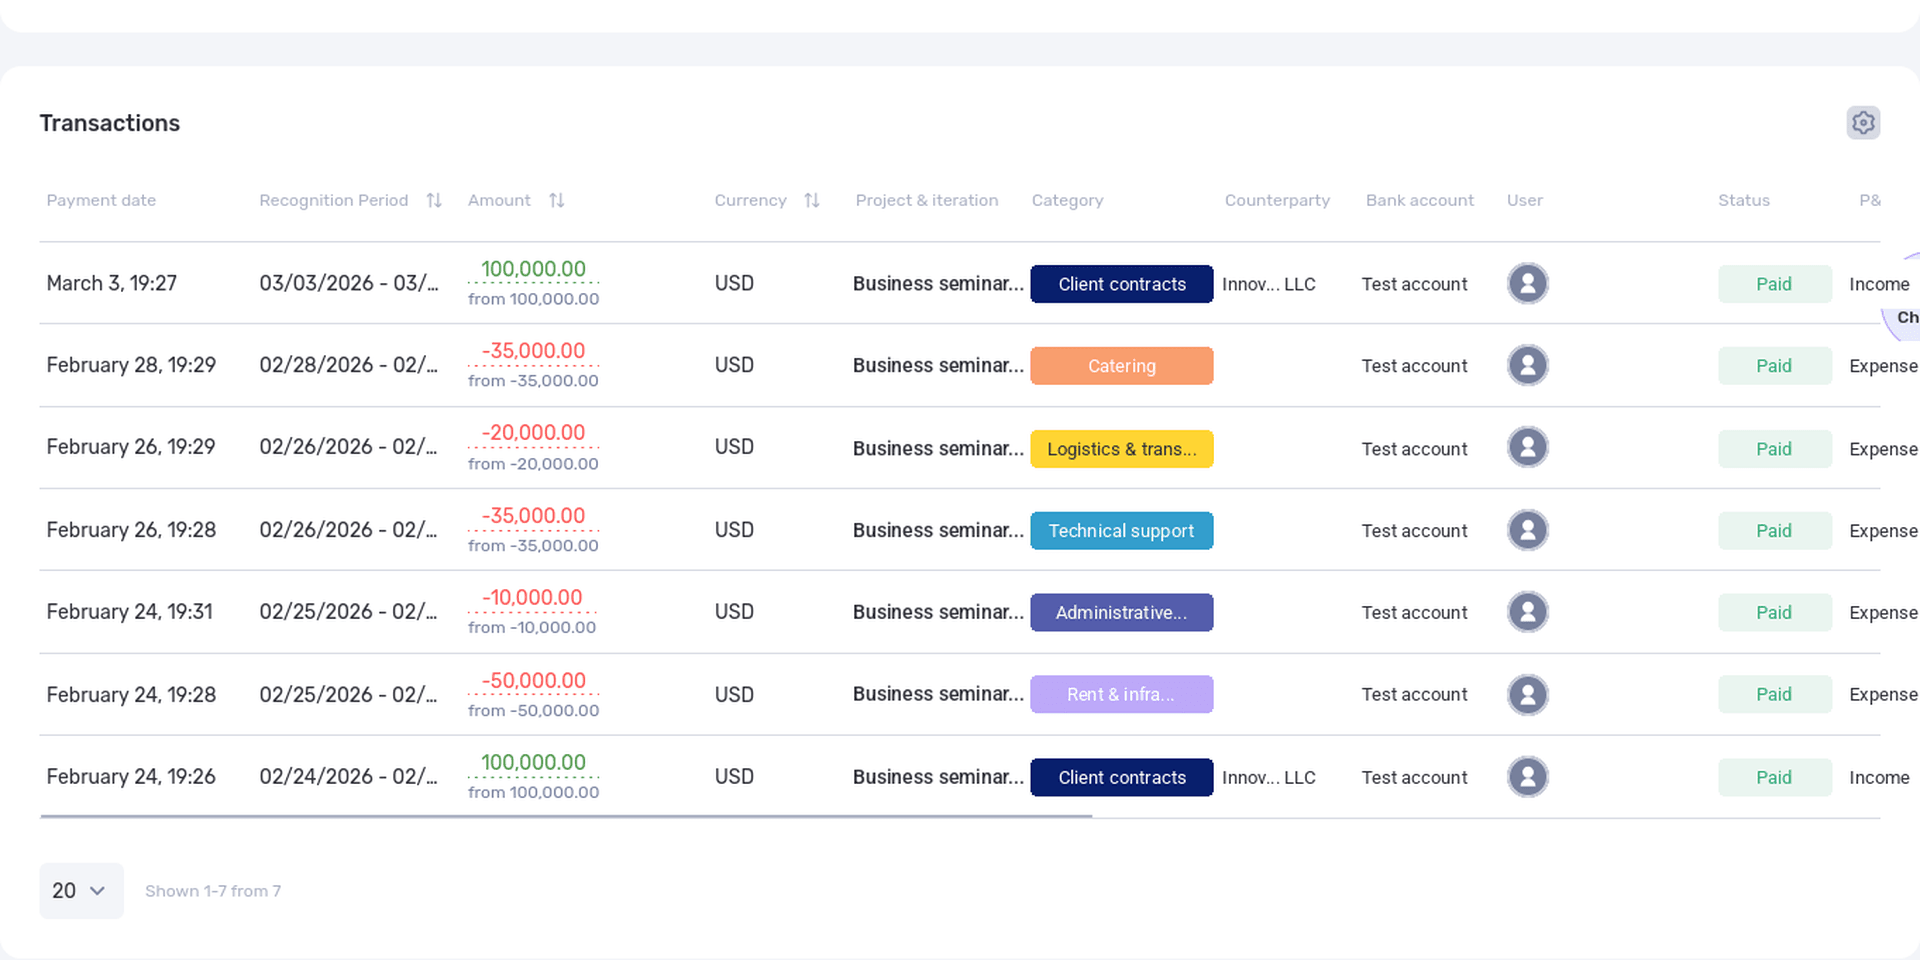
You can open the transactions behind an amount in the report and check what affected the expenses.
Suppose there are no errors and urgent website revisions account for part of the increase. The next step is to open the agreement with the client and check whether this work was included in the price. If it was added later, find out whether an additional fee was agreed before the work began.
The next decision depends on the answer. If the team regularly performs additional work without payment, the approval process needs to change. If the project’s complexity was underestimated at the start, use the actual hours and expenses when preparing future estimates. In each case, the action follows from the cause found in the data.
Review the Result of an Individual Project
Filters let you keep only the required project in the report and examine its revenue and expenses. After the review, return to the company-wide view: shared expenses may not be linked to a project and therefore may be missing from the filtered results.
For example, the website’s expenses include the team and contractors but not office rent or the administrator’s work. The result of this filtered view shows earnings after the recorded project expenses. To assess it including a share of company-wide expenses, you first need to define and apply allocation rules.
For long-term engagements, review the entire period of the work as well. Expenses may arise every month, while revenue may be recognized as milestones are completed. In that case, one month shows only part of the story and is not enough to draw a conclusion about the entire project.
Prepare the Report for Discussion
The P&L can be downloaded to Excel. Before exporting, check the period and filters: the file will contain exactly the data currently selected. This is useful when you need to discuss the result with the owner or continue the calculations in a spreadsheet. The export process is described in the P&L export guide.
Add a brief explanation of the changes to the file. For Kontur, it might read as follows: revenue increased by 20%, but net profit fell by UAH 10,000; contractor and marketing expenses saw the largest increases. Then note what the team has already established and what it will check before the next meeting.
This makes it easier to continue the discussion a month later. You can check whether the process for approving additional work was changed, what results the advertising produced, and how this affected profit.
What to Check Before Discussing the P&L
Before making decisions about pricing, hiring, or cutting expenses, check whether the totals can be trusted. This is especially important if the figures changed sharply even though nothing noticeable happened in the company’s operations. This table will help you review the most common causes of discrepancies.
If the totals change after the data is corrected, update the file prepared for discussion and briefly explain why. This ensures that the team works from the same figures and that a previous error does not turn into a false conclusion about the business.
Frequently Asked Questions About P&L
How Often Should You Prepare the Report?
Start with a monthly report, and review the trend over a longer period once a quarter. If the business is seasonal, it is also useful to compare the same months across different years.
Does a Small Company Need a P&L?
Team size alone does not determine whether a company needs the report. Even a team of just a few people may run projects with different levels of profitability, offer discounts, and work with deferred payments. A simple P&L helps the owner see what remains after expenses. You can start with a few categories and add detail when a practical question requires it.
Can You Maintain a P&L in a Spreadsheet?
Yes. With a small number of transactions, a spreadsheet is enough to collect the data, set up formulas, and start comparing months. You only need to agree on who completes and reviews it.
As the number of projects and records grows, so does the amount of manual work: data has to be transferred, payments allocated, and file versions monitored. A system becomes useful when it lets the company work with the same data the team already uses to manage projects and finances.
How Does a P&L Differ from a Balance Sheet?
A P&L shows revenue, expenses, and profit over a specific period. A balance sheet shows what the company owns and owes on a specific date: assets, liabilities, and equity. Together, these reports reveal not only the result of the company’s work but also its financial position.
How Does a Management P&L Differ from the Statutory Income Statement?
A company configures its management P&L around its own needs: it can show business lines, projects, the team, or contractors separately. The statutory income statement is prepared according to prescribed rules and in a prescribed format. The underlying data may be related, but a management report does not replace mandatory financial statements.
Can the Entire Net Profit Be Withdrawn?
A P&L alone is not enough to make this decision. Before making a distribution, check cash balances, company debts, and upcoming payments. Some of the revenue shown in the report may still be unpaid.
Prepare Your First Report for a Month You Can Verify
For your first P&L, choose a completed month for which you have data on client work, payroll, and contractor services. Separate project delivery costs from the cost of running the company as a whole, check the recognition periods, and investigate any unclear amounts. At this stage, it is more important to make sure the data is reliable than to create many detailed categories.
You can then add another month and compare the results. This will reveal the first questions about costs, pricing, or shared expenses. Once the team learns to answer them with data, the monthly report will become a routine part of the company’s work.
In if.team, you can track revenue and expenses alongside projects, view the P&L, and open the transactions behind the totals. Try if.team to prepare a report using your company’s data and see how its profit is formed.
Author
Vladyslav ChesnokovPublished
Sep 19, 2026
More articles to read

What Is a KPI in Simple Terms, What It’s For, and How to Evaluate It
What is a KPI in simple terms? It’s one number or several numbers that show whether you’re actually moving toward a specific goal. Not how many actions you took, but whether a result appeared. A KPI isn’t for reporting. It’s for managing work. You look at the indicator and understand what exactly…

What a Bottleneck Is in Business and How to Identify It
A bottleneck in business is the point where a process actually slows down. Not formally, but in reality. This is where tasks pile up, waiting time increases, and the entire system starts working more slowly than it could. It can be a specific person who physically cannot handle the workload. It…

RACI Matrix: Simple Explanation, How It Works, and Use Cases
The RACI matrix helps teams quickly agree on who does what in a project: who performs the work, who is accountable for the final result, who provides expertise, and who needs to receive updates. When these roles are defined upfront, it becomes easier to align decisions and coordinate actions.…

Gantt chart: what it is, why you need it, and how to build a simple working format
In this guide, we’ll break down what this format is, the types of Gantt charts, how to work with them, and how to build a simple online version. No fancy terms or unnecessary decoration. Only what helps you plan.

What is a Kanban board: a simple explanation of the system, method, and principles
One of the first and most effective such systems was kanban. This method combined simplicity and discipline. It doesn’t replace people or add unnecessary bureaucracy — it simply helps reveal what used to be hidden in the chaos of daily work.

Agile vs Waterfall: Which Methodology to Choose
The choice of project management methodology affects the speed of work, process control, and team efficiency. Agile and Waterfall are the two most popular approaches. Agile is flexible, focused on quick changes. Waterfall is sequential, with clear structure and documentation. In this article, we…
Start your free 7-day trial
No credit card required. Get full access to all features and see how if.team can transform your team's workflow.