Workload
The “Workload” view displays the team’s working-time records as a timesheet table. It is a convenient tool for monitoring employee workload: you can see how much time was tracked for each task on each day. To open this view, click “Workload” in the upper-right corner of the “Tasks” page.
Display Period
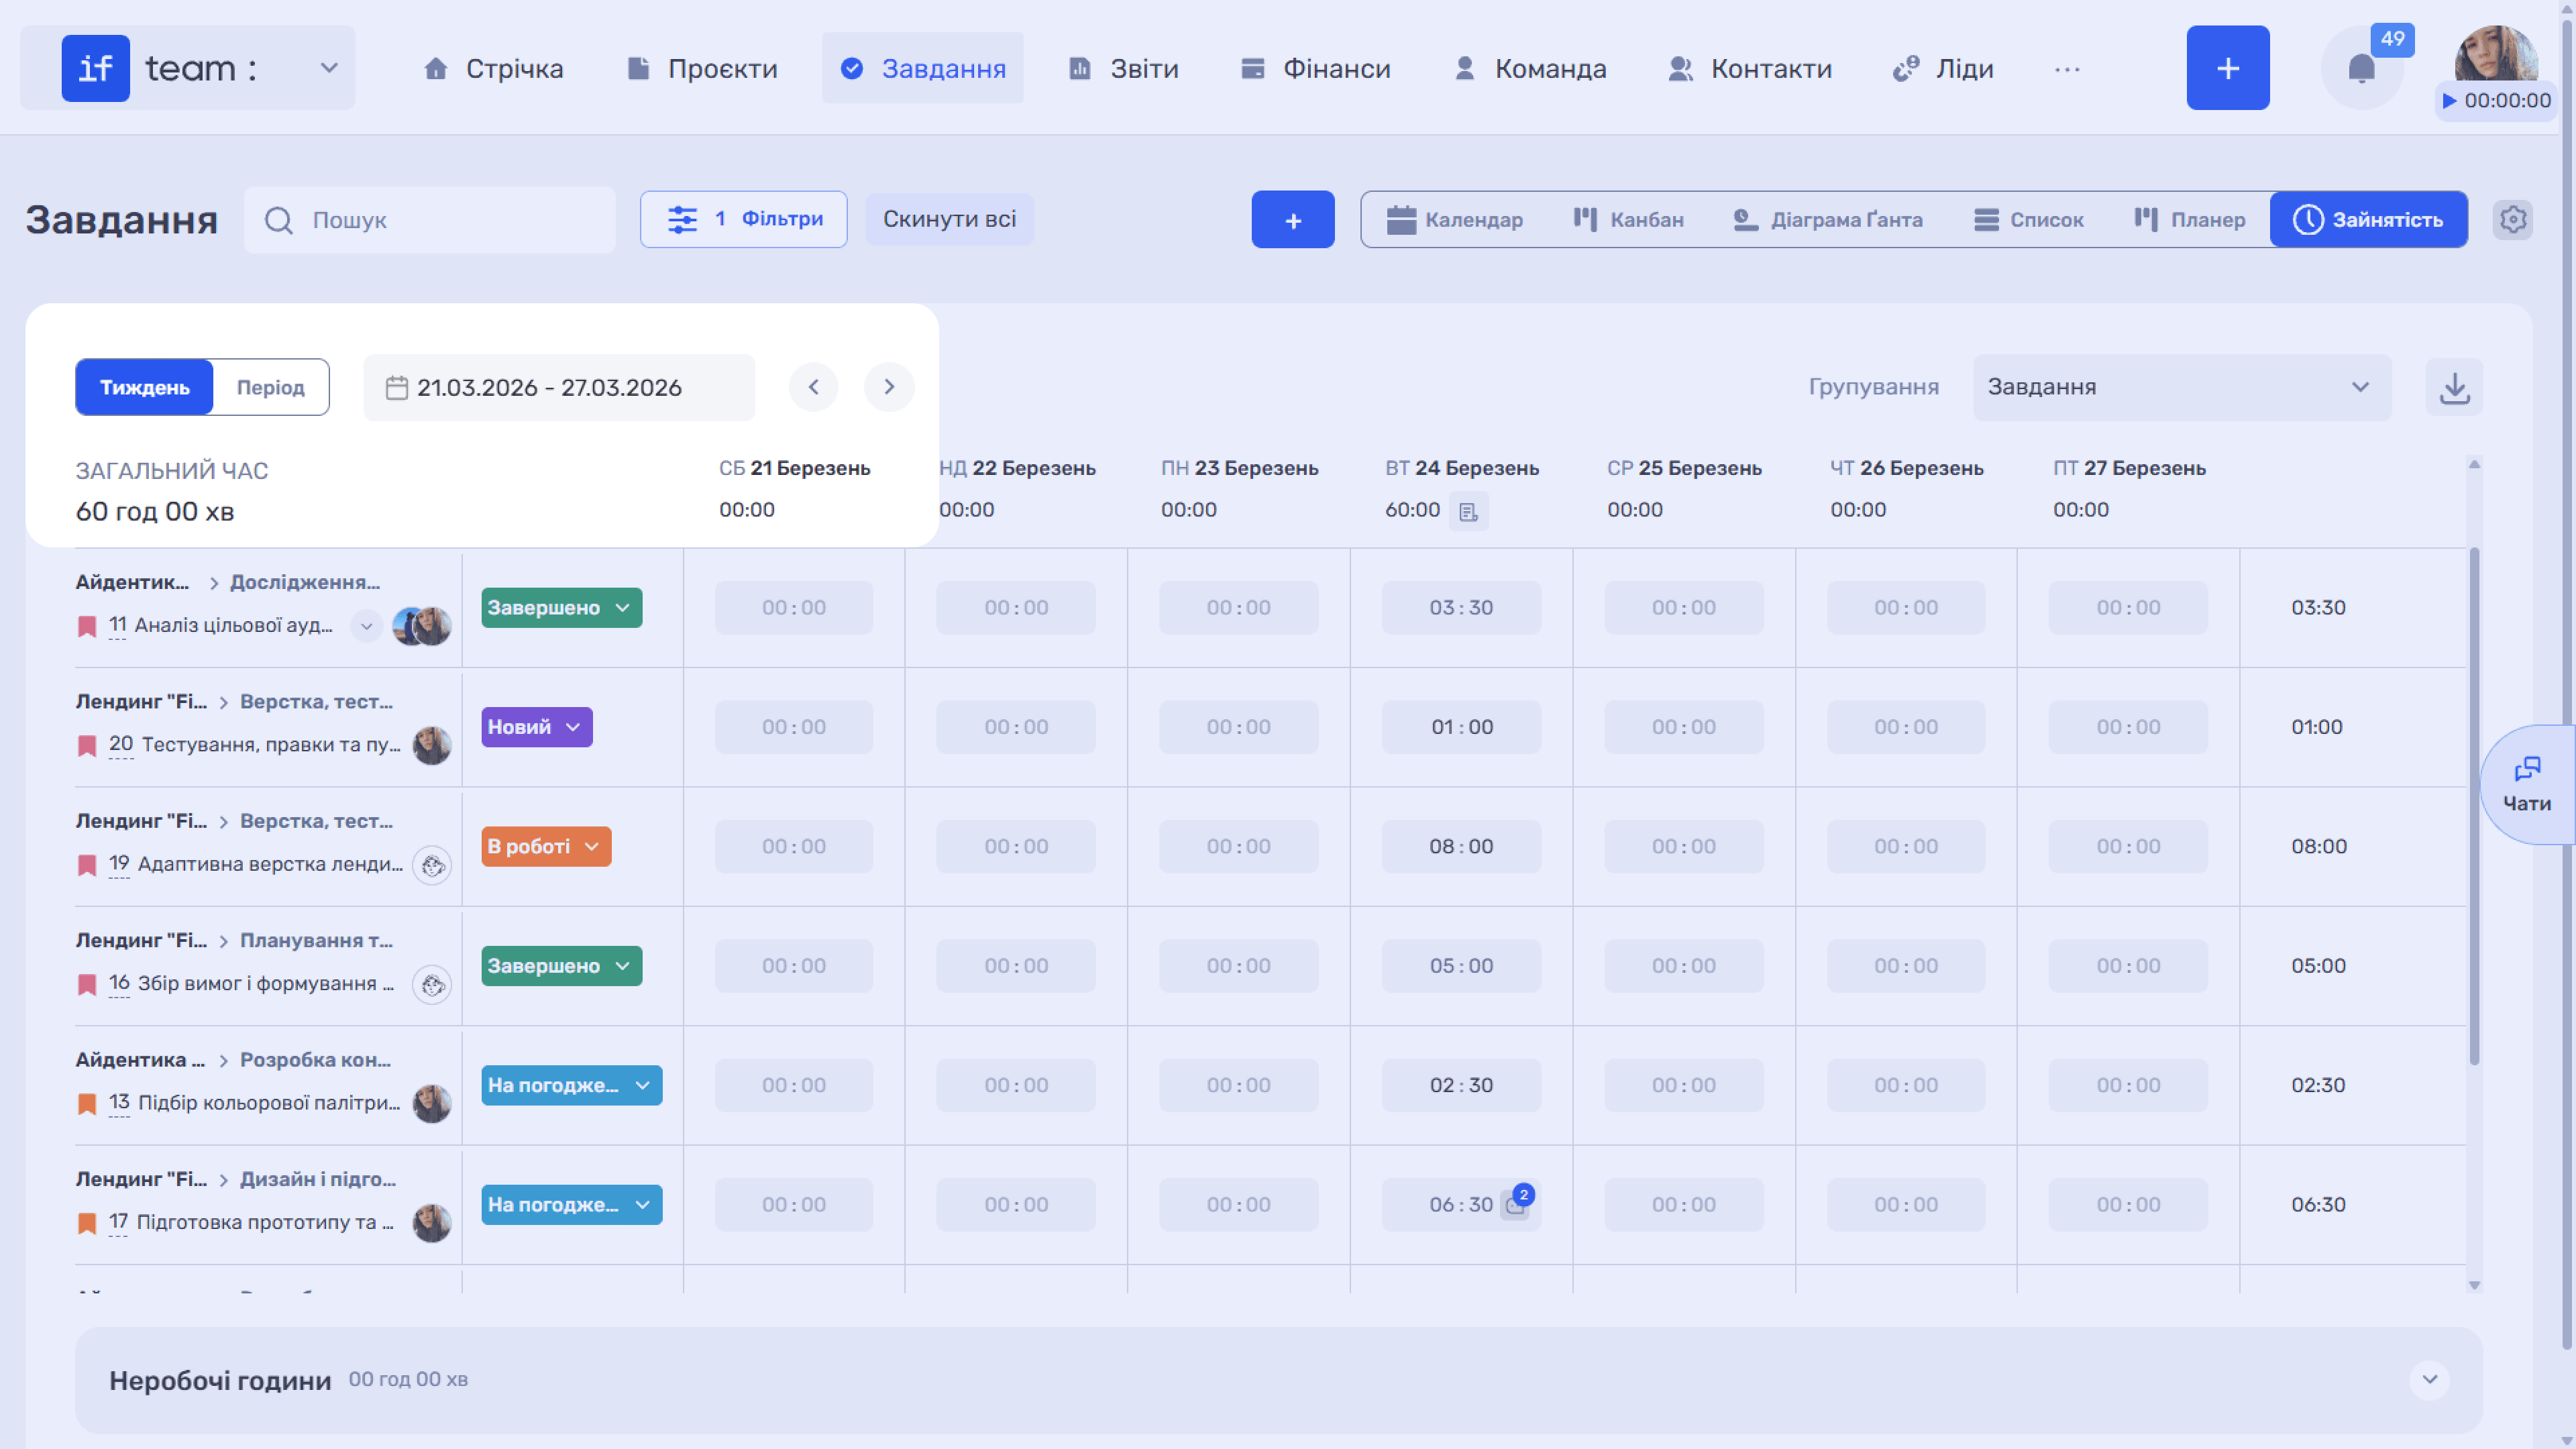
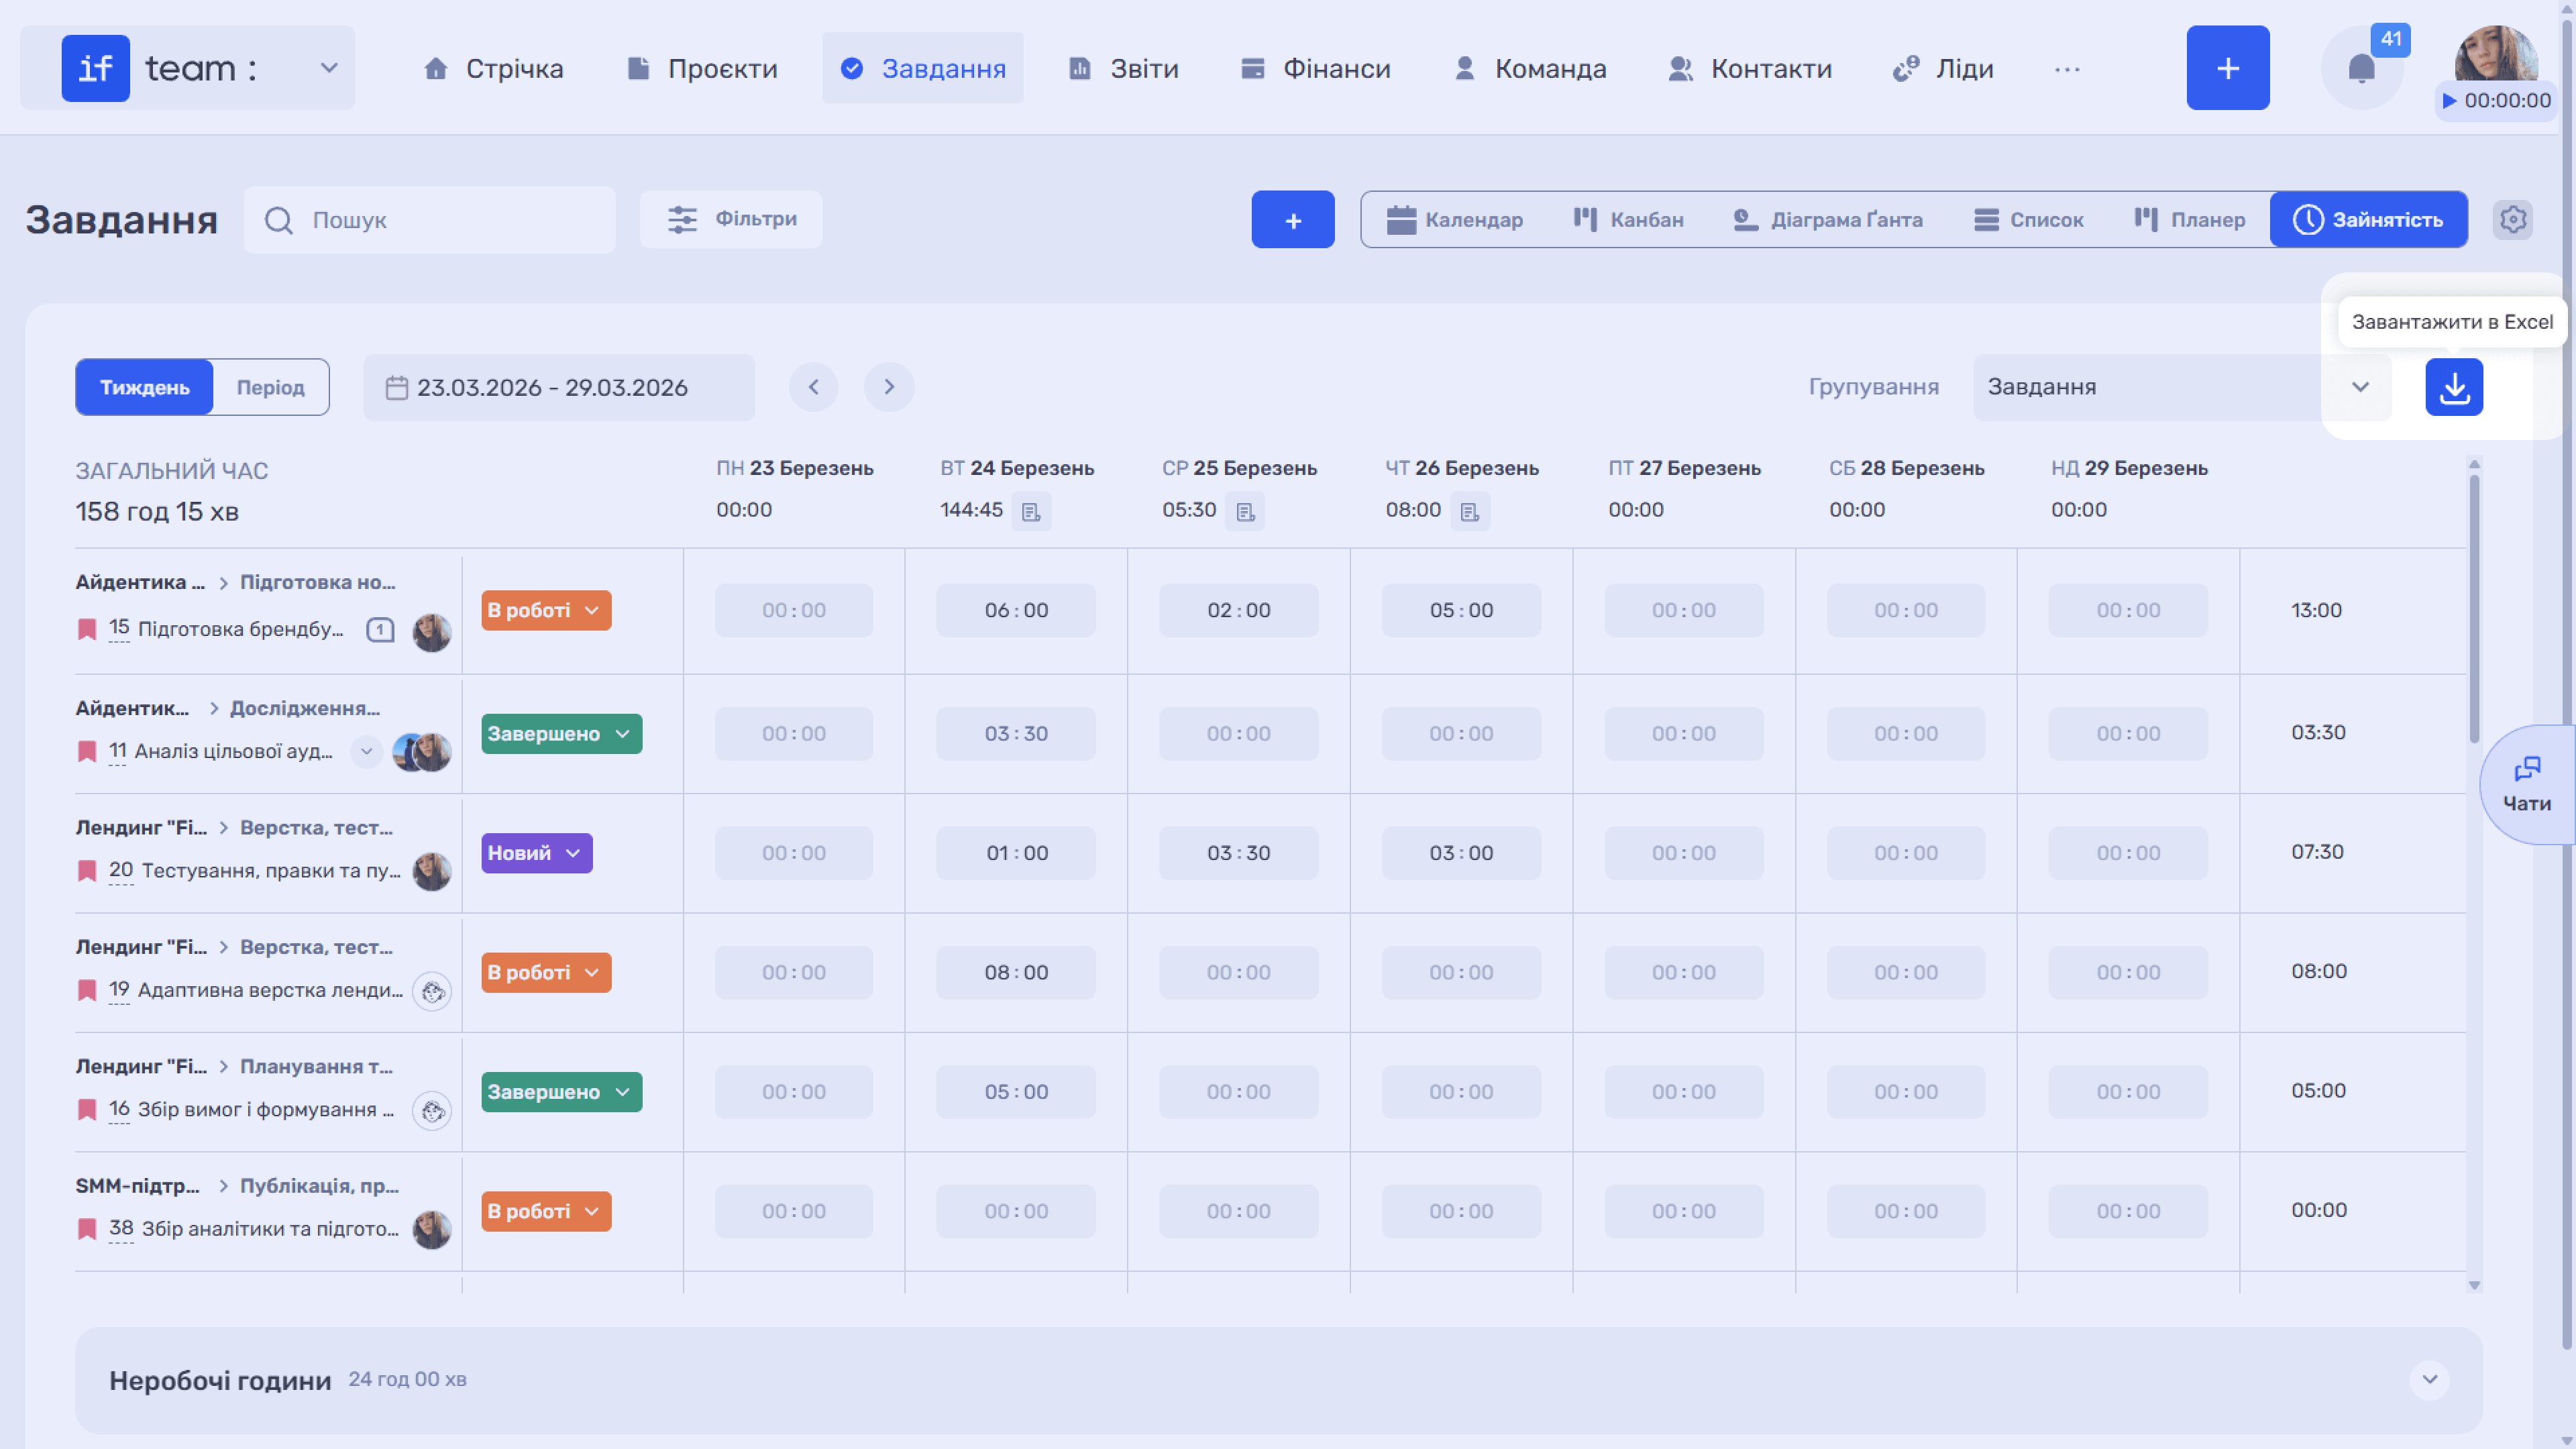
In the upper-left corner, select “Week” or “Period,” which lets you choose a custom date range. Use the arrows (‹ ›) to move between periods. “Total Time” on the left shows the total tracked time for the selected period.
Grouping
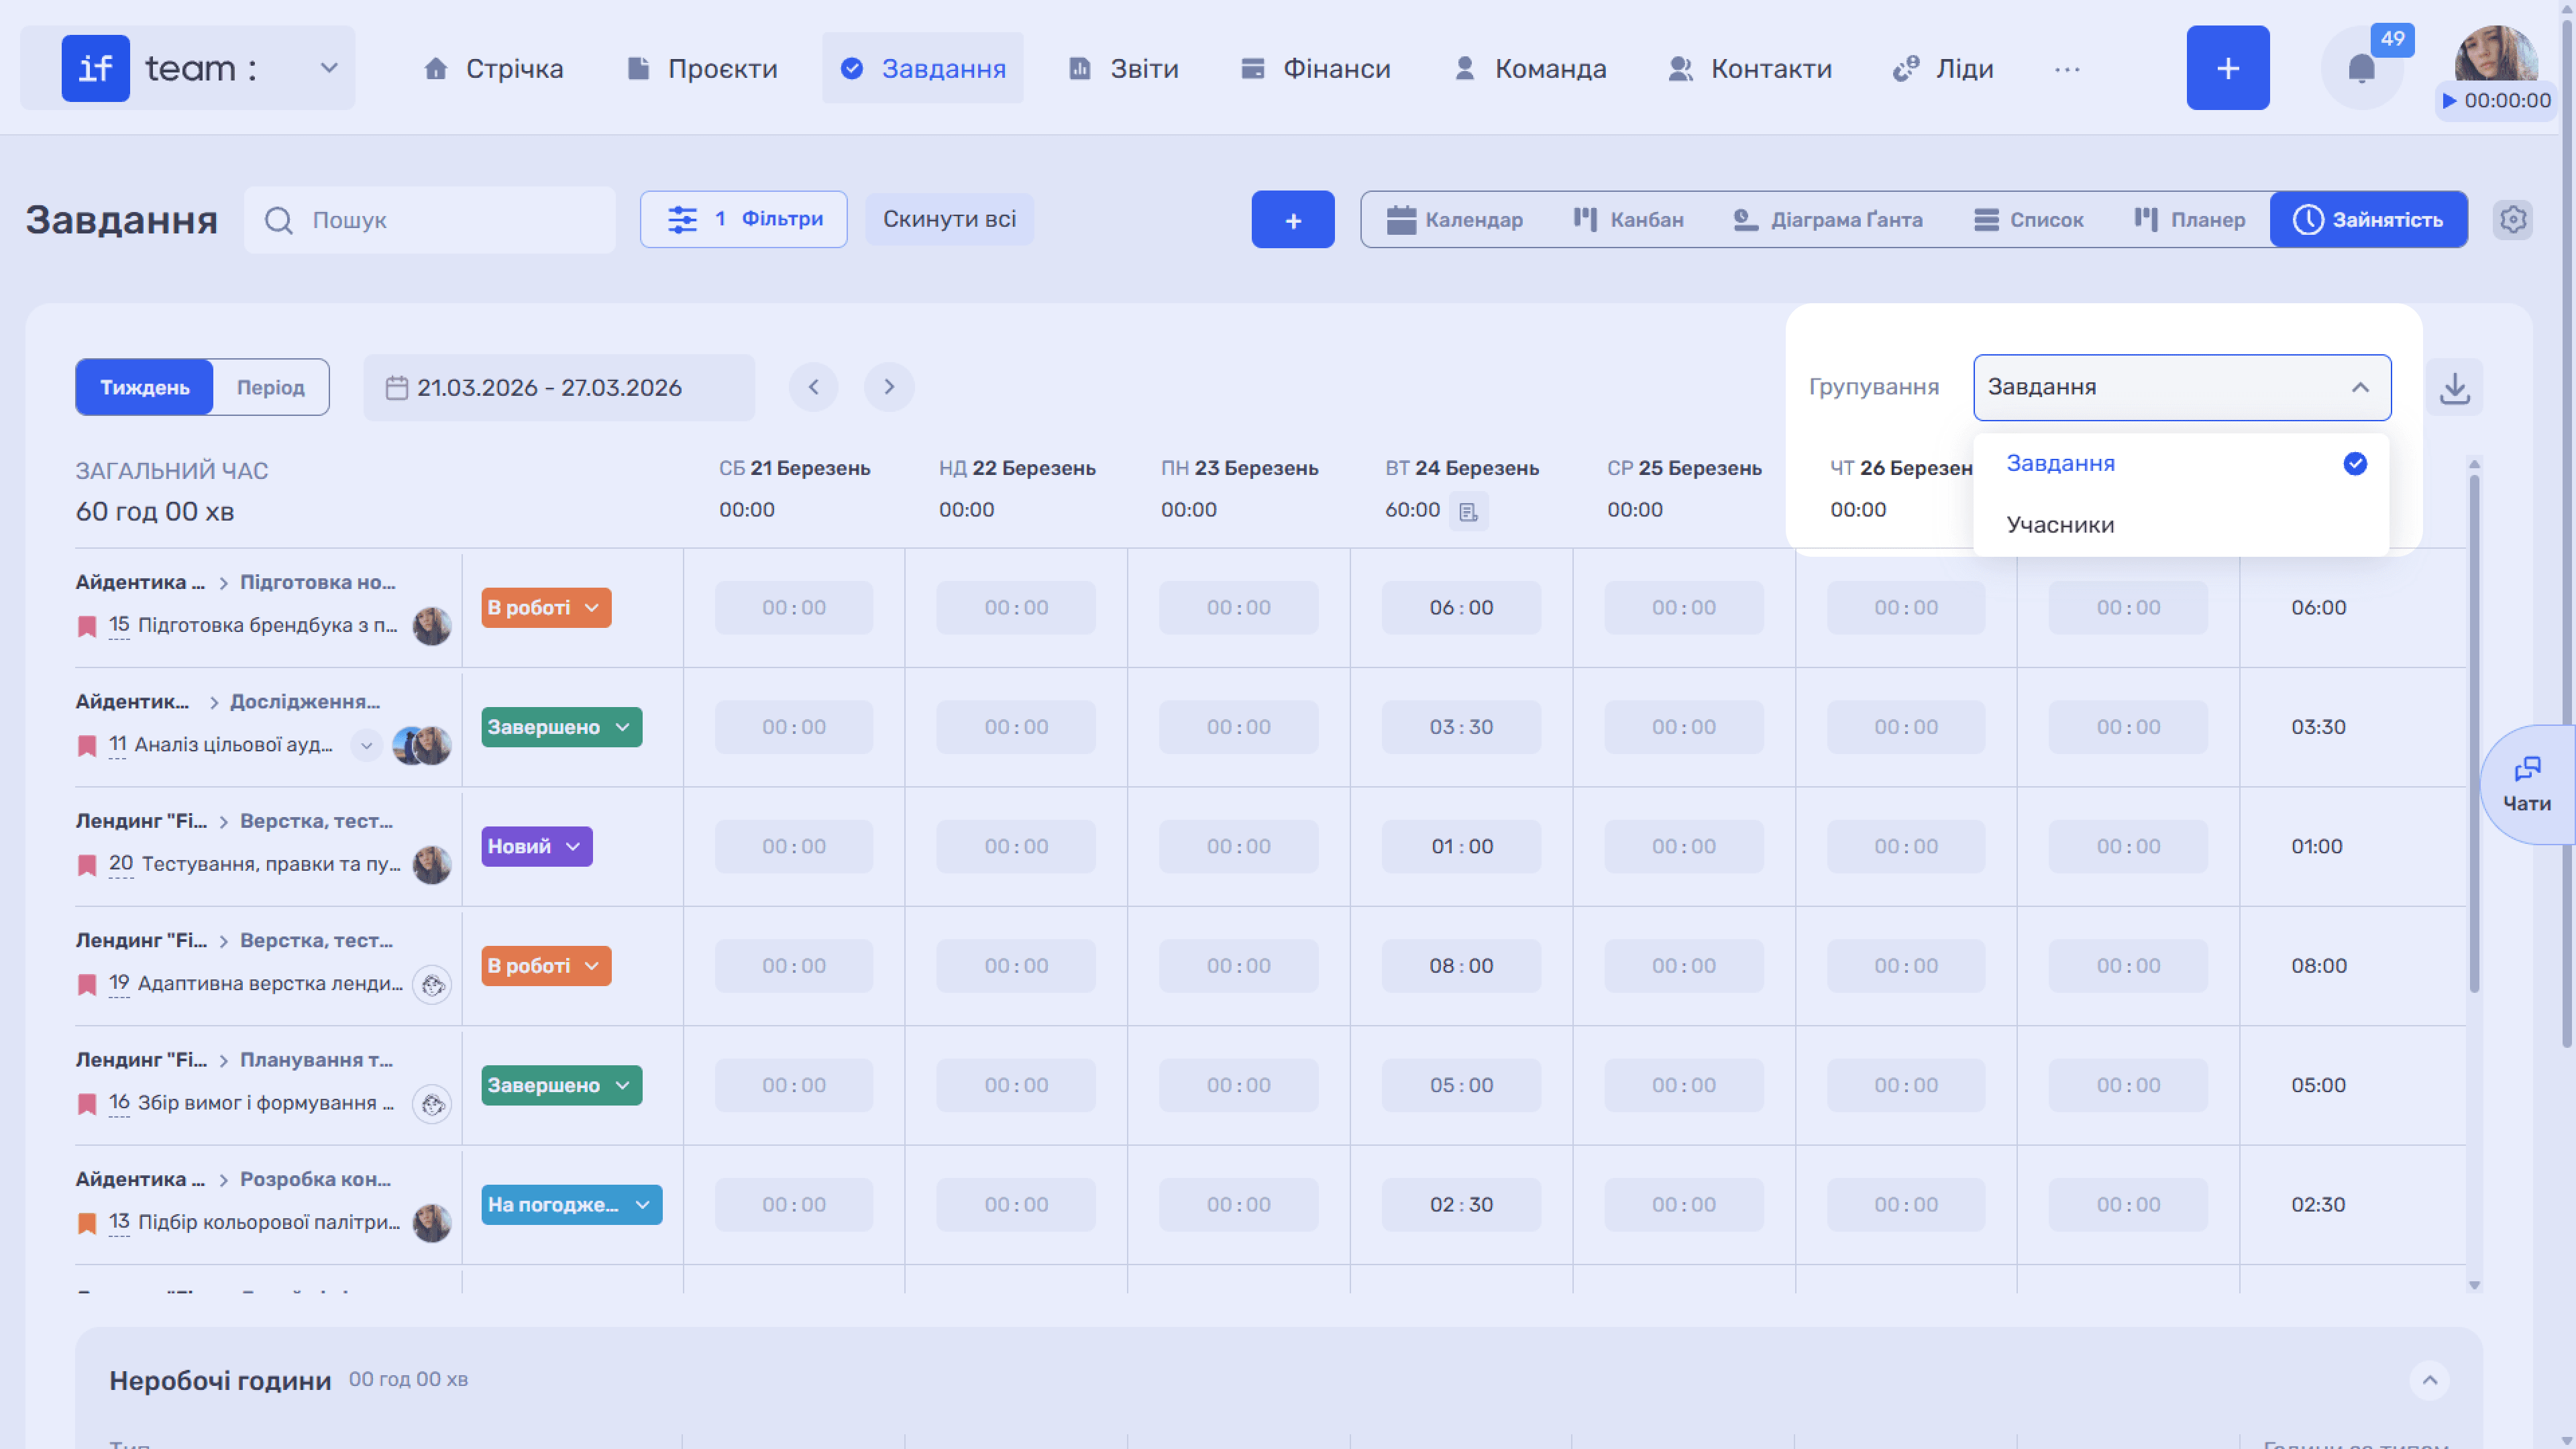
Use the “Grouping” switcher on the right side of the screen to organize the data in two ways:
- By Tasks displays each task as a separate row with time distributed across days.
- By Members displays each employee as a separate row with their total time for the period.
Time-Tracking Table
Each table row shows time tracked by day of the week and the total on the right. For tasks, the project, iteration, status, and assignee are displayed.
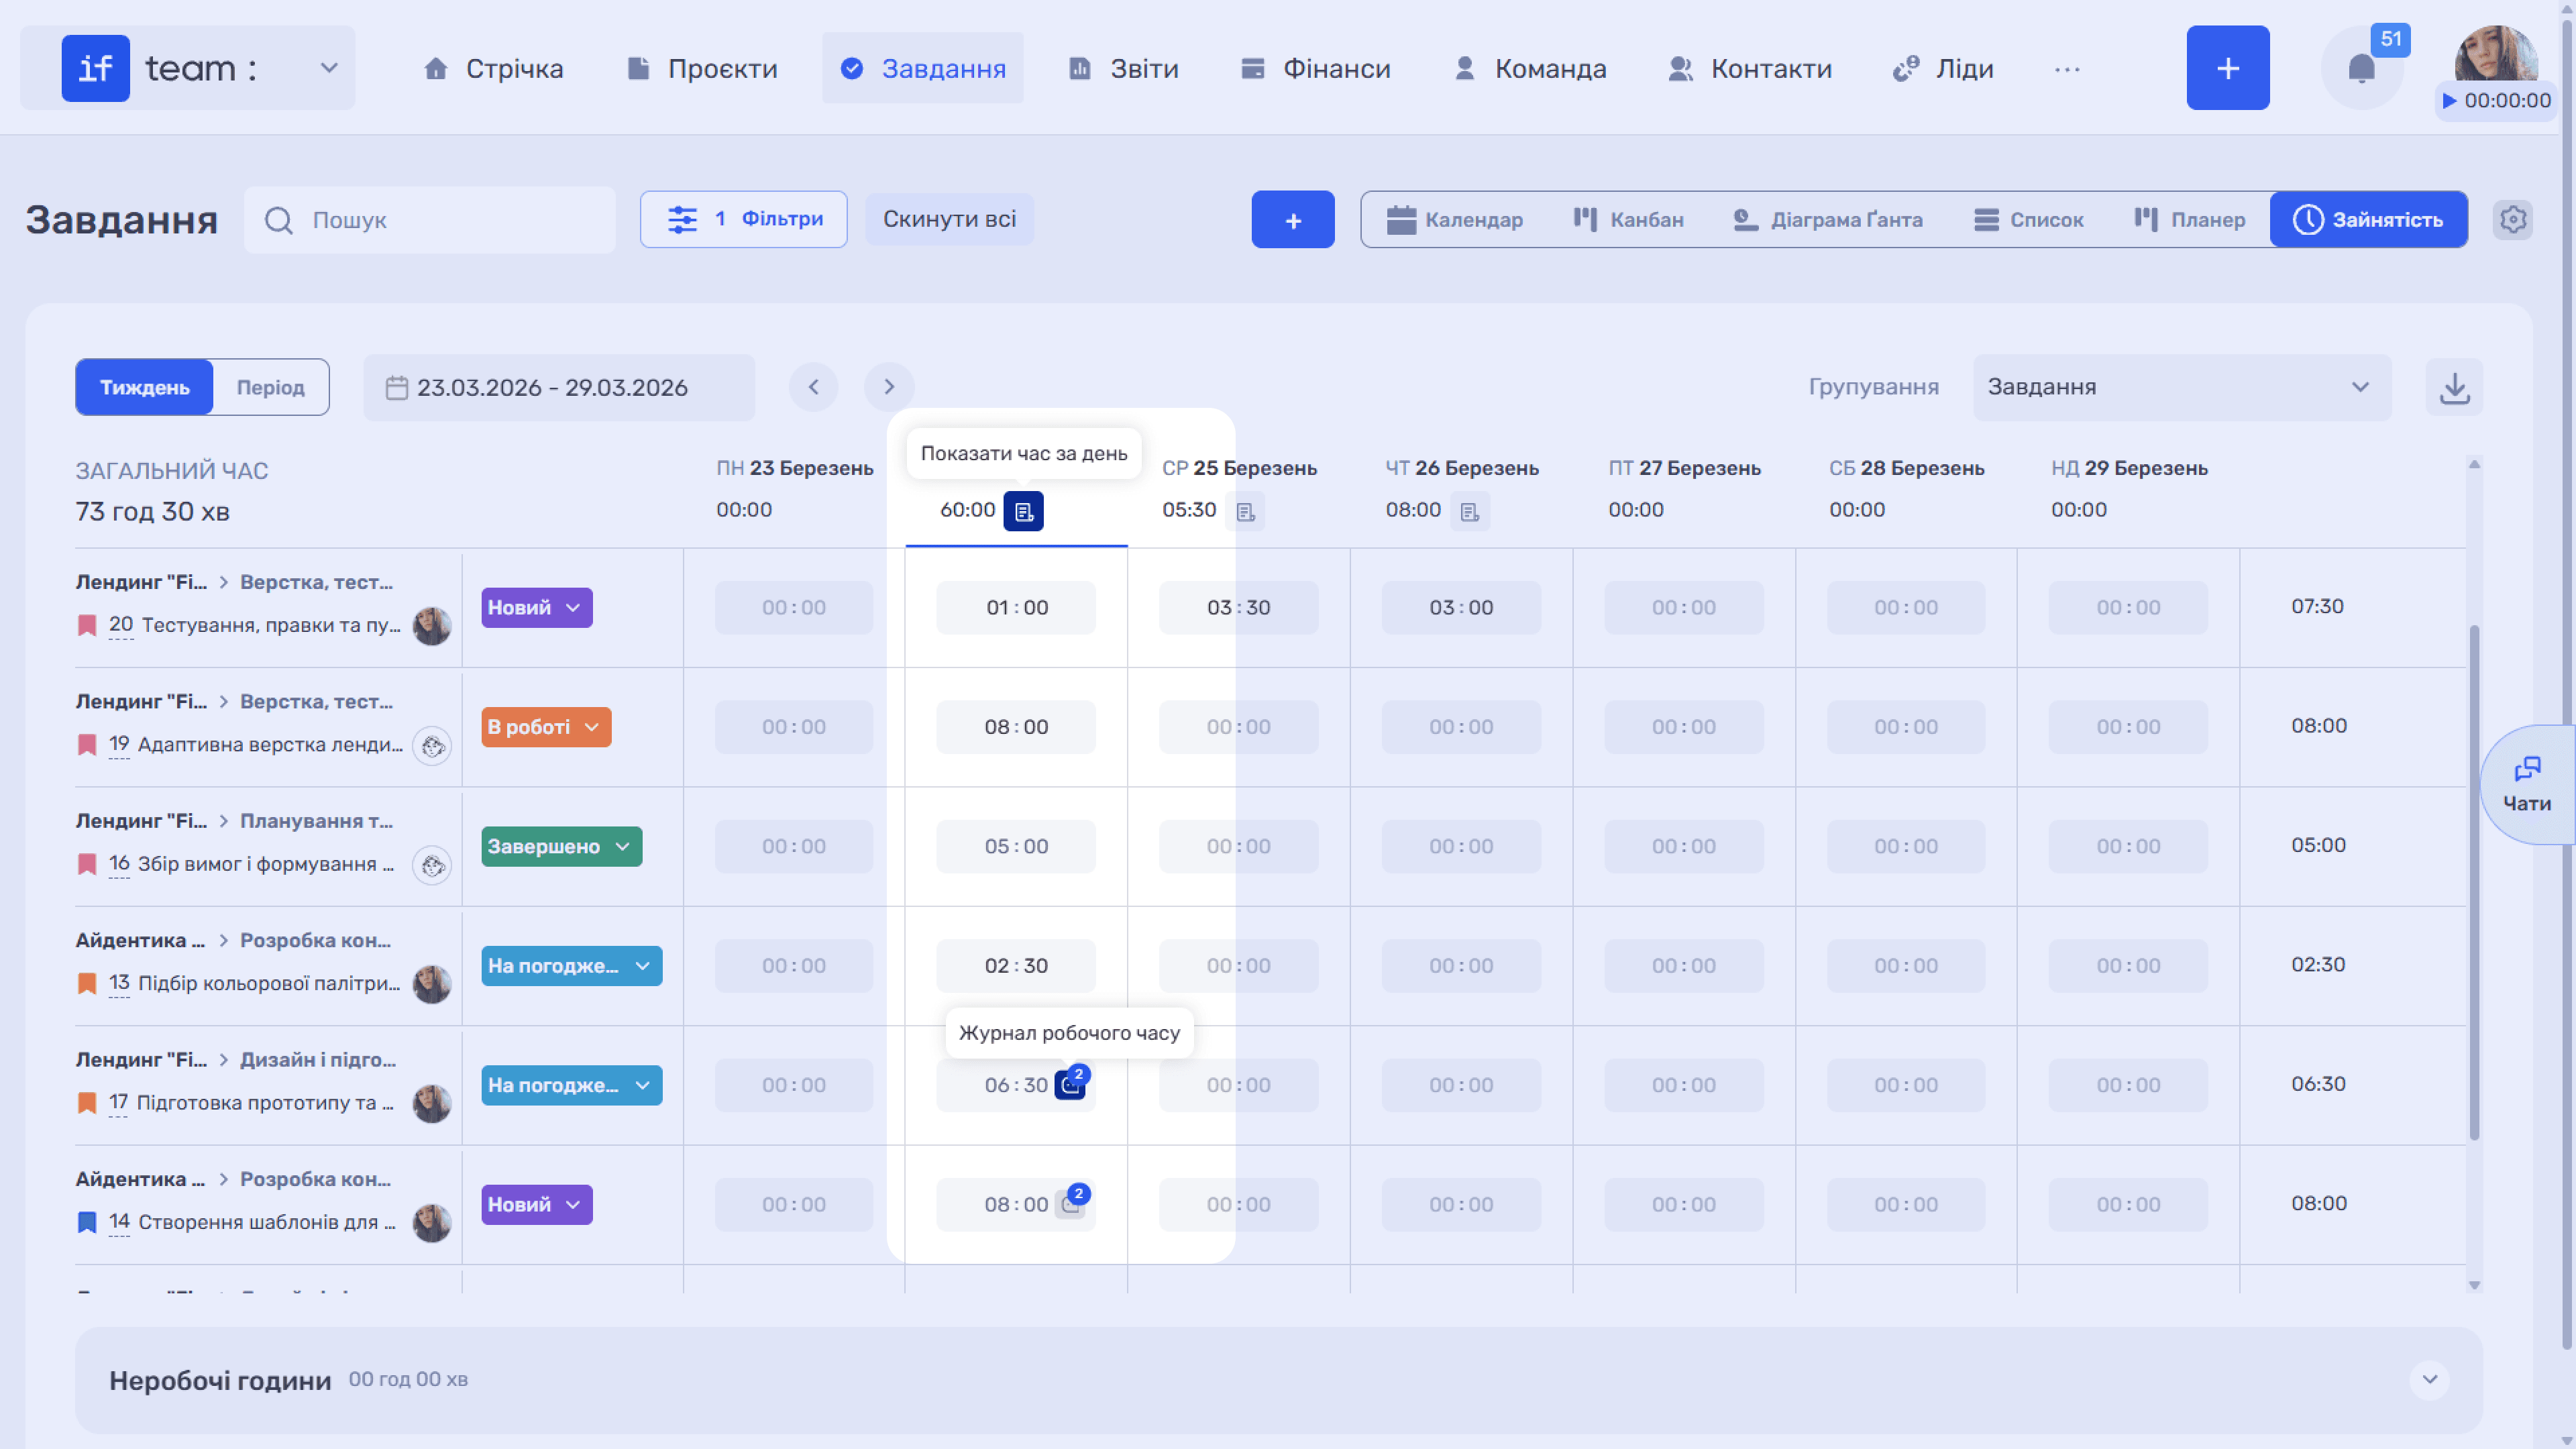
You can view tracked-time details at two levels. To view a summary for an entire day, click the “Show Time for Day” icon (📄) next to the total time in the header of that date’s column. A log opens with all entries for that day across all tasks. To view the time for a specific task, click the “Working Time Log” icon (📄) in the corresponding cell. A log opens containing only that task’s entries for the day.
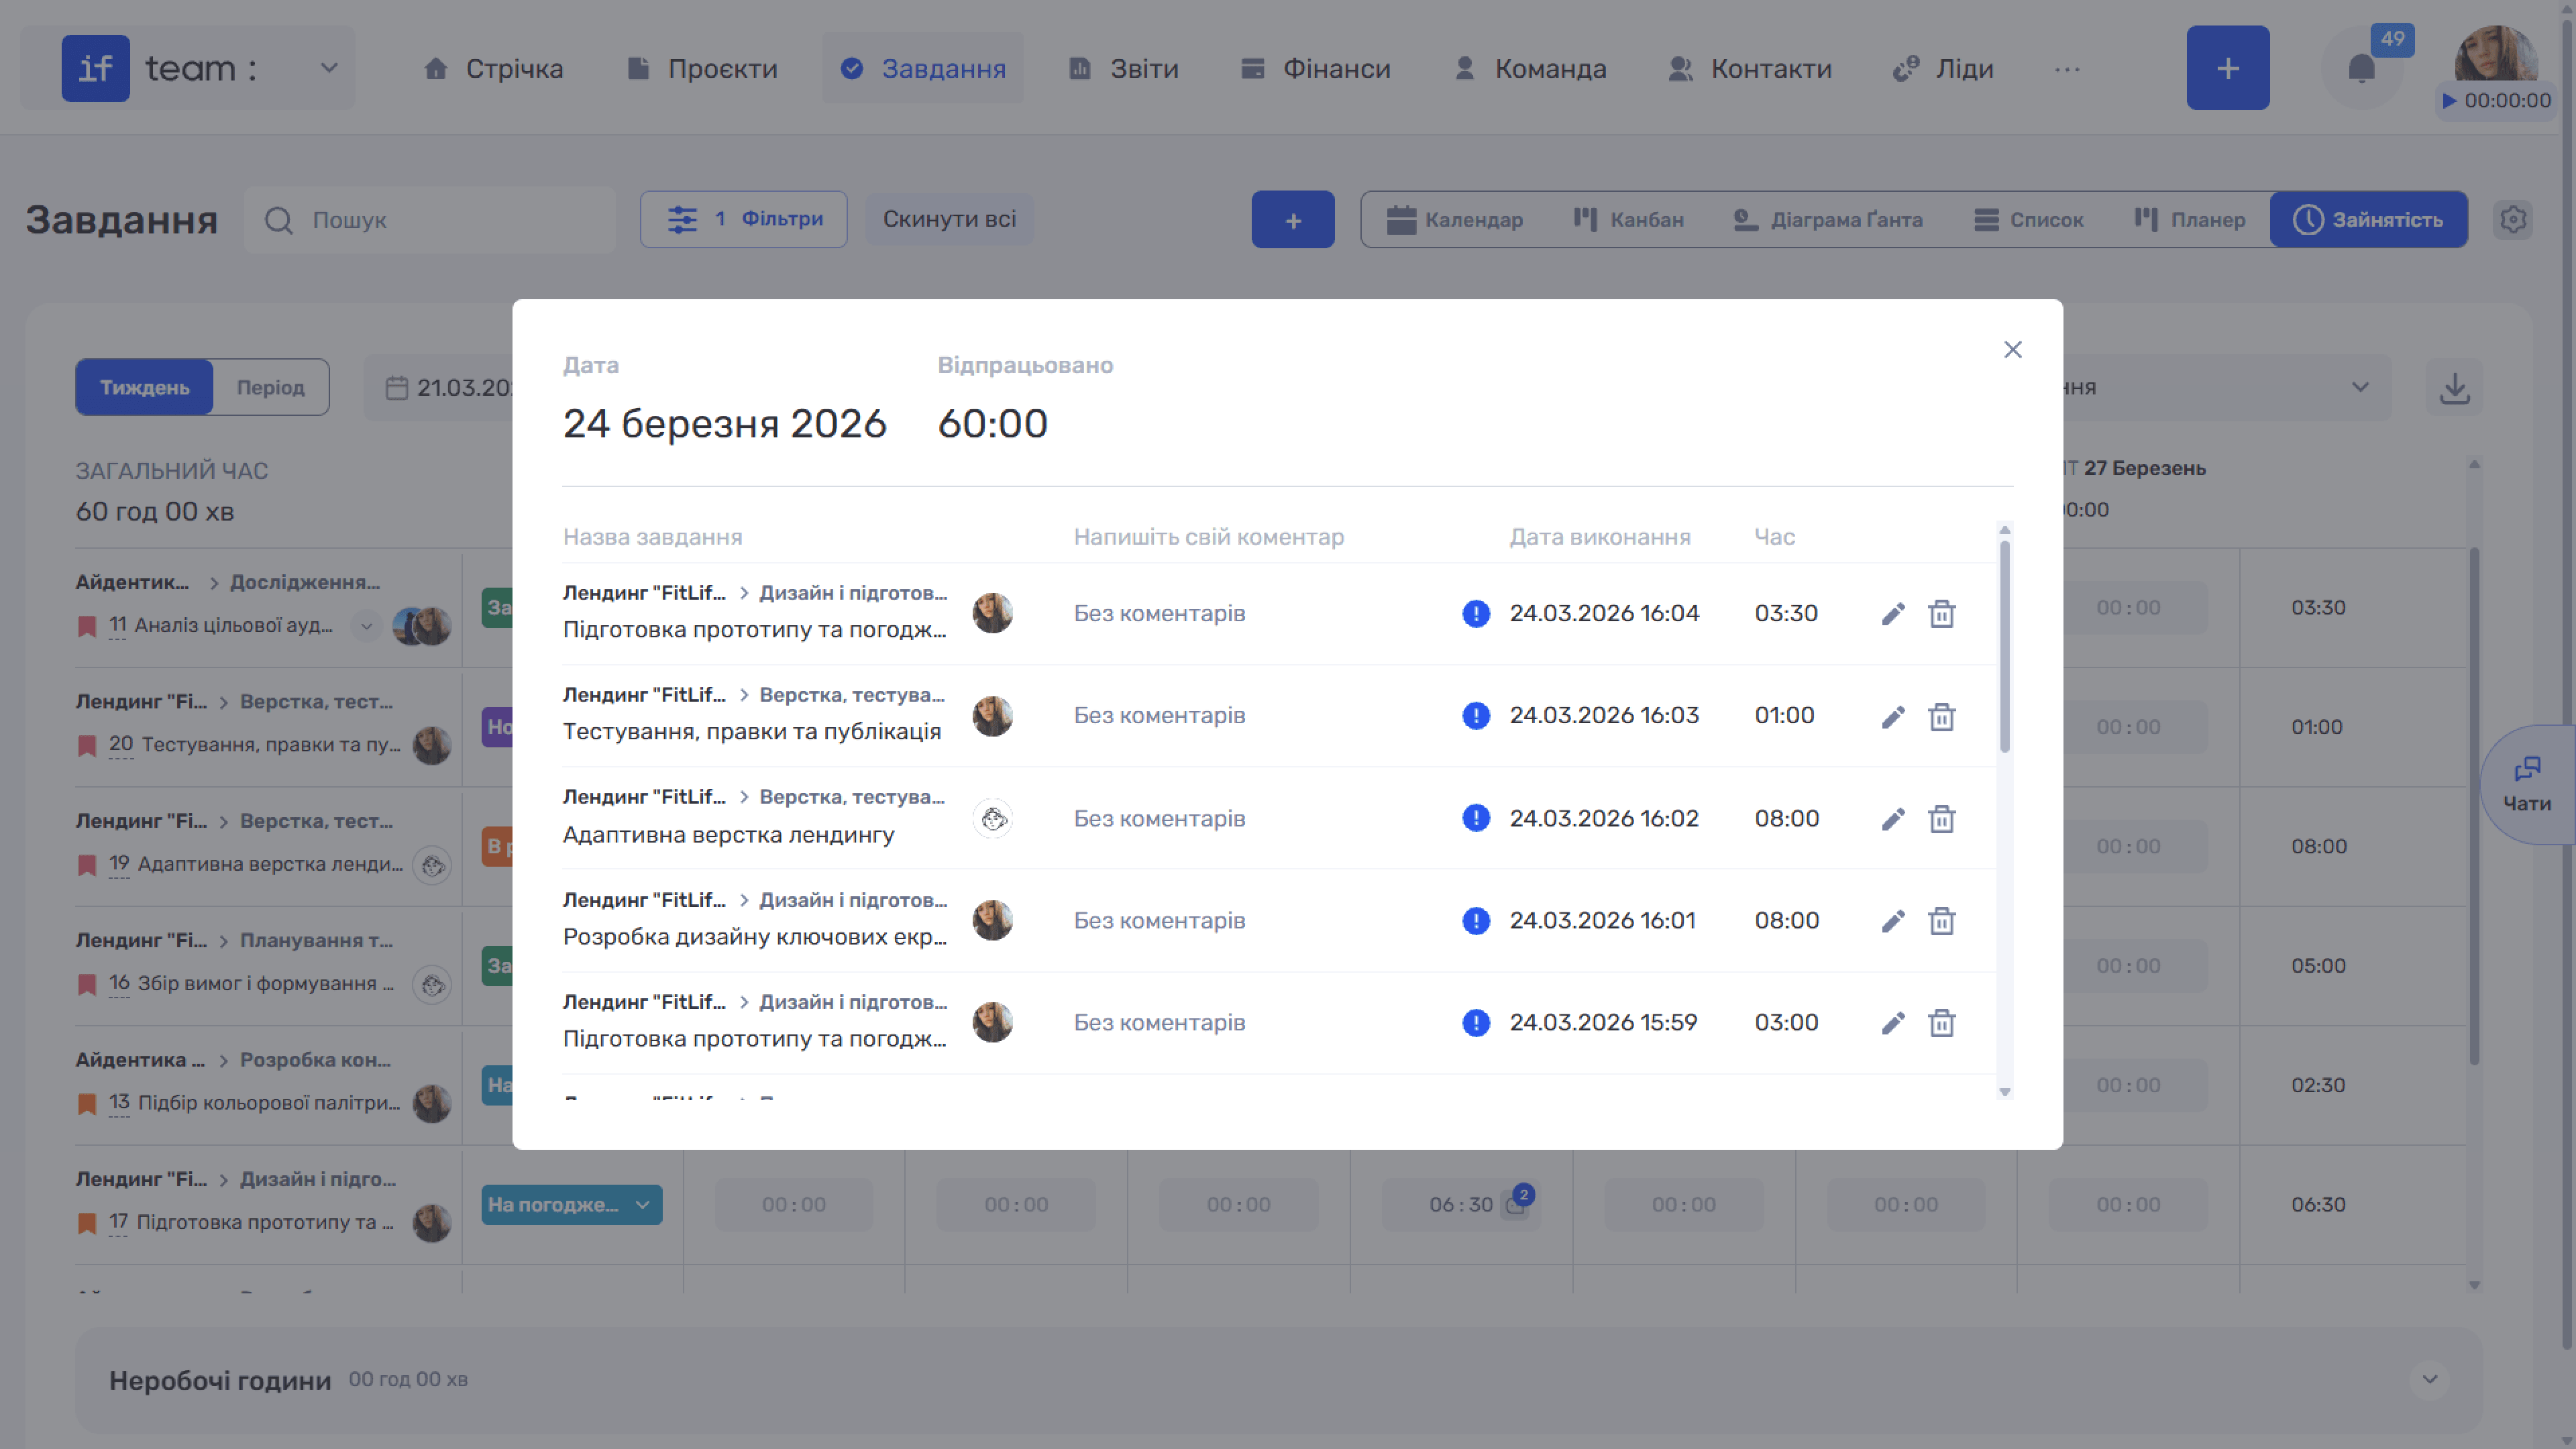
In both cases, the log window displays the date and total time worked, followed by a list of entries: task name, including project and iteration, assignee, comment, date and time recorded, and duration. You can edit (✏) or delete (🗑) each entry.
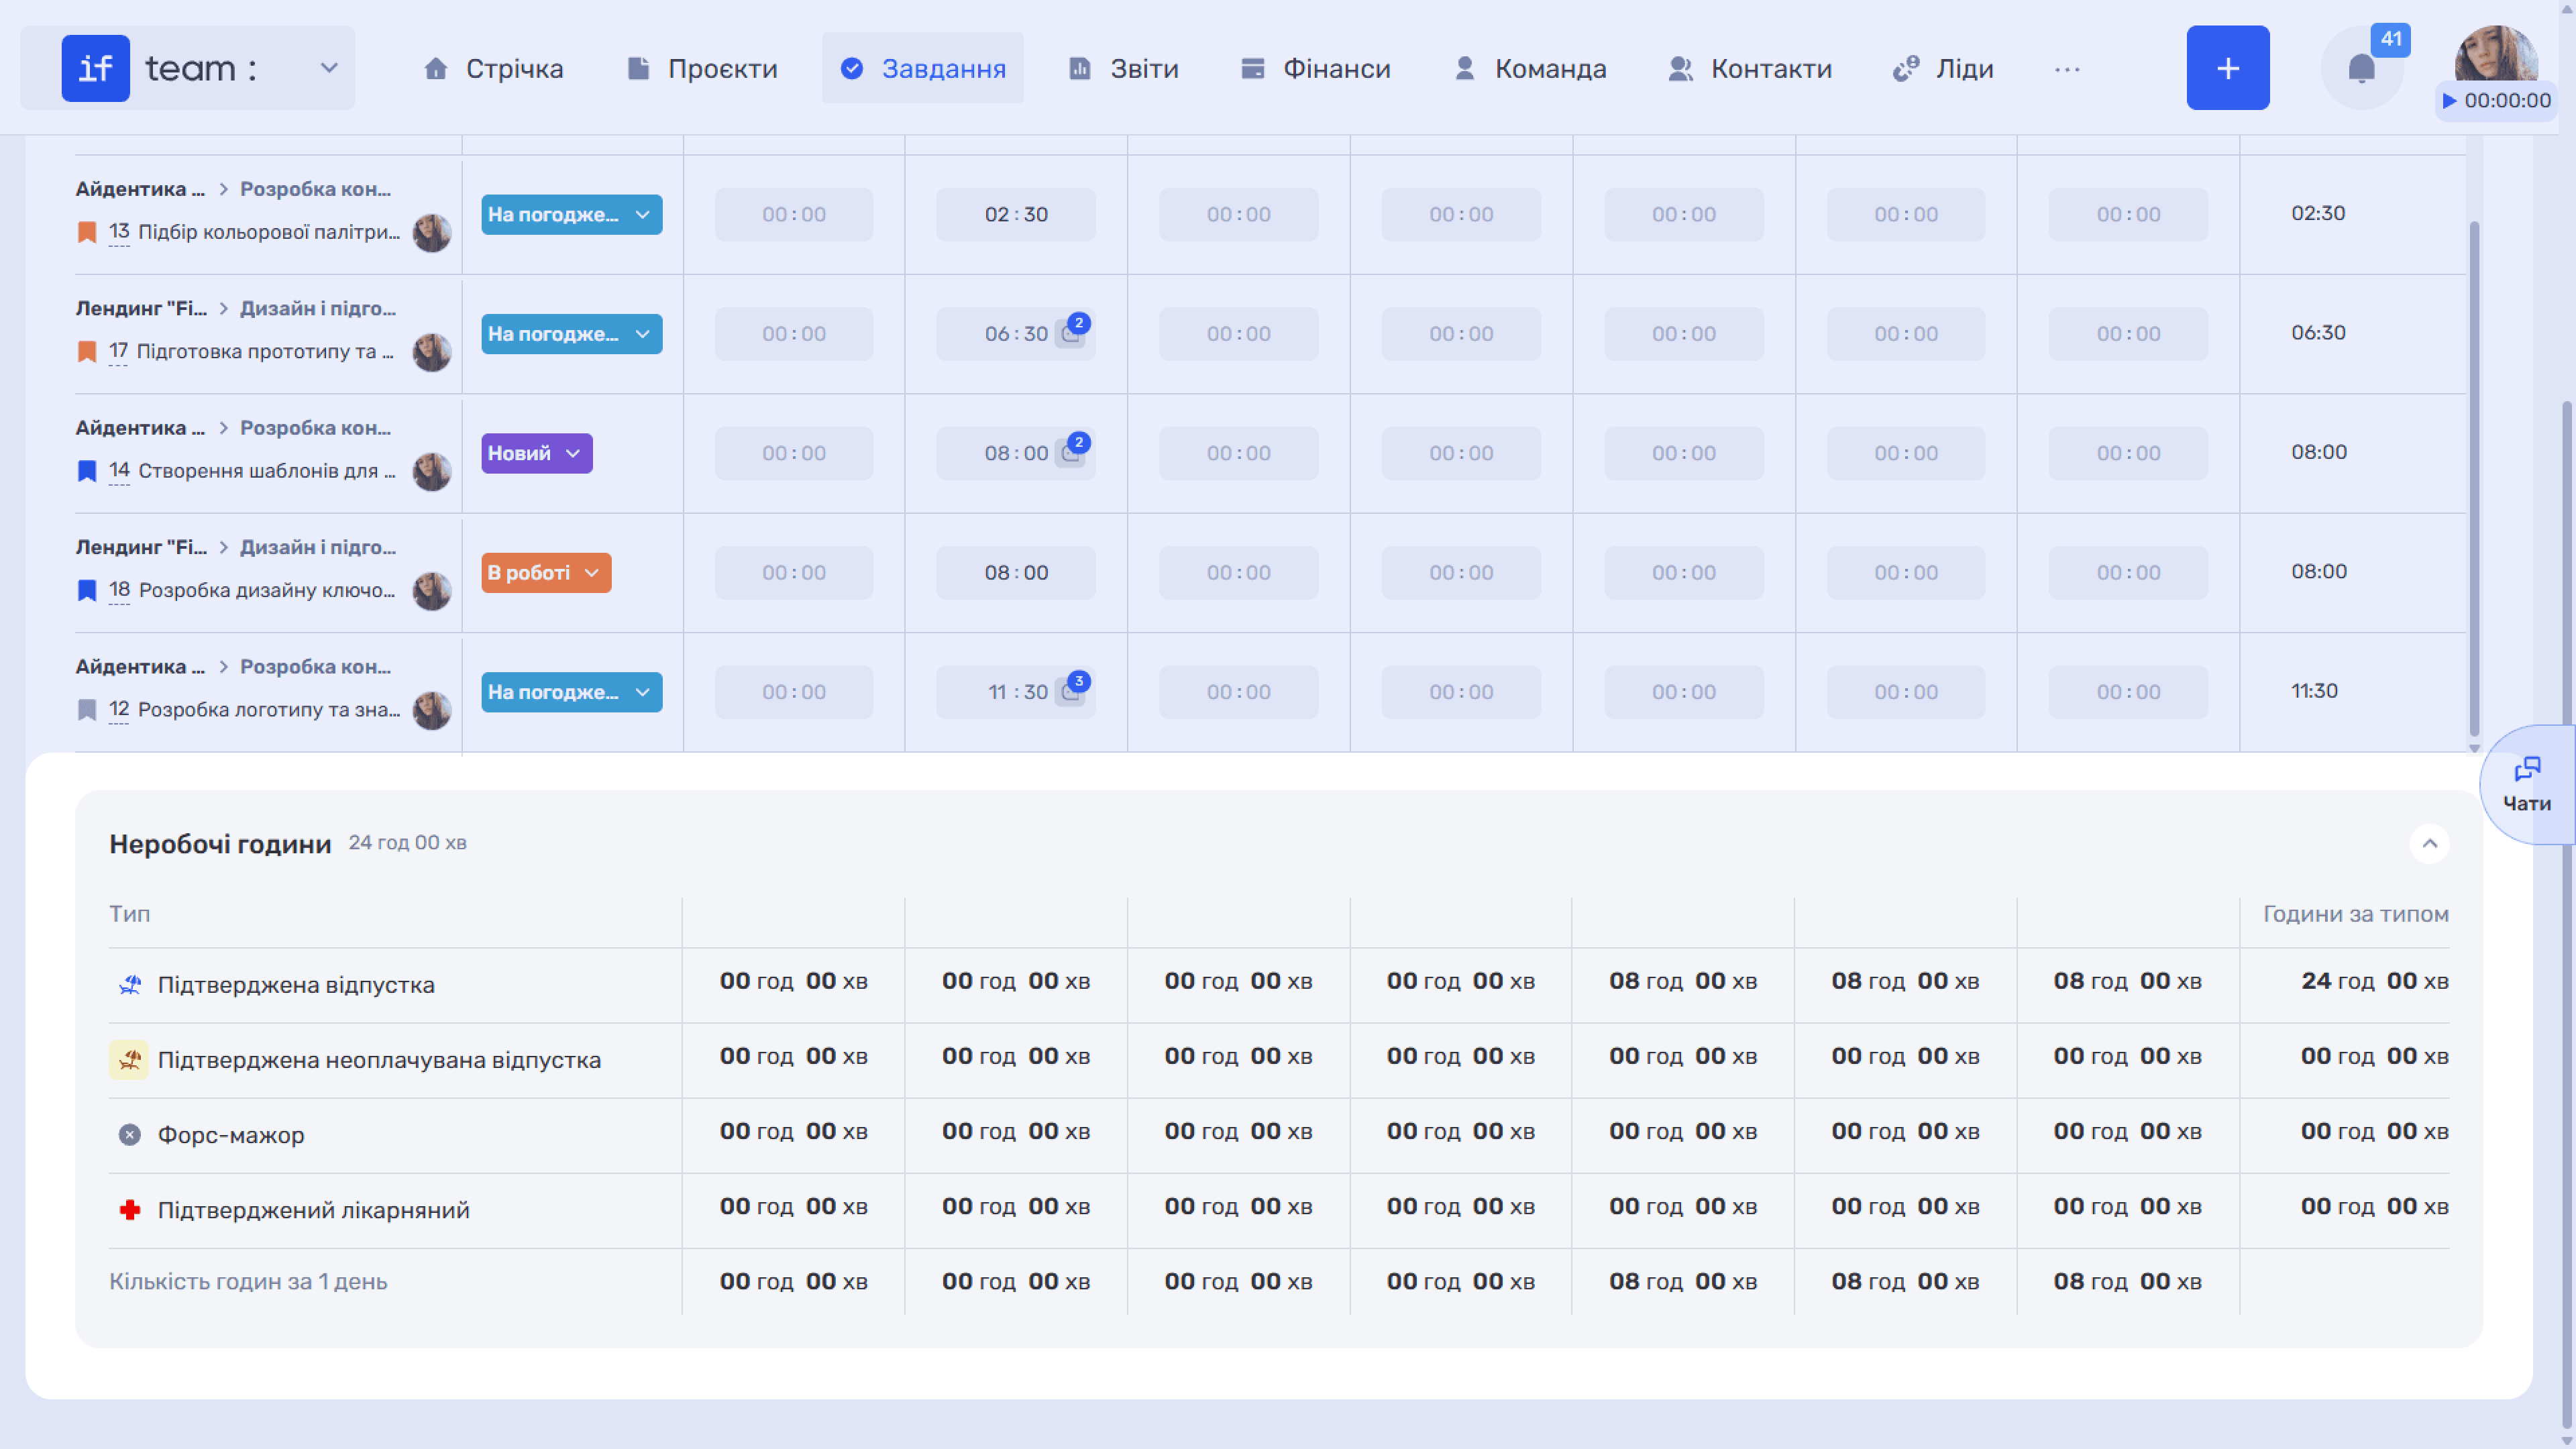
Non-Working Hours
The “Non-Working Hours” section at the bottom of the screen totals time not associated with tasks: approved and unpaid leave, force majeure, and sick leave. Data is shown for each type and each day in the period.
Filtering
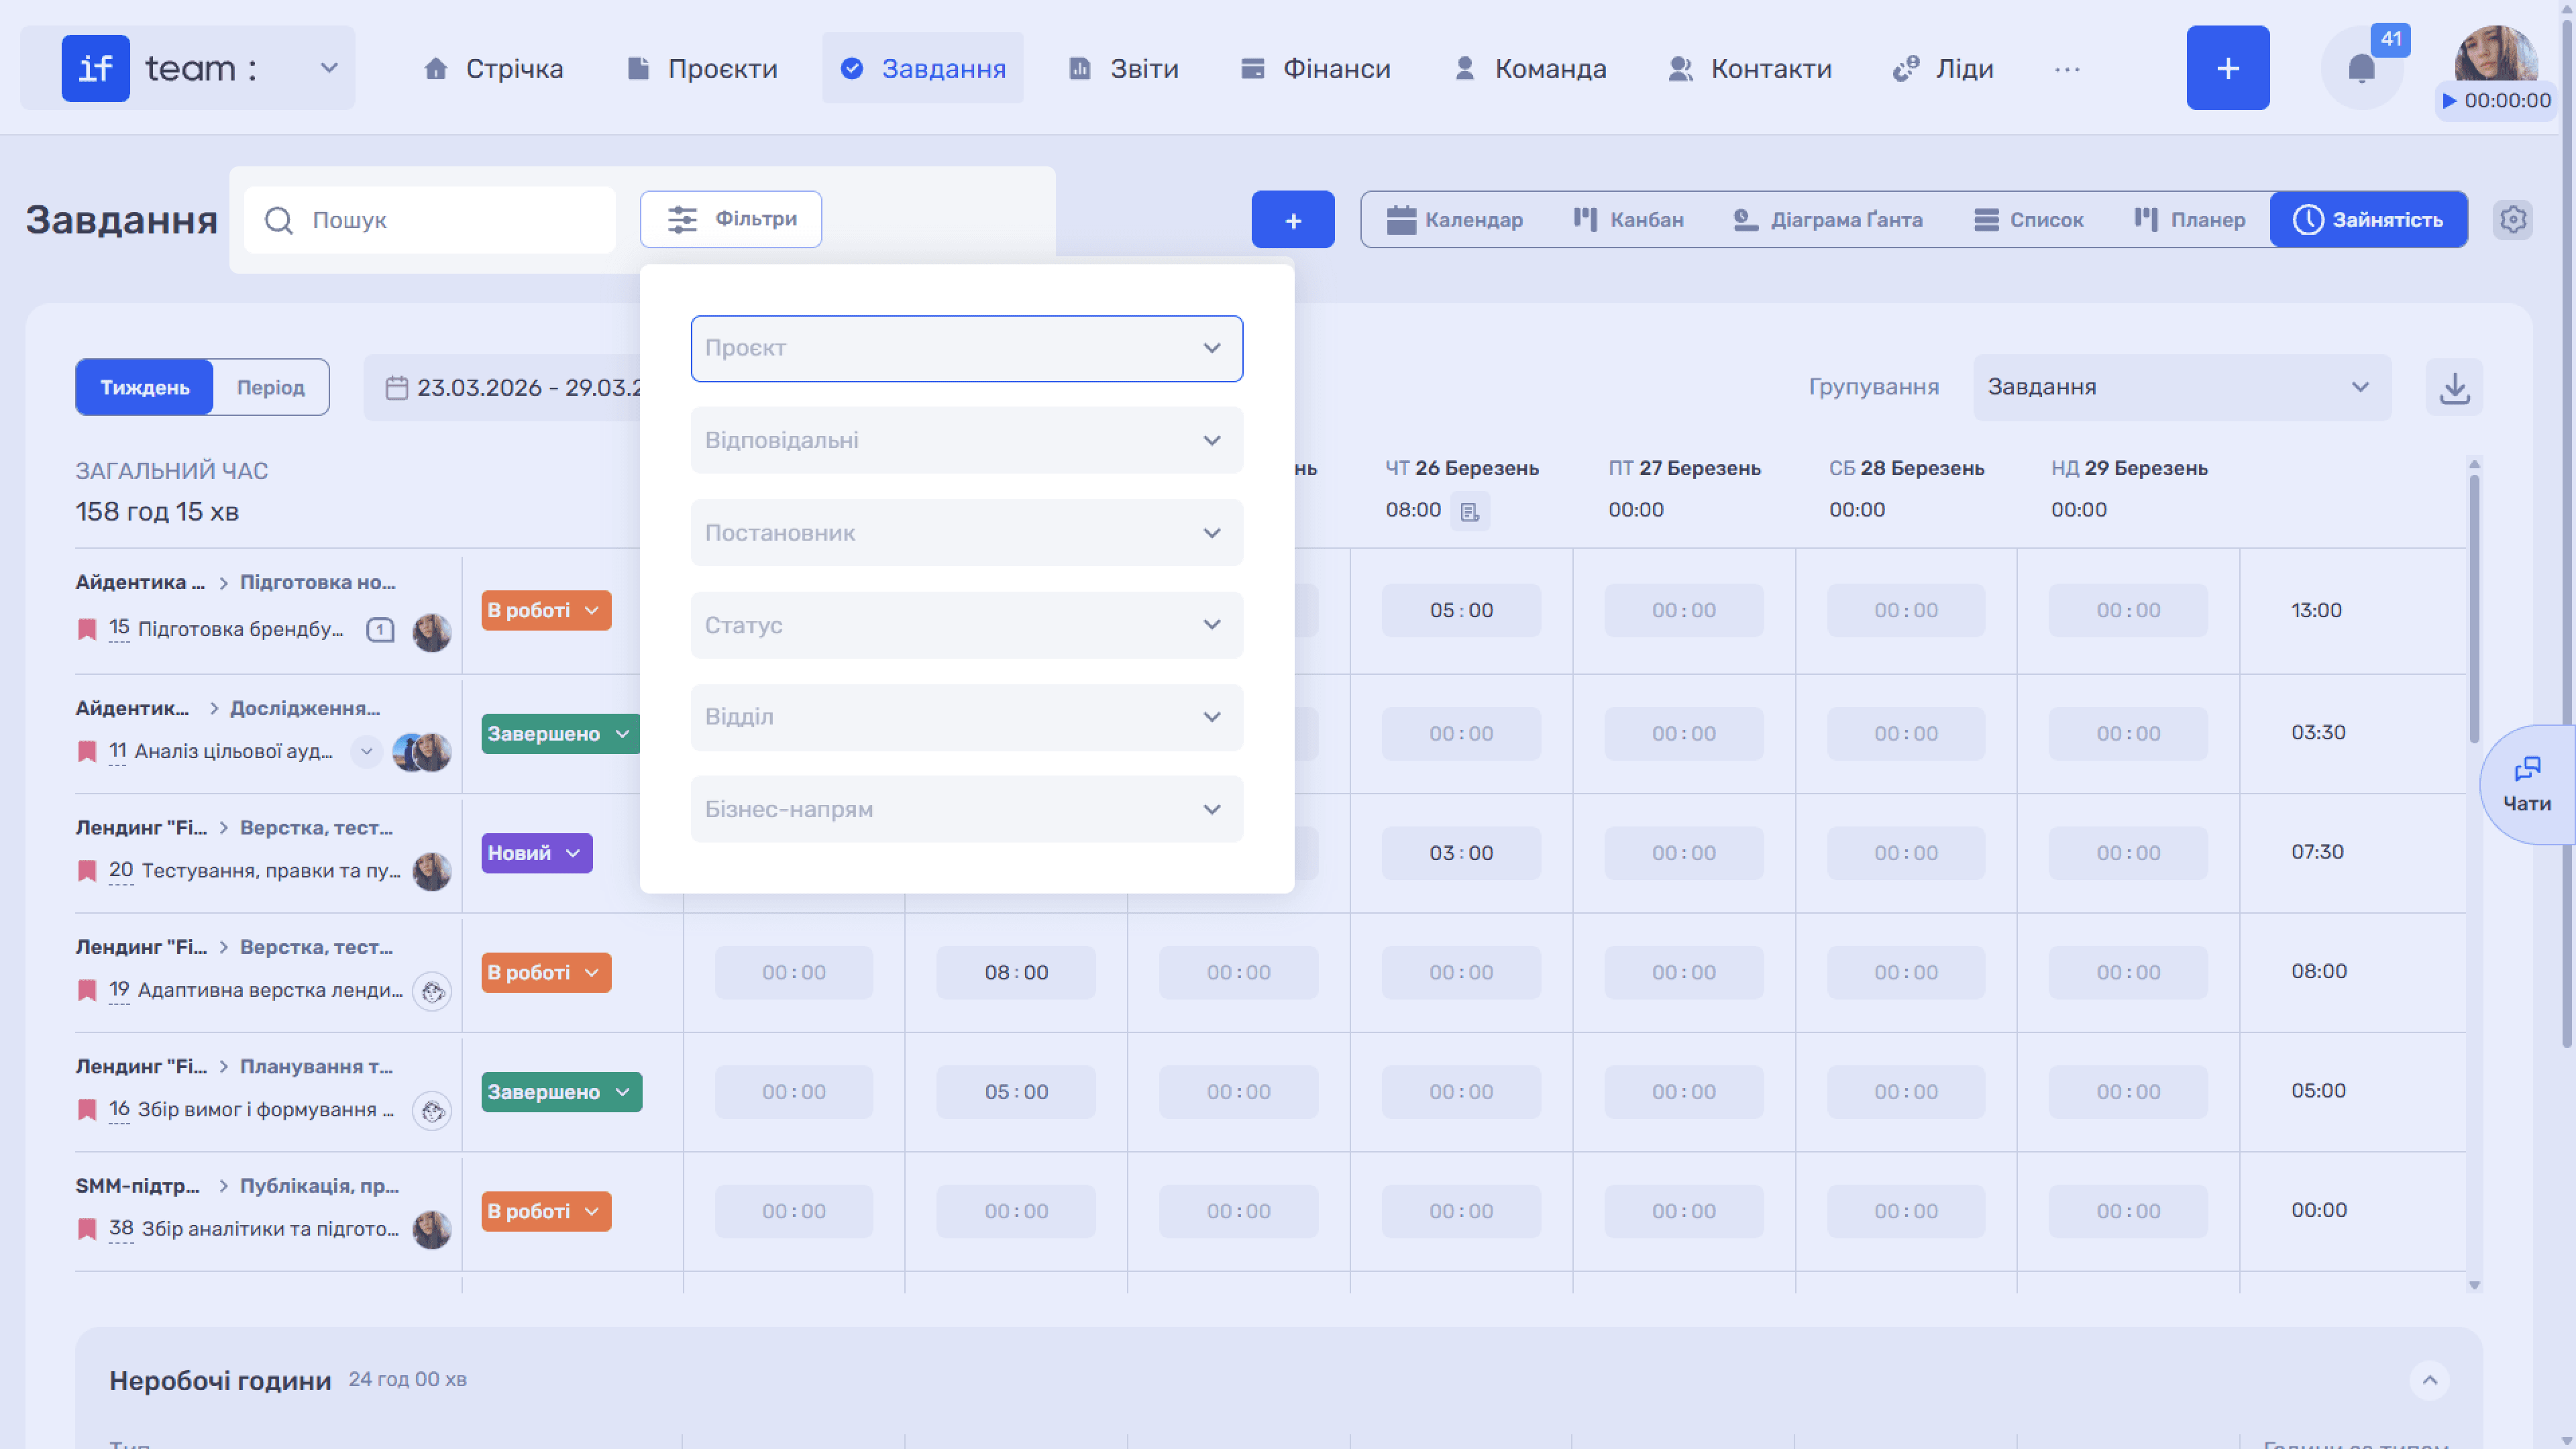
“Workload” has its own set of filters: project, assignees, assigner, status, department, and business line. For details about filters, see Task Filters.
Export
You can download workload data as an Excel file. Click the download icon (⬇) in the upper-right corner of the workspace.
Still have questions?
Maybe we haven't added this information yet. But you can always reach out:
Request a demo
Submit a request and we'll show you how the service works and its capabilities.
Book a demo