Gantt Chart
The Gantt chart visualizes tasks on a timeline as horizontal bars and supports three scales:
Generate AI summary
Open this page in your favorite AI assistant
- “Hours” for a detailed view of a single day;
- “Days” for a weekly overview;
- “Weeks” for broader planning.
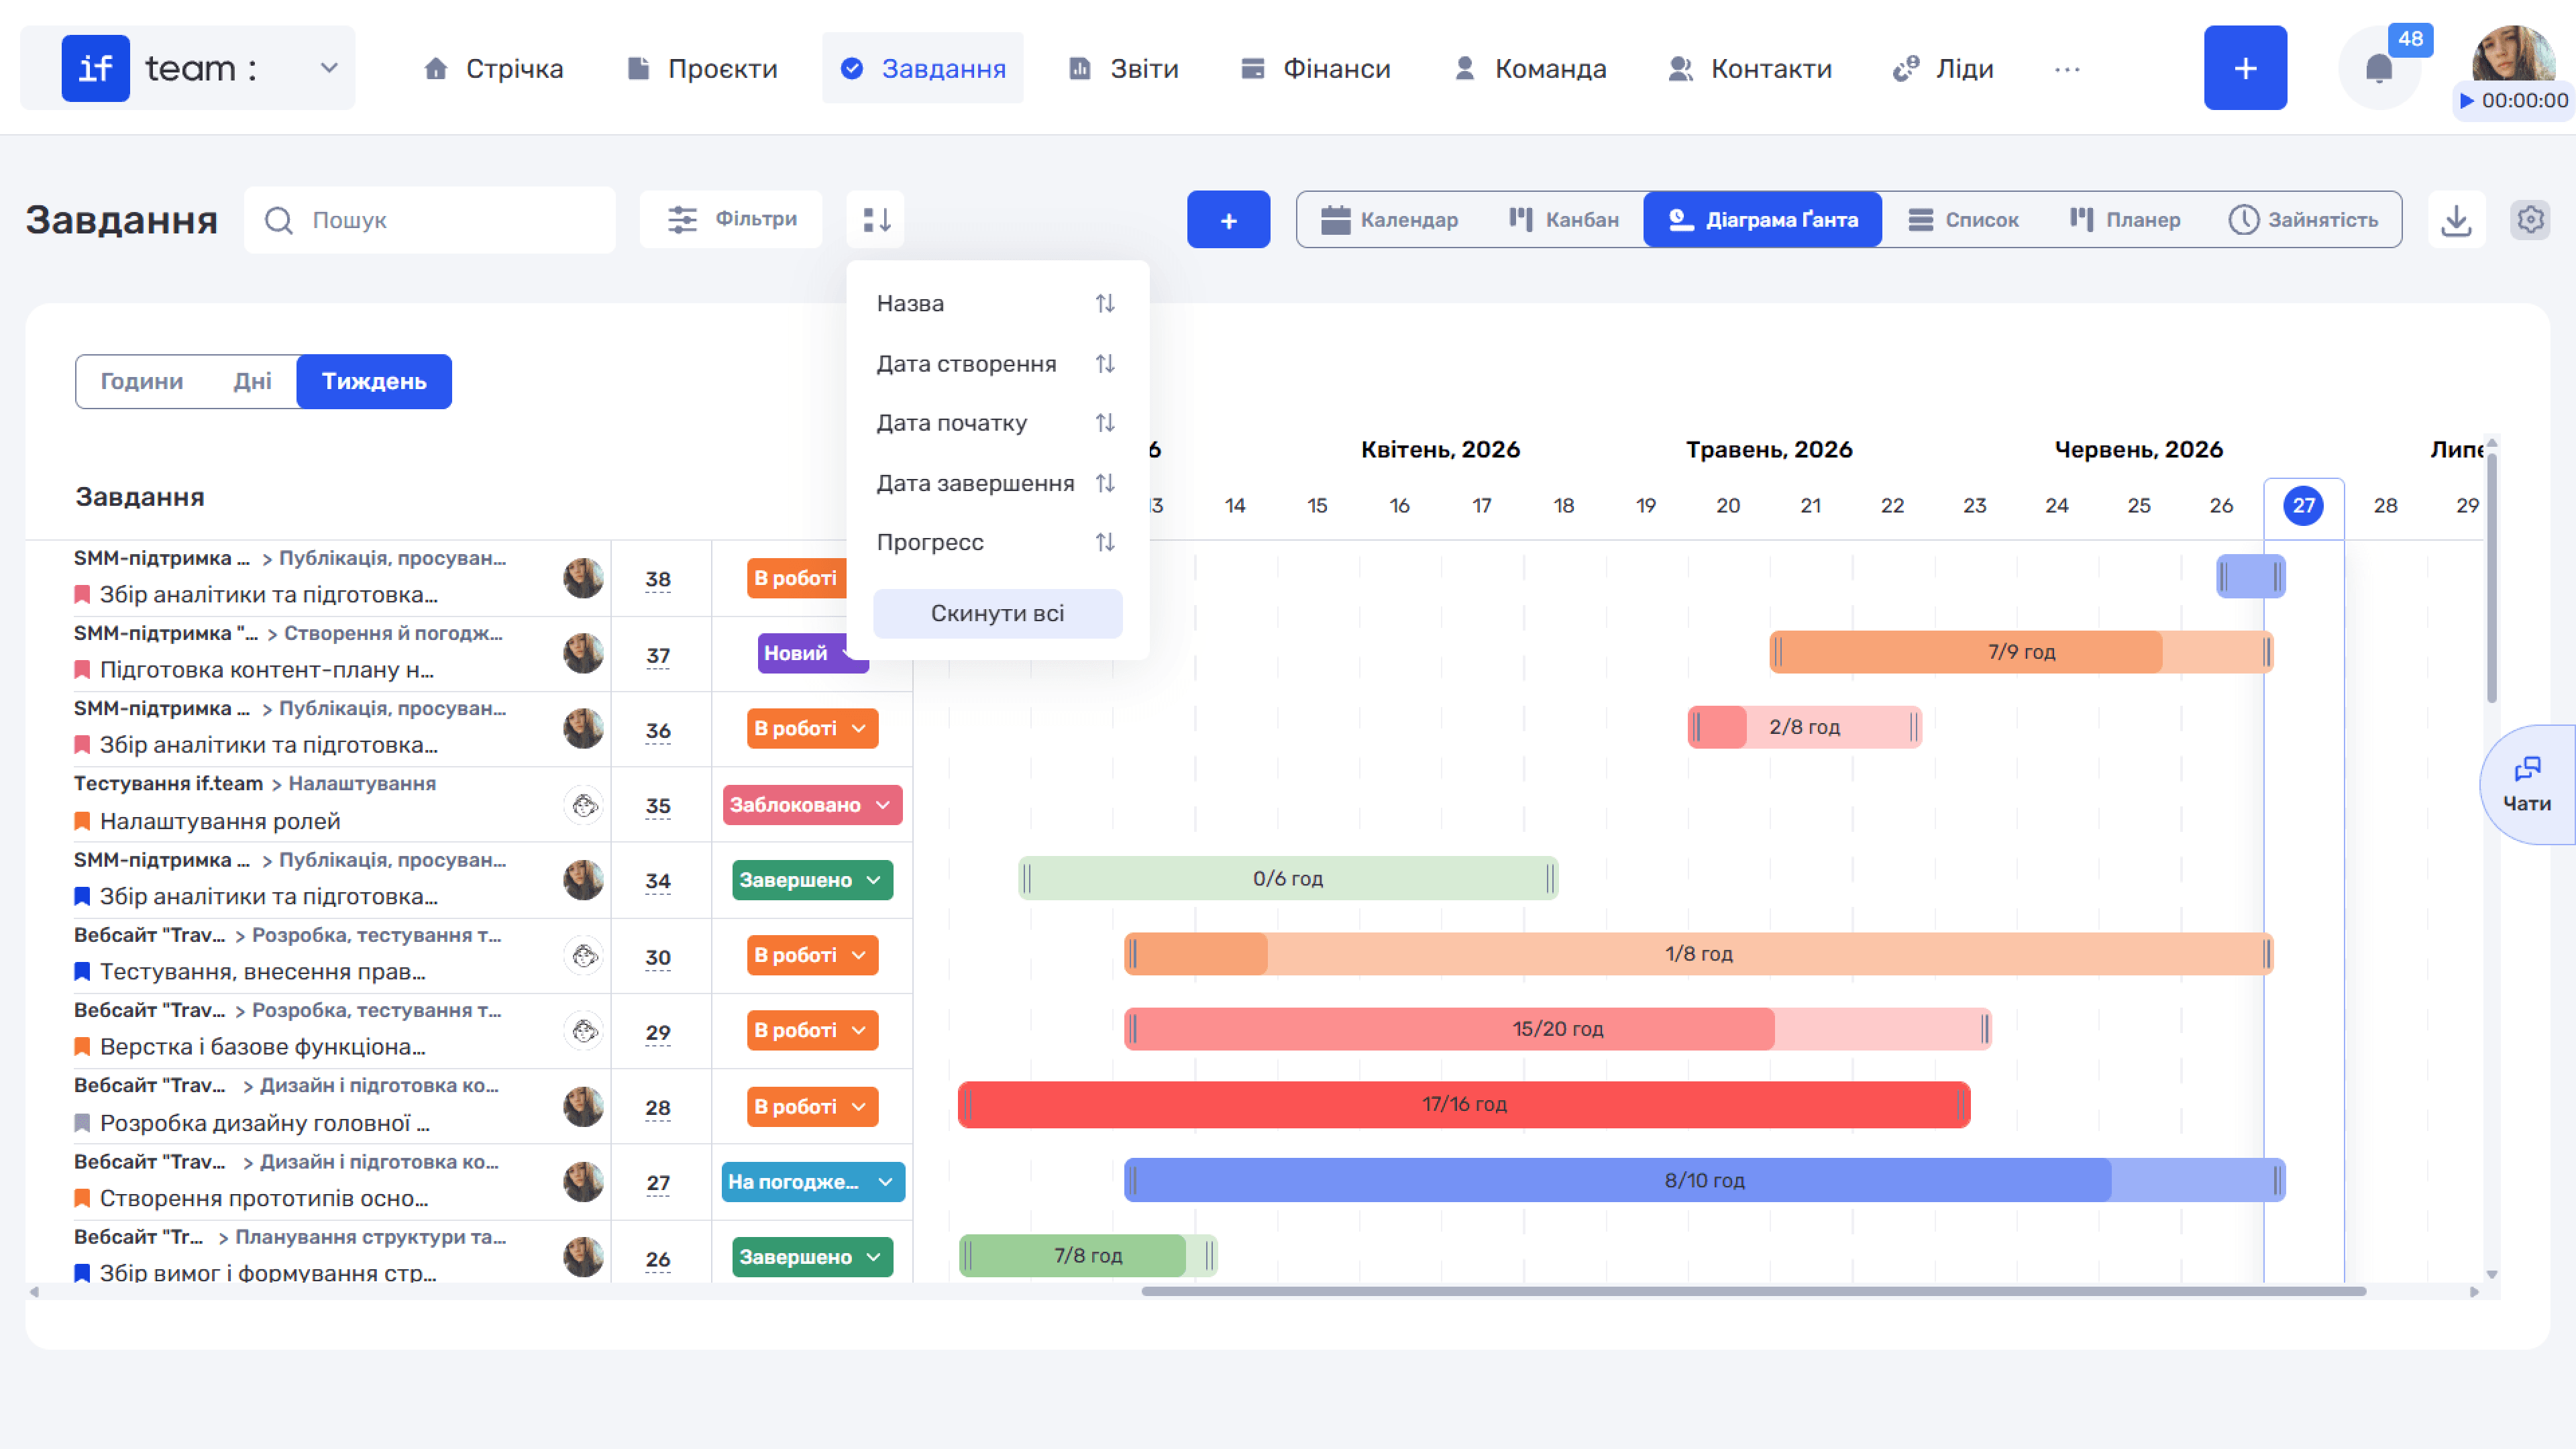
To the left of the chart is a task list showing the task name, project and iteration, as well as the assignee, ID, and status.
Tasks can be sorted by name, dates, and progress. You can also use the mouse to drag or extend the bars on the timeline.
Still have questions?
Maybe we haven't added this information yet. But you can always reach out:
Request a demo
Submit a request and we'll show you how the service works and its capabilities.
Book a demo