
What Is a Gantt Chart? Example, Dependencies and How to Build One
A Gantt chart is a project schedule shown on a timeline. Tasks appear as rows, with horizontal bars marking their start and finish dates. Links between tasks show dependencies: which work must happen before another task can start or finish. The chart helps a team see the sequence, overlap and…
A Gantt chart is a project schedule shown on a timeline. Tasks appear as rows, with horizontal bars marking their start and finish dates. Links between tasks show dependencies: which work must happen before another task can start or finish. The chart helps a team see the sequence, overlap and timing of project work.
An agency promises to launch a website on Friday. The copy is complete and the developer is ready, but the client has not approved the design. That one decision holds up the build, testing and launch. A Gantt chart makes the connection visible so the manager can revise the schedule.
We will use this hypothetical website project to explain how to read a Gantt chart, build a schedule, identify its critical path and manage the work in if.team.
Gantt chart basics: what does it show?
The chart takes its name from Henry Gantt, who developed this approach to scheduling in the early twentieth century. Its simplest form needs only a task list and a time axis. Additional elements depend on the decisions the team needs to make.
| Element | Meaning | What to check |
|---|---|---|
| Task row | A piece of work or project stage | Is the expected result and owner clear? |
| Horizontal bar | The scheduled period | When does the work start and finish? |
| Dependency link | A relationship between tasks | What changes if the preceding work is late? |
| Milestone | A zero-duration event | Has an important point, such as approval, been reached? |
| Progress indicator | Recorded completion | What evidence supports the percentage? |
| Today line | The current date | What should already be complete? |
| Baseline | A saved version of the original schedule | How does the latest forecast differ from the agreement? |
Not every application provides all of these features. In a spreadsheet, colored cells can form the bars, and a separate copy can preserve the original plan.
A bar’s length shows duration, not necessarily hours of effort. A task spanning three days might require six working hours and a wait for feedback. To assess capacity, you also need effort estimates and the person’s availability.
Gantt chart example: a ten-day website project
Our agency is building a small website over ten working days. D1–D10 are consecutive working days, excluding weekends. In this example, a dependent task begins on the next working day after its predecessor finishes.
| ID | Task | Owner | Start | Duration | Finish | Depends on |
|---|---|---|---|---|---|---|
| A | Agree the brief and structure | Project manager and client | D1 | 1 day | D1 | — |
| B | Produce the design | Designer | D2 | 3 days | D4 | A |
| C | Write the copy | Writer | D2 | 2 days | D3 | A |
| D | Approve the design | Client, coordinated by manager | D5 | 1 day | D5 | B |
| E | Build the website | Developer | D6 | 3 days | D8 | C and D |
| F | Test and launch | Developer and tester | D9 | 2 days | D10 | E |
Approval is a one-day task because someone needs time to review and decide. “Design approved” at the end of D5 could also be shown as a milestone. That milestone does not add another day.
Design and copy run in parallel. Development needs both, so it cannot start simply because the copy is finished. It waits until design approval is complete on D5.
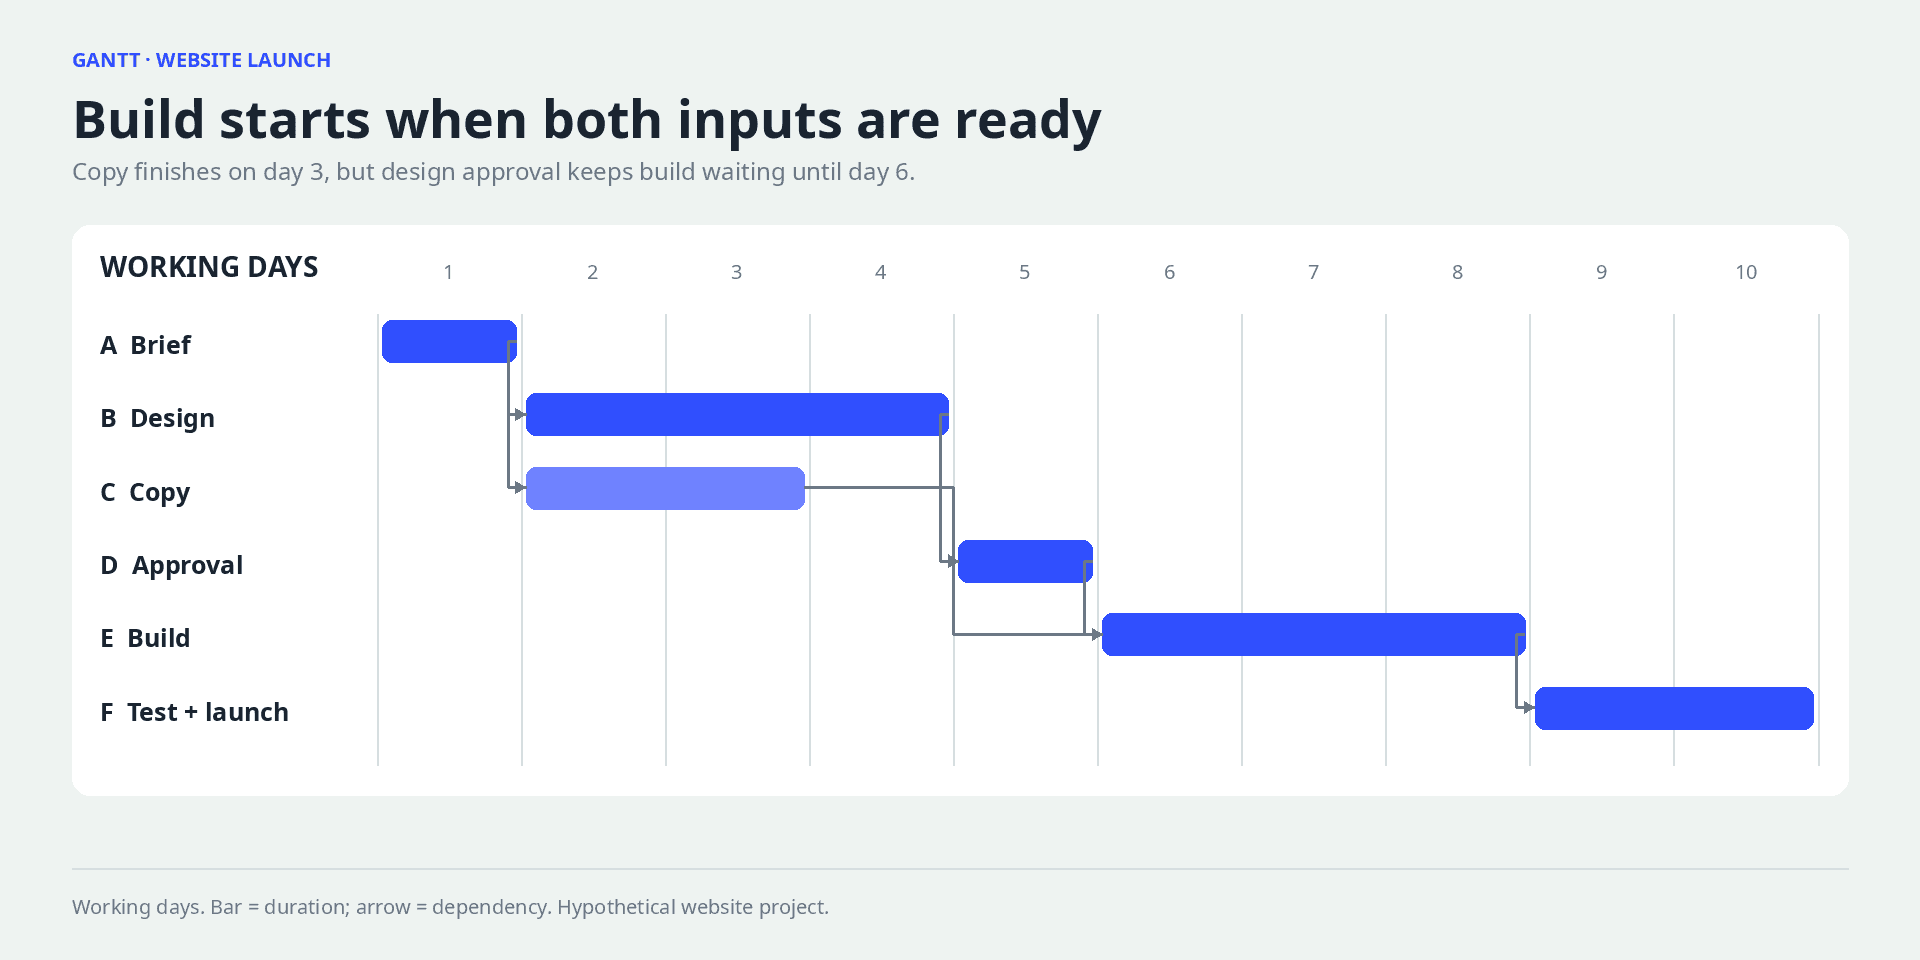
The website build starts only when both copy and design approval are ready.
How to read a Gantt chart
Start at launch on D10 and work backwards. Launch needs the finished build; the build needs both copy and approved design. The chart shows which earlier results determine the finish date.
Now imagine it is D6 and design is still awaiting approval. The build is scheduled to start, but a required decision is missing. The manager needs an updated approval date and a revised schedule for the dependent work.
Finally, inspect overlapping bars and their owners. Different people handle design and copy in this example. If one person did both, you would need to compare the required hours with their availability: independent tasks can still compete for the same working day.
If work repeatedly queues with the same specialist, investigate the business bottleneck. Moving dates shows the scheduling impact; understanding the cause requires comparing incoming work with available capacity.
Finding the critical path
The critical path is the longest-duration chain of dependent work that determines the earliest project finish under the schedule’s assumptions.
Microsoft’s critical path guide explains how task duration and slack affect the finish date. Here is the calculation for our example.
In our example, it is A → B → D → E → F: 1 + 3 + 1 + 3 + 2 = 10 working days. The route through copy, A → C → E → F, totals eight. Copy can finish two working days later than originally planned, by the end of D5, without delaying the D6 development start.
If design approval finishes on D7 rather than D5 and the remaining durations stay the same, launch moves to D12. Keeping D10 would require a real change to scope, delivery method or resources. Moving the bar backwards does not create that change.
This calculation assumes the named people are available and that no other constraints apply. A larger schedule can have more than one critical path. Recalculate after material changes.
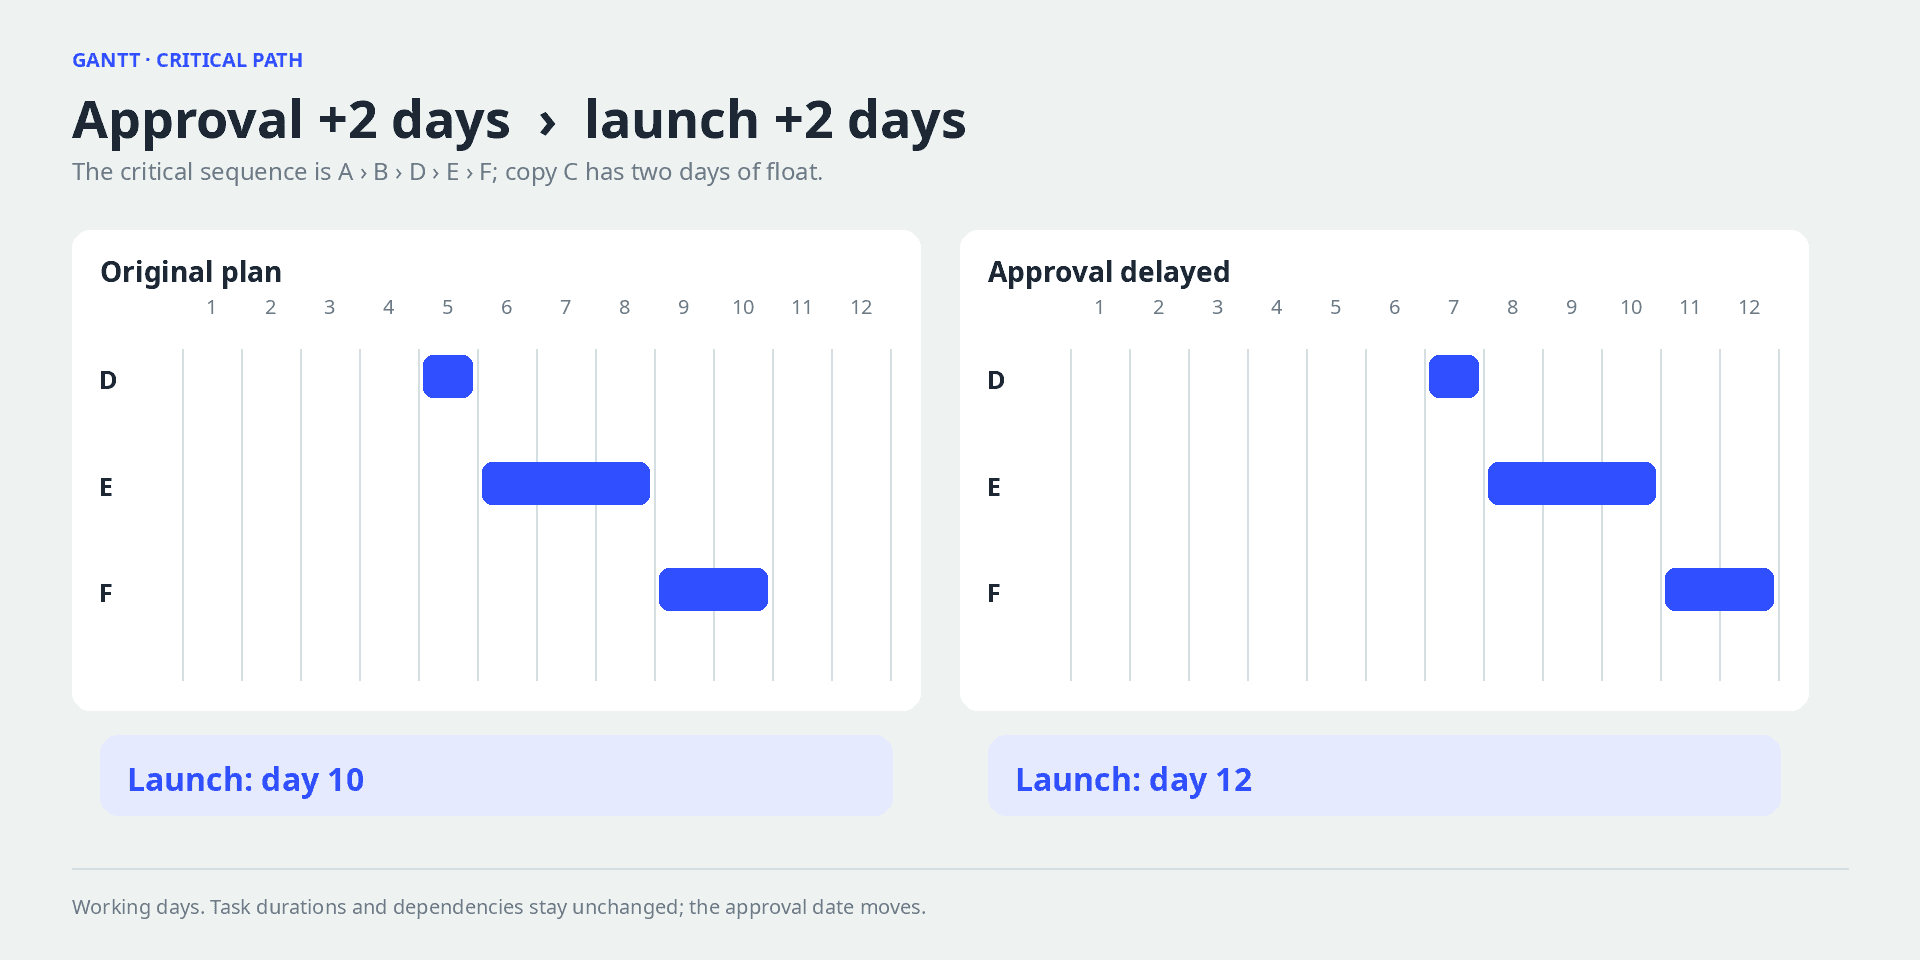
A two-day approval delay moves launch from day 10 to day 12.
How to make a Gantt chart in six steps
The example gives us tasks and durations. For your own project, you need to establish those with the team. Start with the finished result, then identify the work and agreements needed to deliver it.
1. Define the finished result
“Build a website” might mean a design, a working staging site or a published site with client access. Agree on the deliverable, the person accepting it and the acceptance criteria.
For our example: the site is live, its forms have been checked and the client has access. That definition makes testing and handover visible in the plan.
2. Break the work into manageable tasks
Use a separate task where work has its own result, owner or deadline. Small checks can remain in a checklist rather than becoming dozens of bars on the main chart.
Conversely, a month-long “Development” bar may hide every important handover. Choose a level at which a manager can see decisions likely to affect delivery.
3. Estimate duration with the people doing the work
Ask about effort and elapsed time separately. Six design hours do not guarantee a finished design today if the designer has other commitments.
Include external responses. The client in our example has agreed to review within one working day. Without that agreement, a one-day approval bar conceals uncertainty instead of resolving it.
4. Add genuine dependencies
For each task, ask what must be available before it can proceed. The developer needs approved design and copy. The designer does not necessarily need finished copy if the structure and content length are already agreed.
Avoid linking every task into one chain simply to keep the chart orderly. That can conceal opportunities for parallel work and extend the schedule unnecessarily.
5. Check people and calendars
Account for leave, weekends and work on other projects. If one person is assigned two full-time tasks at once, revise the dates or staffing.
Add explicit allowances for relevant risks, such as a review before handover. Explain what an allowance covers. Hidden padding in every estimate is difficult to manage and may still miss the real risk.
6. Save the baseline and update the forecast
Preserve the agreed schedule. Update the working forecast when new information arrives and record why: added scope, an unavailable specialist or a failed check.
A forecast and an agreed deadline are different records. Automatic rescheduling can calculate new task dates; it does not obtain the client’s agreement to a later delivery.
Estimate task duration and check resource availability
Dependencies tell you which work can begin. Calendars and assignments tell you when it can actually happen. Check those layers separately: first the sequence of deliverables, then the people available to produce them.
Turn effort into a realistic schedule
Suppose design requires eighteen hours. At six available project hours per day, it takes three working days. At three hours per day, it takes six. The effort estimate is unchanged, but the bar is twice as long.
Do not automatically divide hours by eight. Meetings, support for other projects and agreed internal work use part of the day. Ask the assignee what time is available across the whole period. A free Monday does not imply an equally free Tuesday.
For work involving external responses, separate the components. An editor may need three hours to make changes but cannot start until the client answers a question. Record the required answer, the editing work and the next review. The manager can then see which decision would bring completion forward.
Resolve conflicts between parallel tasks
In the original example, different people handle design B and copy C, so the work runs in parallel. Now consider a different staffing scenario: one specialist must do both, and each task requires their full working day throughout its stated duration.
If the specialist completes design on days 2–4, copy moves to days 5–6. The client can approve design on day 5 while the specialist writes. Build E nevertheless waits until day 7 because it needs both outputs. Build runs on days 7–9, followed by testing and launch on days 10–11. The ten-working-day schedule becomes eleven.
This is a separate scenario, not a change to the assumptions in the original table. It demonstrates why independent tasks cannot always run concurrently. Adjusting assignments or dates to resolve overallocated resources is called resource leveling; Microsoft’s guide explains the principle. Whether the adjustment is automatic depends on the software.
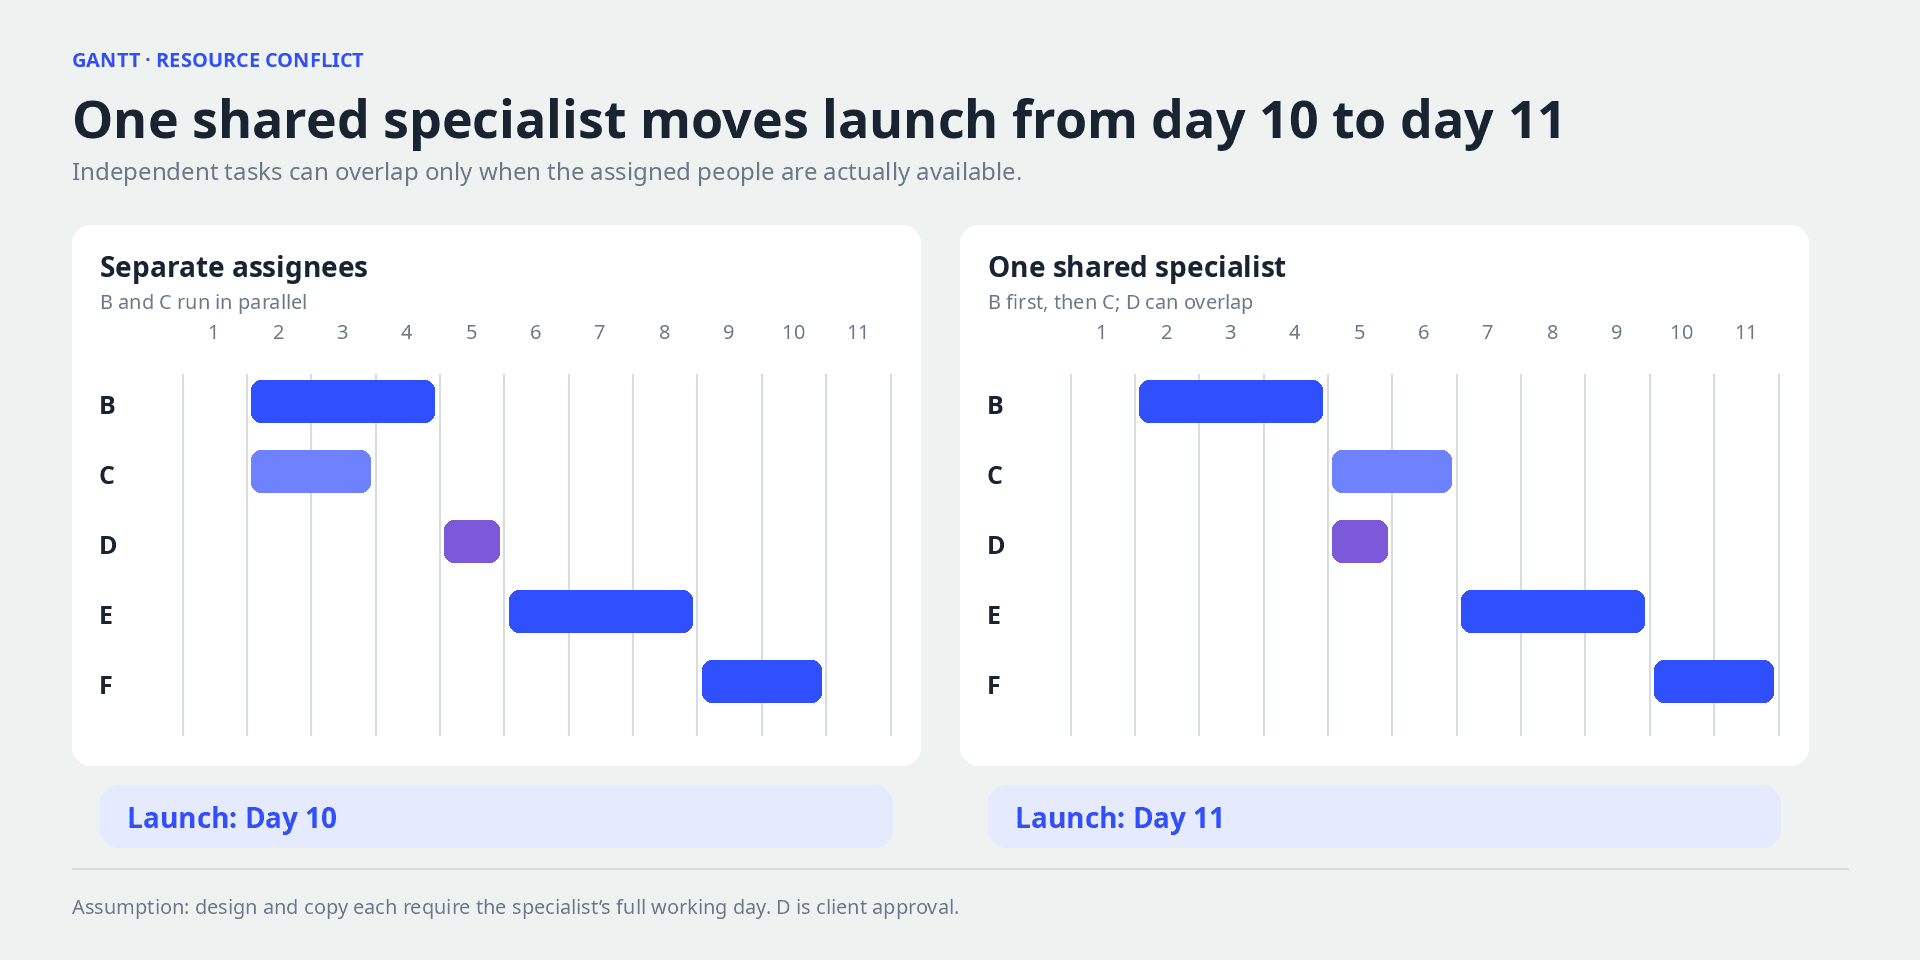
Assigning both design and copy to one fully occupied person moves launch from day 10 to day 11.
Distinguish float from extra work and contingency
Copy C has two days of float in the original schedule because build already waits for approval through day 5. Those two days are a consequence of the dependency network. They do not represent two extra days of writing effort.
Testing and corrections are different. If the team expects to check forms and fix defects before launch, include that work in the plan. Hiding it inside every estimate makes it harder to identify who will perform it and when.
For an uncertain event, the team can agree on a visible contingency allowance and a rule for using it. A presentation might have an extra day before the external meeting for changes discovered during rehearsal. Name the risk, the allowance and the person who decides how to use it.
Do not spend the same float twice. If two decisions both rely on copy’s two-day allowance, consider their combined effect. After any change, review the remaining float under the new schedule rather than carrying the original number forward.
Check client and contractor calendars
A Monday-to-Friday team may work with a client observing different holidays. A one-day approval submitted before the client’s holiday will not follow the delivery team’s calendar. Agree on an actual response date and time zone for external decisions.
Check the conditions for supplier handovers too. “Files ready” may mean they have been uploaded, while a printer also needs payment and confirmation of technical specifications. If these are prerequisites for starting the next activity, make them visible in the task or schedule.
How to build a Gantt chart template in Excel or Google Sheets
A small schedule can start in a spreadsheet. Set up these columns: A for ID, B for task, C for owner, D for start, E for duration in working days, F for finish and G for predecessor. Place calendar dates across row 1, starting in H1.
Copy the six tasks from the example. Use actual spreadsheet dates in the start and finish columns; D1–D10 in the example are day labels, not cell references.
Put the headers in row 1 and tasks A–F in rows 2–7. Enter durations as numbers in column E: 1, 3, 2, 1, 3, 2. In D2, enter the first working date.
For a Monday-to-Friday calendar without additional holidays, enter this formula in F2 and fill it down to F7:
=WORKDAY(D2,E2-1)
The subtraction includes the start day in the duration. A one-day task starting on Monday finishes on Monday. Use the holiday argument or WORKDAY.INTL where the working calendar differs.
Apply this custom conditional-formatting rule to H2:AK7:
=AND(H$1>=$D2,H$1<=$F2,WEEKDAY(H$1,2)<=5)
It colors weekdays between the start and finish. Some spreadsheet locales require semicolons instead of commas or display localized function names.
Next, enter the start-date formulas in column D:
| Cell | Task | Formula |
|---|---|---|
| D3 | Design | =WORKDAY(F2,1) |
| D4 | Copy | =WORKDAY(F2,1) |
| D5 | Design approval | =WORKDAY(F3,1) |
| D6 | Build | =WORKDAY(MAX(F4,F5),1) |
| D7 | Test and launch | =WORKDAY(F6,1) |
D6 uses the later of copy completion and design approval. Increase the approval duration in E5 from one day to three. Launch should move from the tenth to the twelfth working day.
Column G records the dependency for the reader. The formulas calculate dates using specific rows; review those references if you restructure the table or change the dependencies.
A spreadsheet is useful while the schedule is small and one person maintains it. Multiple calendars, projects and dependency chains introduce more formula maintenance and more opportunities for inconsistent edits.
Gantt chart dependencies: four common types
Scheduling uses four basic relationships. Microsoft Project’s dependency guide explains the model.
| Type | Rule | Example |
|---|---|---|
| Finish-to-start, FS | A successor cannot start until its predecessor finishes | Build begins after design approval |
| Start-to-start, SS | A successor cannot start before its predecessor starts | Launch monitoring starts no earlier than the launch |
| Finish-to-finish, FF | A successor cannot finish before its predecessor finishes | The final test report cannot close before testing ends |
| Start-to-finish, SF | A successor cannot finish until its predecessor starts | An outgoing shift stays on duty until the incoming shift begins |
FS is sufficient for our example. Use the other types only when they represent the real handover.
These four types describe how task starts and finishes are linked. In if.team, hard and soft dependencies describe whether linked dates move automatically. Check the relationship types you need in the documentation or during a demo.
How to update a Gantt chart during delivery
A schedule remains useful while the team can explain its dates. Agree when assignees update remaining work, who reviews dependencies and who approves a changed external commitment.
Keep the baseline, actual dates and forecast separate
The baseline is the agreed schedule at the start of execution. Actuals describe work and dates already known. The forecast is the current estimate of when the remaining work will finish. Replacing the baseline every week removes the comparison that would reveal slippage.
In a spreadsheet, keep separate columns for original finish, current forecast and actual finish, or preserve an agreed copy. Microsoft’s baseline guide describes the general planning practice. This does not imply a dedicated baseline feature in if.team.
Record the decision alongside the cause. “Approval delayed” describes an event. “Client response due on day 7; developer available on days 8–10; proposed launch on day 12 awaiting agreement” tells the team what to do next.
When scope changes substantially, the team may agree on a revised baseline. Keep the earlier version and the reason for the change. Otherwise, a schedule can appear perfectly on track simply because the target keeps moving.
Update remaining work, not just a percentage
“80% complete” could mean hours consumed, pages delivered or an assignee’s judgment. Agree on the meaning before using it to forecast completion.
For the build task, ask which pages are ready, which checks remain, what is blocking progress and how much working time is still needed. Two days spent on a three-day estimate do not prove that one day remains. An unexpected integration may require three more.
Record actual completion only when the agreed acceptance conditions are met. Work that is almost finished but still needs access or acceptance can continue to block the next task.
A useful update changes a decision. If nothing in the next handover, remaining estimate or completion date changes, avoid turning the review into a recital of percentages.
Compare options when the deadline is at risk
Return to the approval delay from day 5 to day 7. Under the unchanged schedule, launch moves to day 12. To discuss whether day 10 is still achievable, prepare distinct options:
| Option | What changes | What to check |
|---|---|---|
| Move the launch | Agree day 12 instead of day 10 | Effects on the campaign, payments and other teams |
| Reduce the first release | Defer part of the agreed scope | Whether the removed work actually shortens the critical activities |
| Start part of the build earlier | Separate approved components from unresolved design | Rework exposure if the remaining design changes |
| Add an assignee | Divide work between people | Whether onboarding, coordination and indivisible tasks absorb the time saved |
None of these automatically recovers two days. If build includes a sequential configuration step, a second developer may not halve its duration. Check the actual activities before changing the bars.
Testing is not a free reserve of days. Name the checks that remain and the consequences of deferring others. The client needs a choice between understandable delivery options, not a date obtained by dragging a rectangle backwards.
Gantt chart vs Kanban: when to use each view
Our Kanban board guide explains how to organize statuses and follow work through them. Use the question you need to answer to choose a view.
| Question | Useful view | What it makes visible |
|---|---|---|
| When can the project finish? | Gantt chart | Dates and dependencies |
| Where is work waiting? | Kanban board | Flow through statuses |
| What is this person doing today? | Calendar | Daily commitments and overlaps |
| How many hours were spent? | Timesheet or time report | Recorded effort |
These views can describe the same tasks. Avoid maintaining separate, conflicting versions of the work.
A Gantt chart is not limited to a fully fixed plan. A team can use it for near-term dependencies while refining later work as it learns. The chart should represent what is currently known rather than imply certainty the project does not have.
Common Gantt chart mistakes and limitations
Too much detail for the audience
A client may need stages, acceptance points and their own response dates. An assignee needs tasks and conditions for starting them. Hundreds of tiny rows can hide the decision each reader needs to make.
Keep one agreed set of work, but choose the relevant level of detail. Discuss stages and deliverables with the client while keeping preparatory checks in the tasks. A separate presentation schedule creates another document that must be updated and can contradict the working plan.
Fixing every task to a manual date
Fixed dates are useful when they represent a real constraint: an event, access to a site or an agreed launch window. If every task has a fixed date, the chart may stop reflecting dependencies. Earlier work slips, while the successor still appears to start yesterday.
Record the reason for each date constraint. Update dates that are forecasts when predecessors change. Where a date represents an external commitment, make the conflict visible and ask for a decision.
Making distant work look more certain than it is
At the start of a large engagement, a team may understand the next two weeks well and the next three months only roughly. A detailed schedule of every future task creates maintenance work around uncertain assumptions.
Plan near-term work in detail and later work as stages with explicit assumptions. Before the next stage starts, refine its tasks, estimates and dependencies. This supports iterative delivery while retaining a shared view of major handovers.
The chart should also show where information is needed. “Choose an integration provider” may be a decision required before an estimate becomes reliable. Leaving that uncertainty visible is more useful than choosing a precise date without a basis.
Using bars to judge individual productivity
A long bar can represent waiting, limited project availability or complex work. A short bar can represent a simple repeated task. Bar length alone cannot compare two people’s contribution.
Review outputs, effort, complexity and causes of delay. A Gantt chart primarily describes the schedule. For delivery cost, use logged hours, internal rates and the financial plan.
A final check before approving the schedule
Trace the plan backwards from the finished result. For every handover, identify its predecessor, owner and acceptance condition. Then check calendars and parallel assignments.
Ask assignees to confirm near-term dates and clients to confirm their decision dates. Mark assumptions, preserve the agreed version and set the next review. This turns the chart into an agreement the team can inspect and revise together.
Using an online Gantt chart in if.team
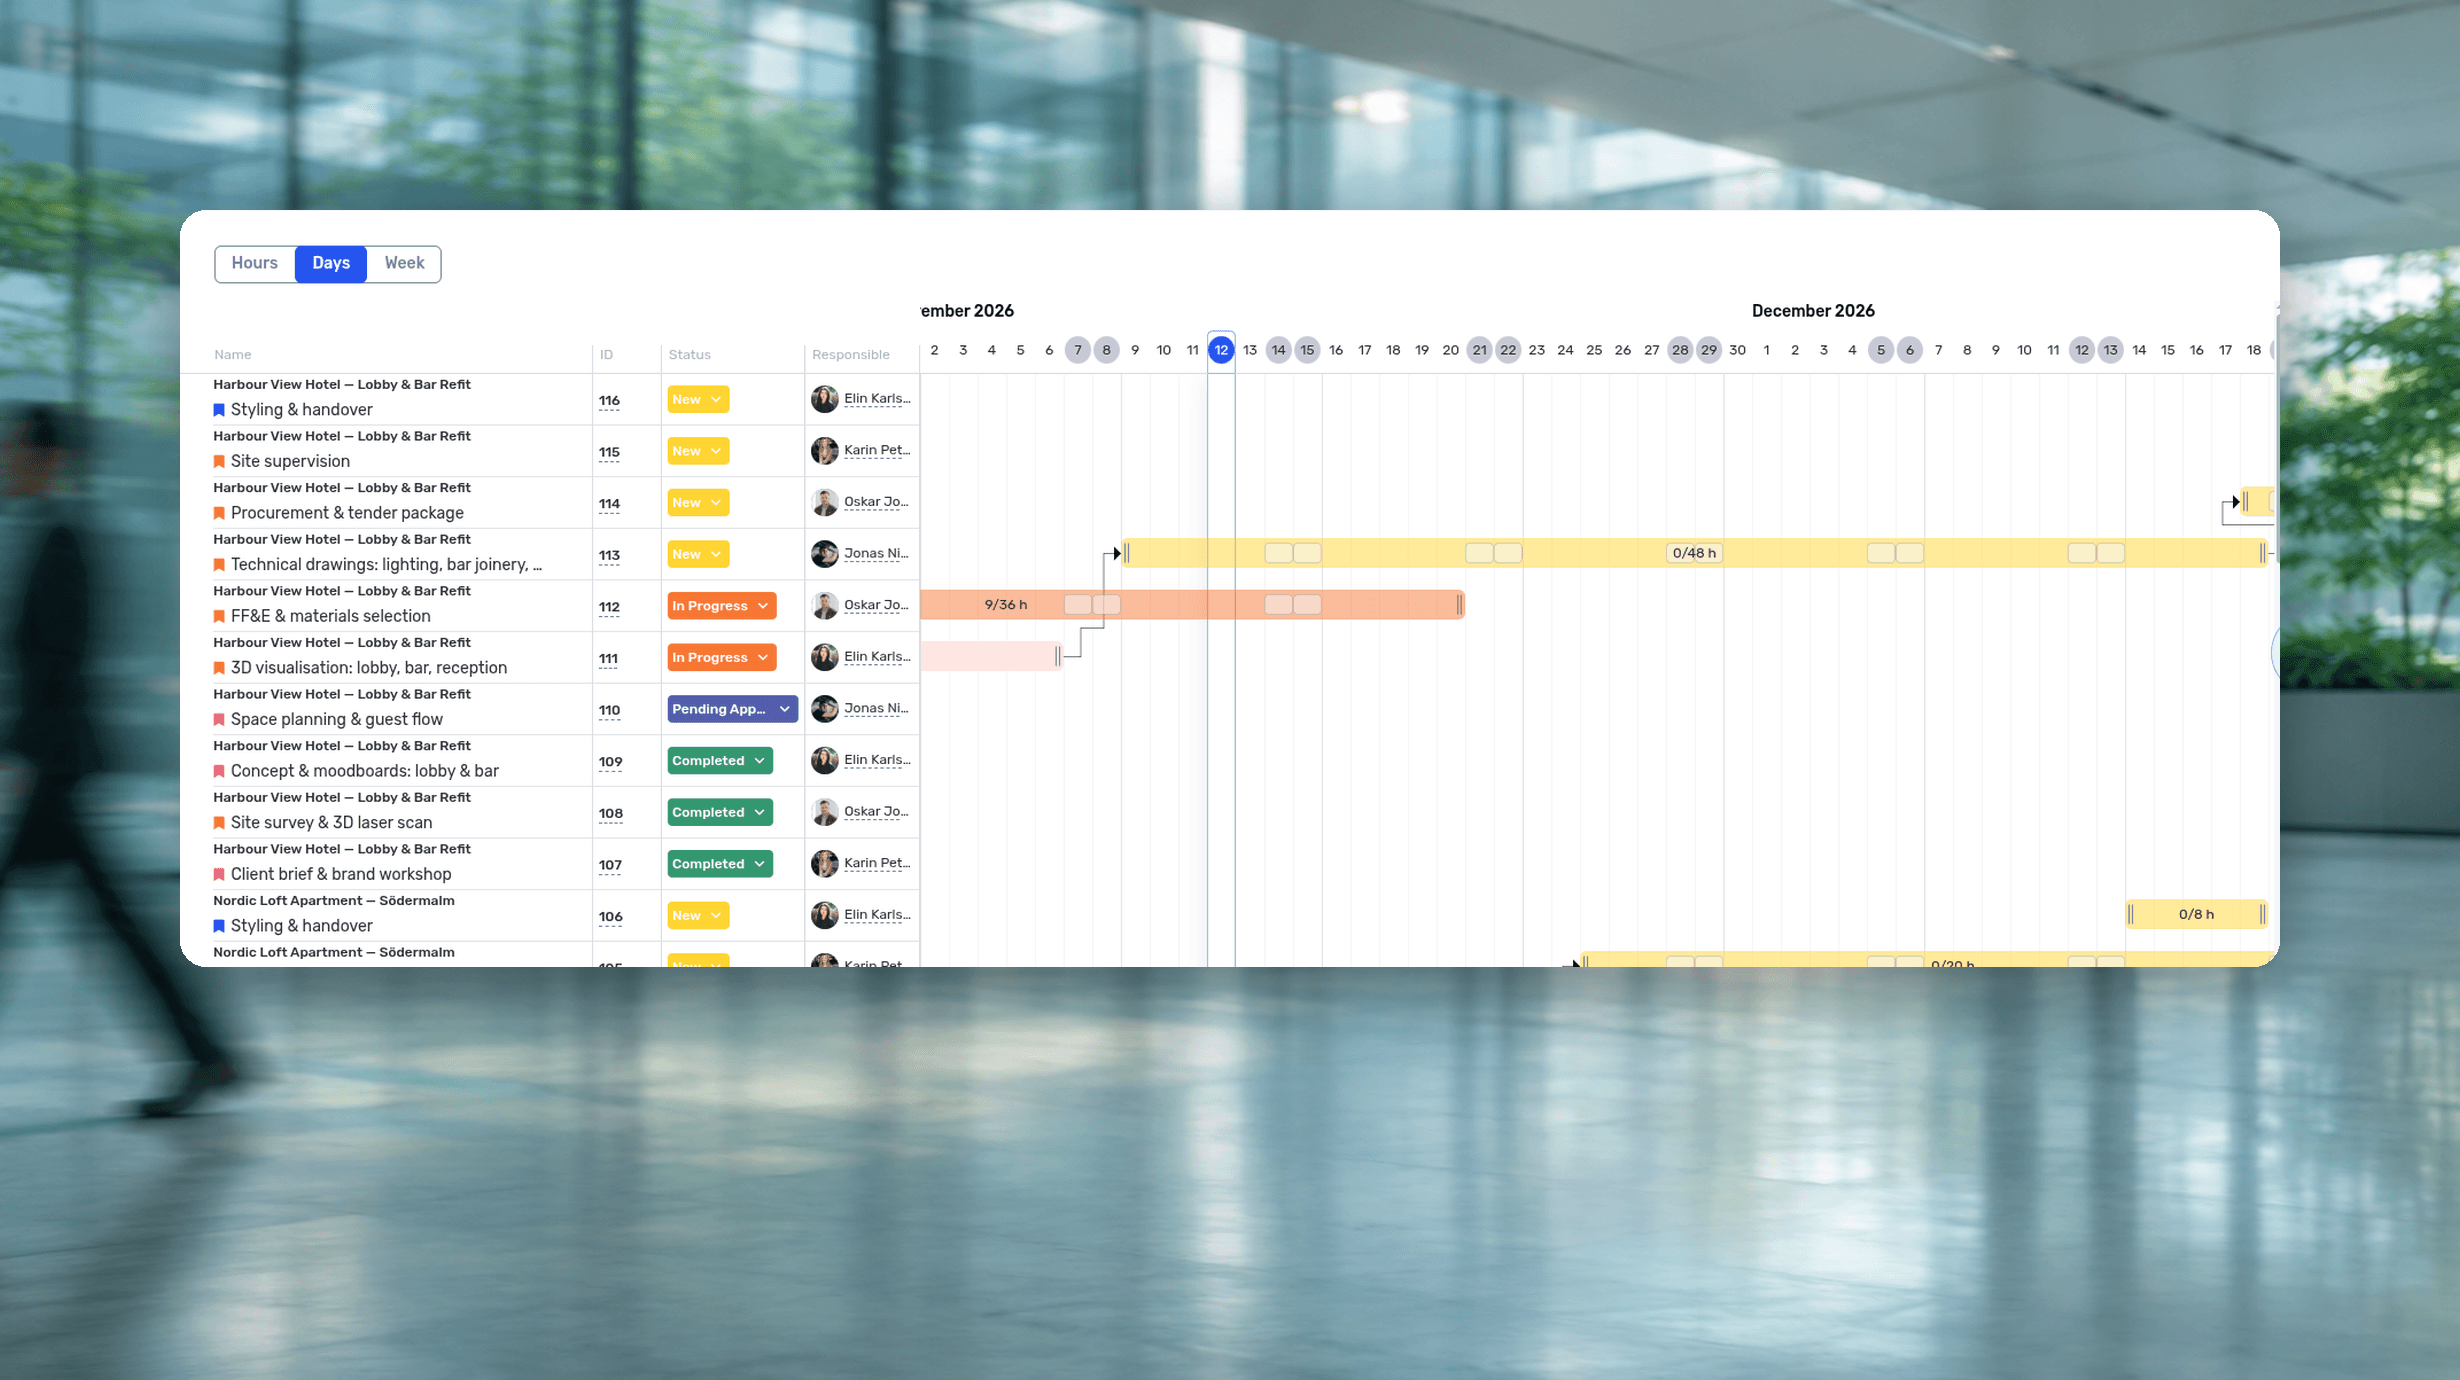
The screenshots below show the interface with separate demo data.
Create tasks with dates and owners
Add the six example tasks to a project and assign dates, owners and planned hours. Keep client approval visible, with someone responsible for coordinating it. Otherwise, delivery depends on an event that is missing from the schedule.
Choose a useful scale
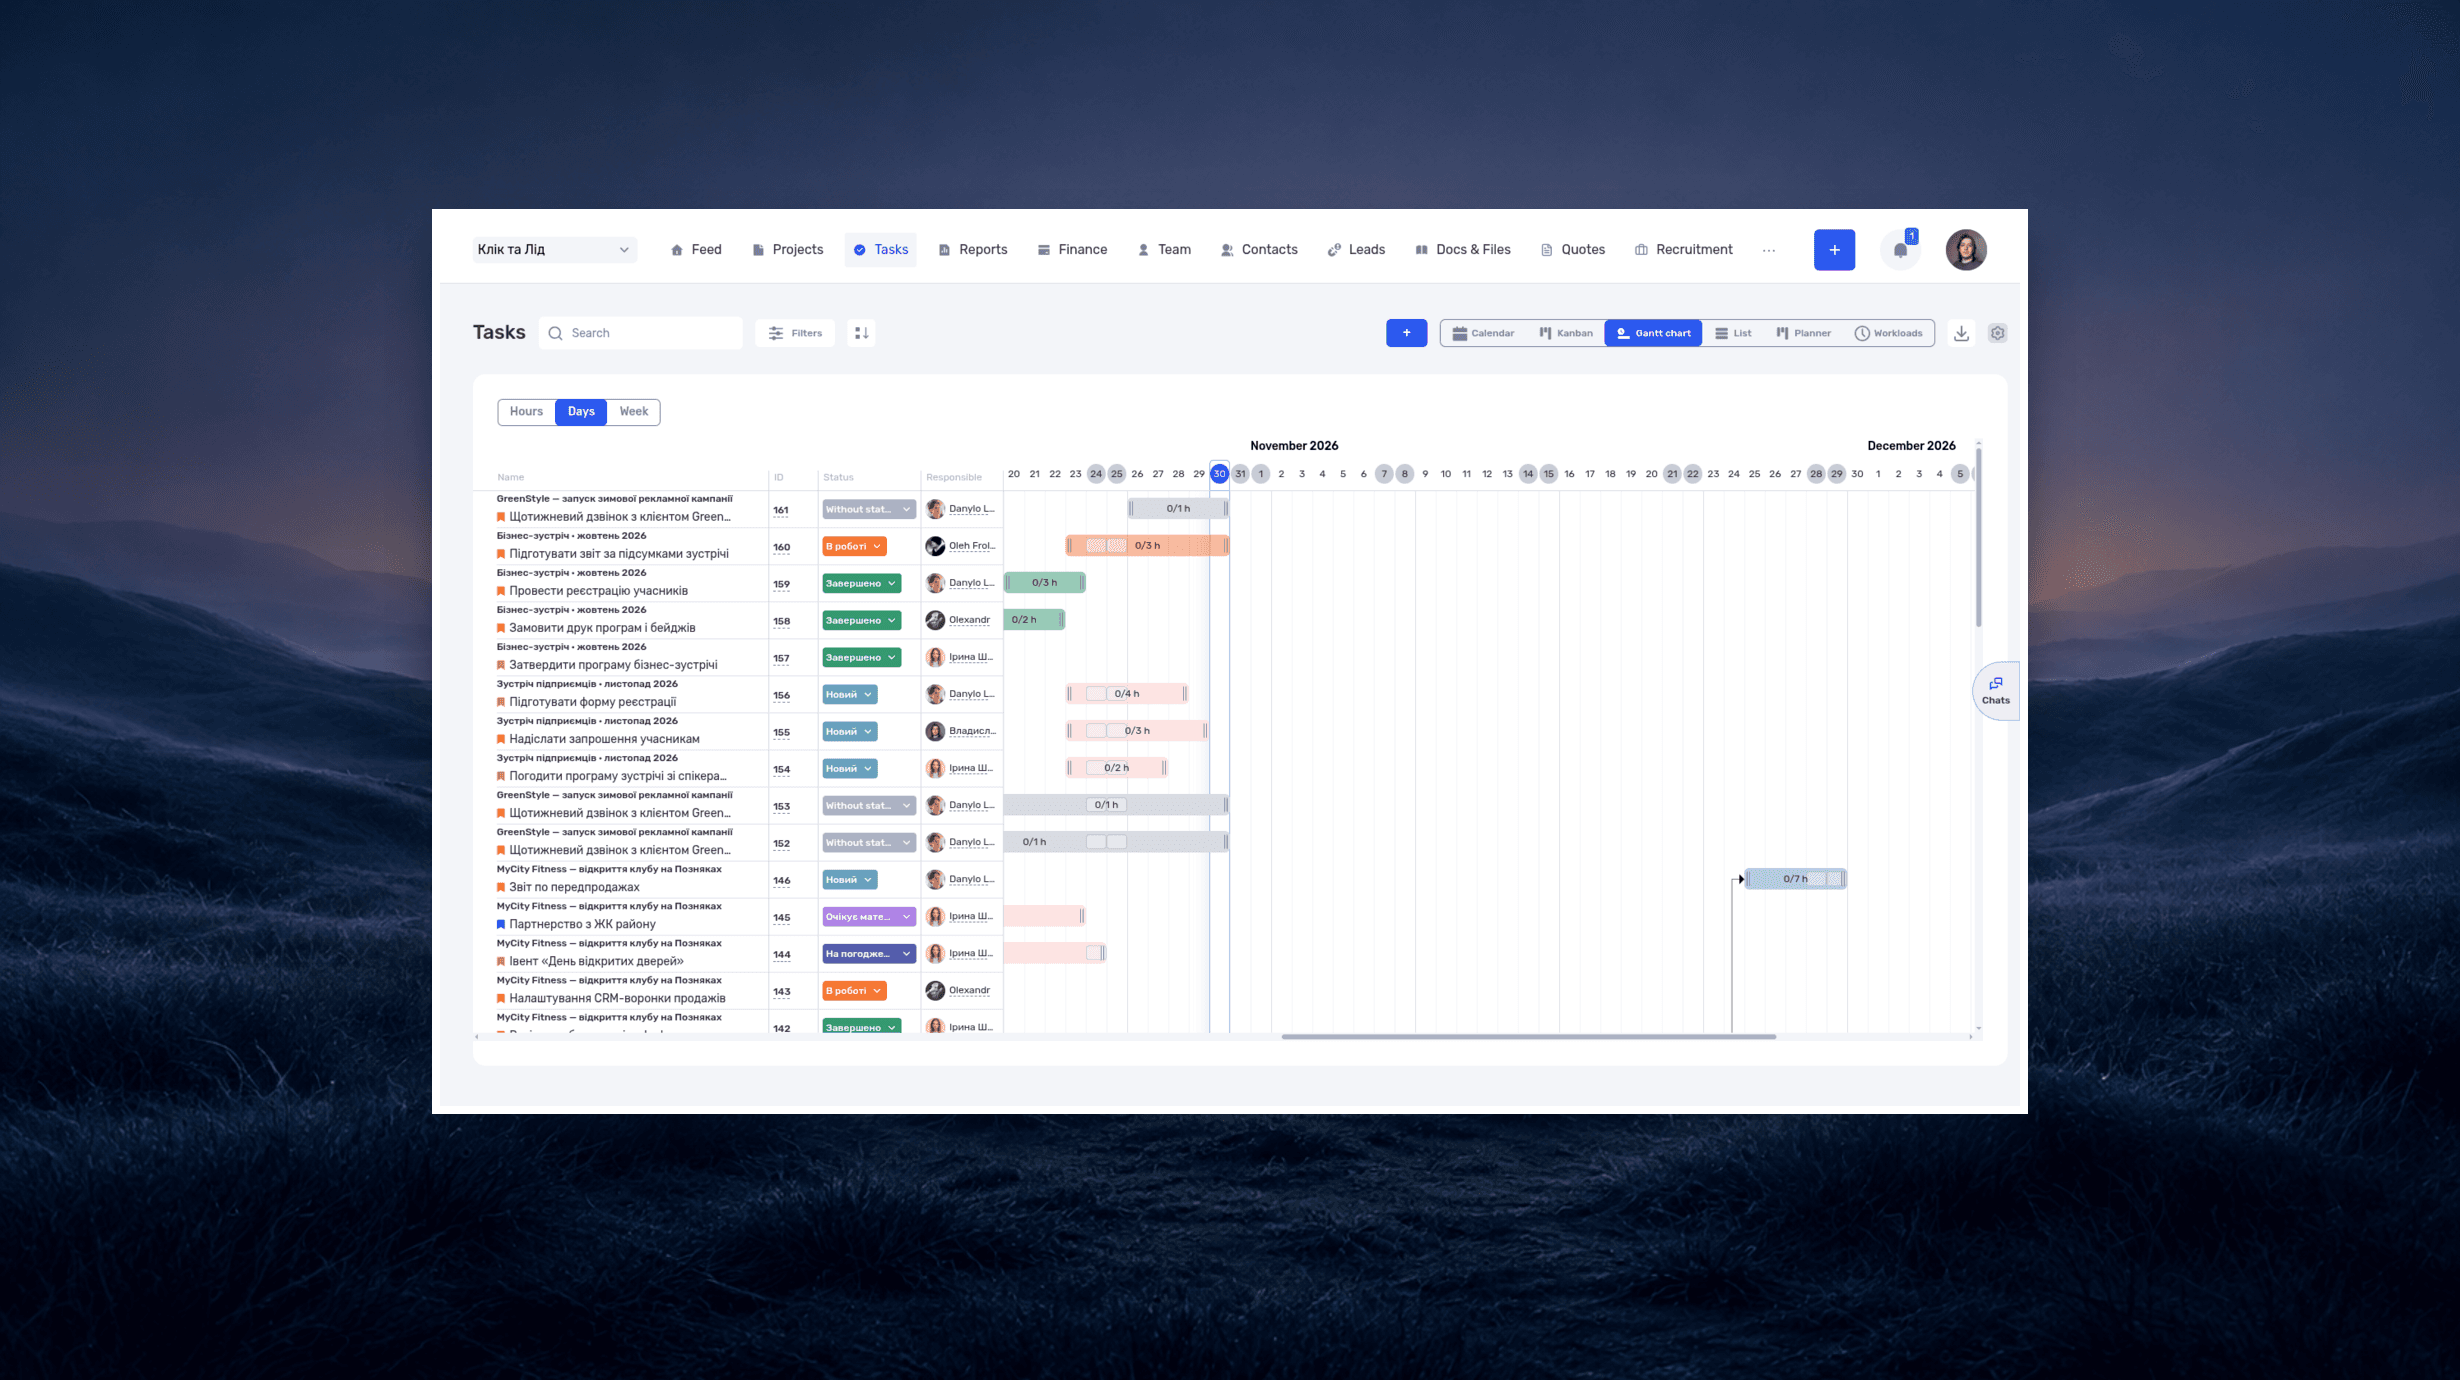
Open the task Gantt view and choose Days. Check the sequence of the six tasks, including the overlapping design and copy work. Hours is useful for scheduling within a day; Weeks helps with a longer project.
Move or extend the bars to change dates, as described in the Gantt documentation.
Add dependencies and test the result
if.team supports dependencies between tasks and between iterations. Hard dependencies recalculate connected dates when preceding work moves. Soft dependencies retain the relationship without automatically changing dates.
For our example, link design approval to the build, then link the build to testing and launch. Move approval by two days. With hard dependencies, the connected dates recalculate. Compare the new launch date with the deadline agreed with the client.
The product update on dependencies and iterations documents this behavior. The principle applies to task and iteration scheduling.
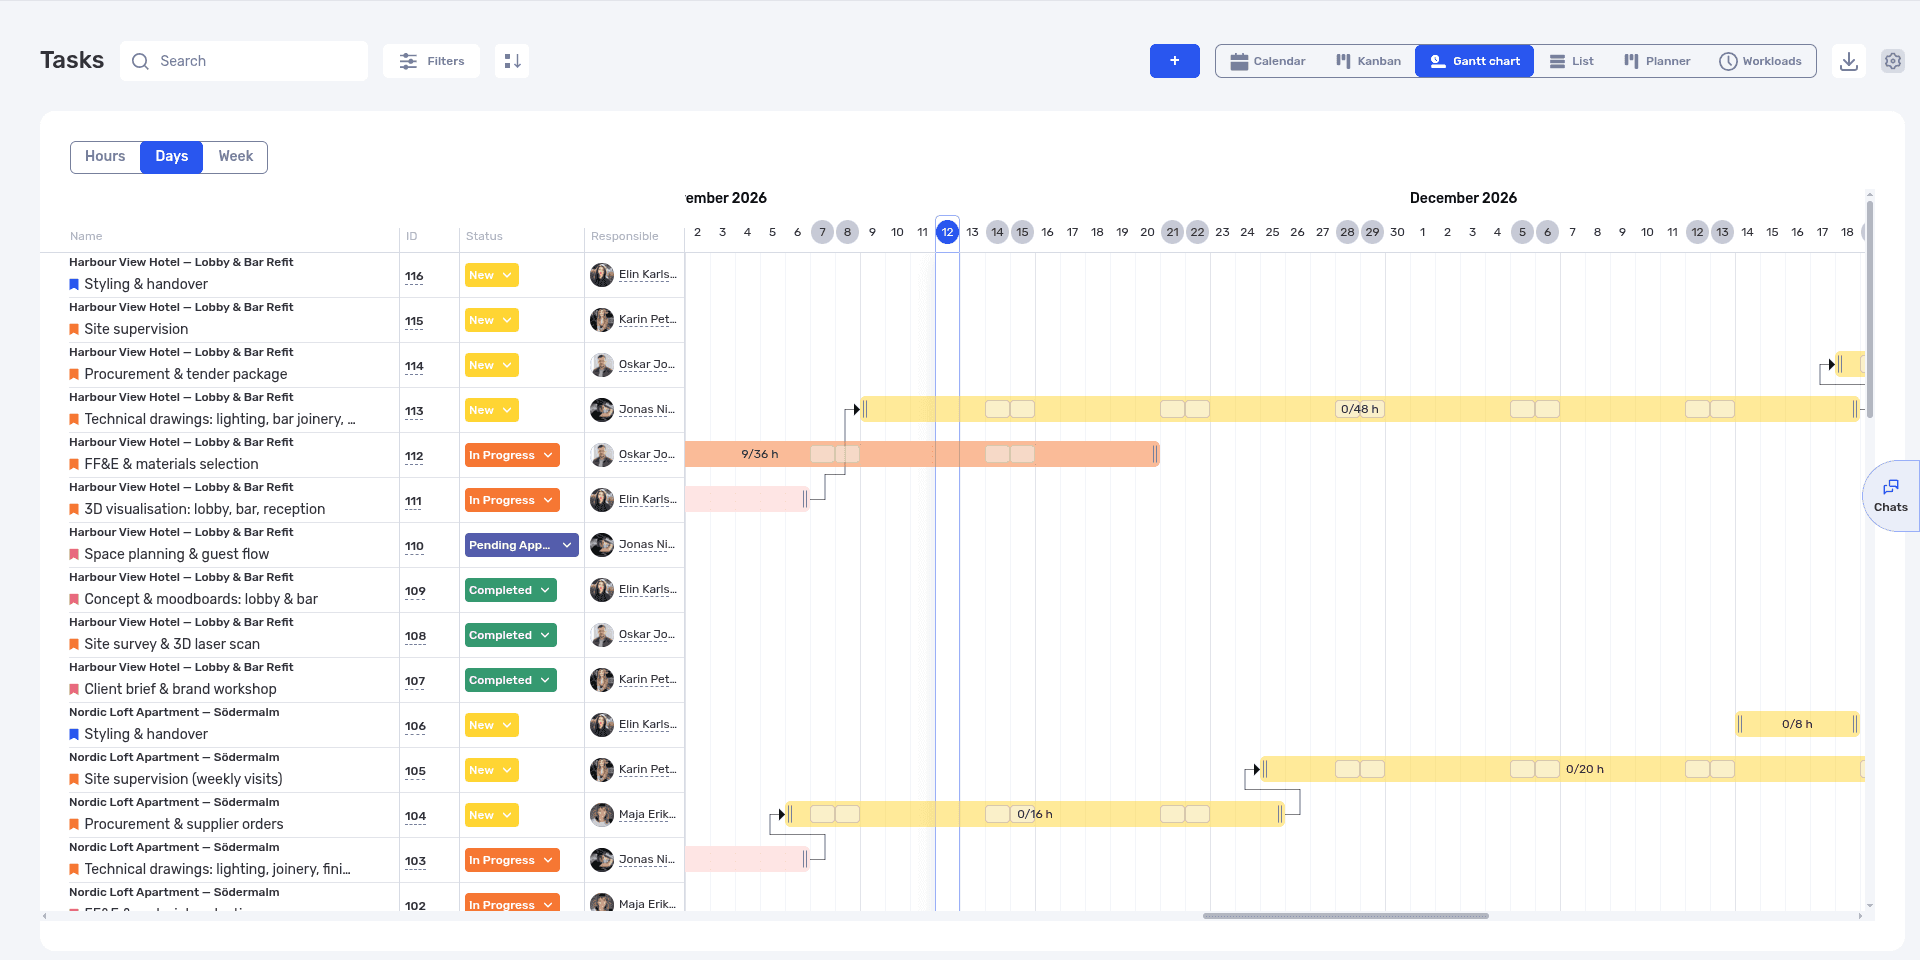
The Days view brings task dates, statuses, assignees and dependency links onto one timeline.
Check the person across projects
The overall Gantt view can expand projects into iterations and filter by participant. This helps reveal overlapping stages involving the same person.
Open the Work Calendar, choose Work Time Planning and click the relevant day. Compare task hours with the person’s availability. Two overlapping tasks requiring two hours each may fit into one day; two eight-hour tasks need a different schedule.
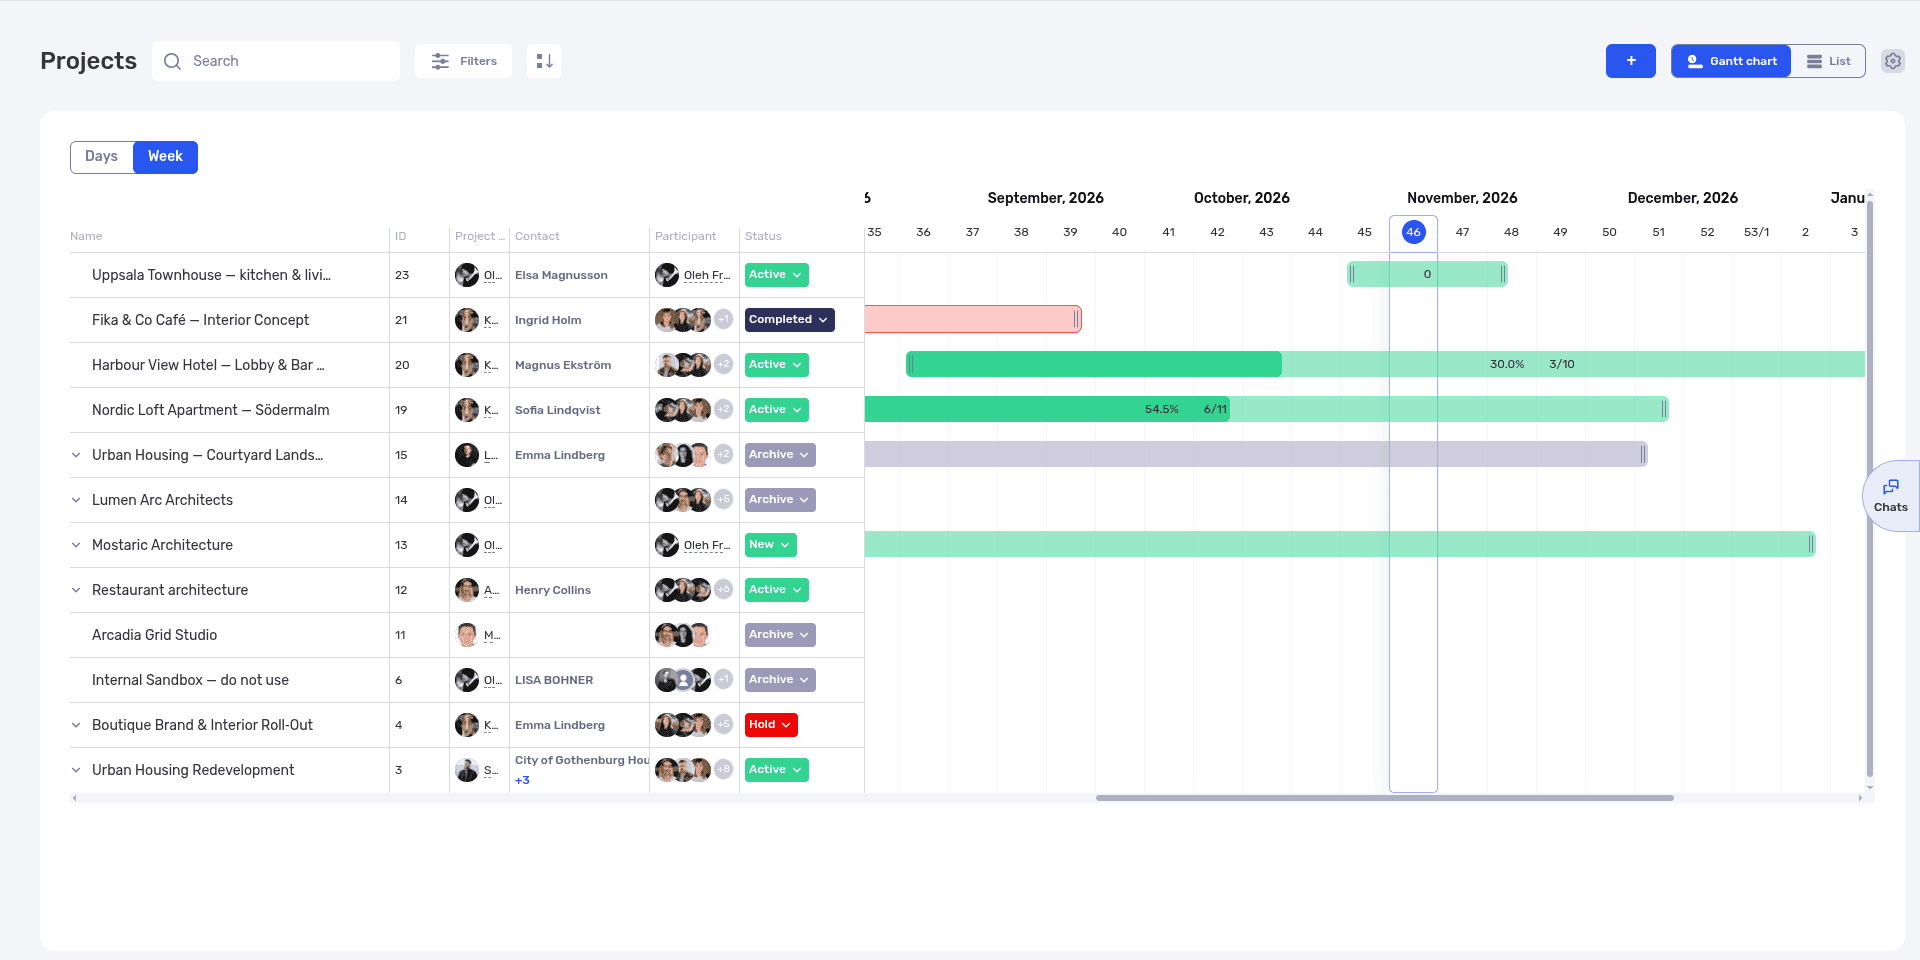
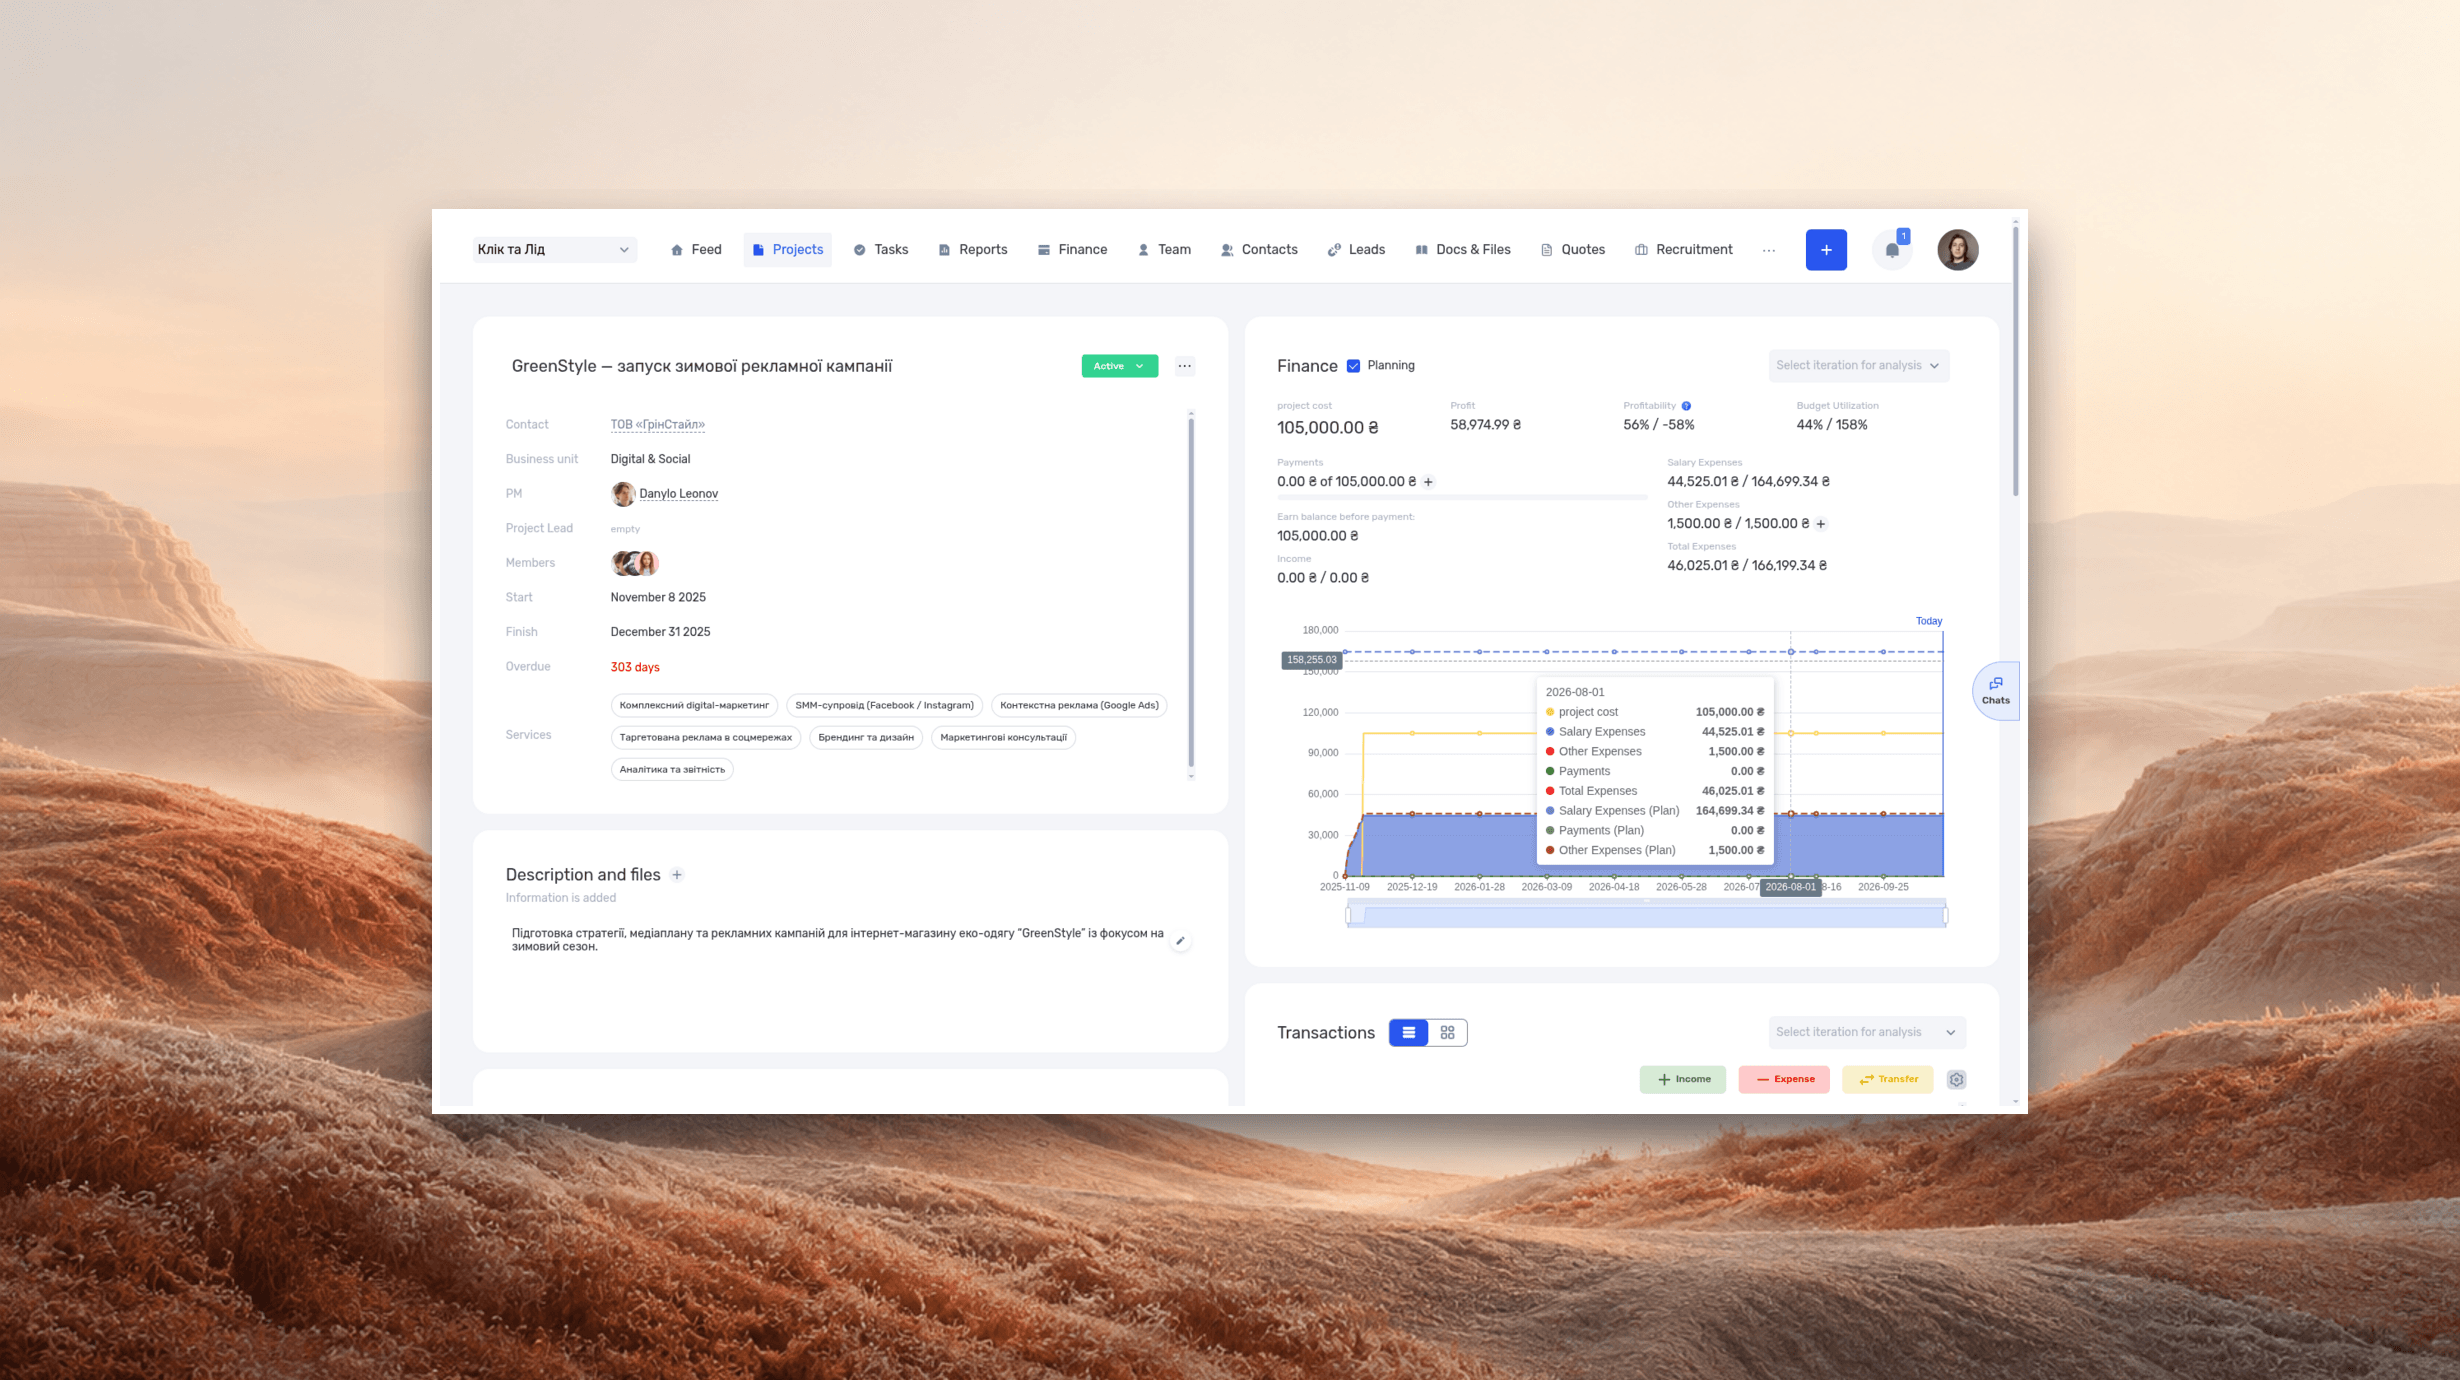
The project Gantt view shows overlapping schedules and the participants involved in each project.
Learn from completed work
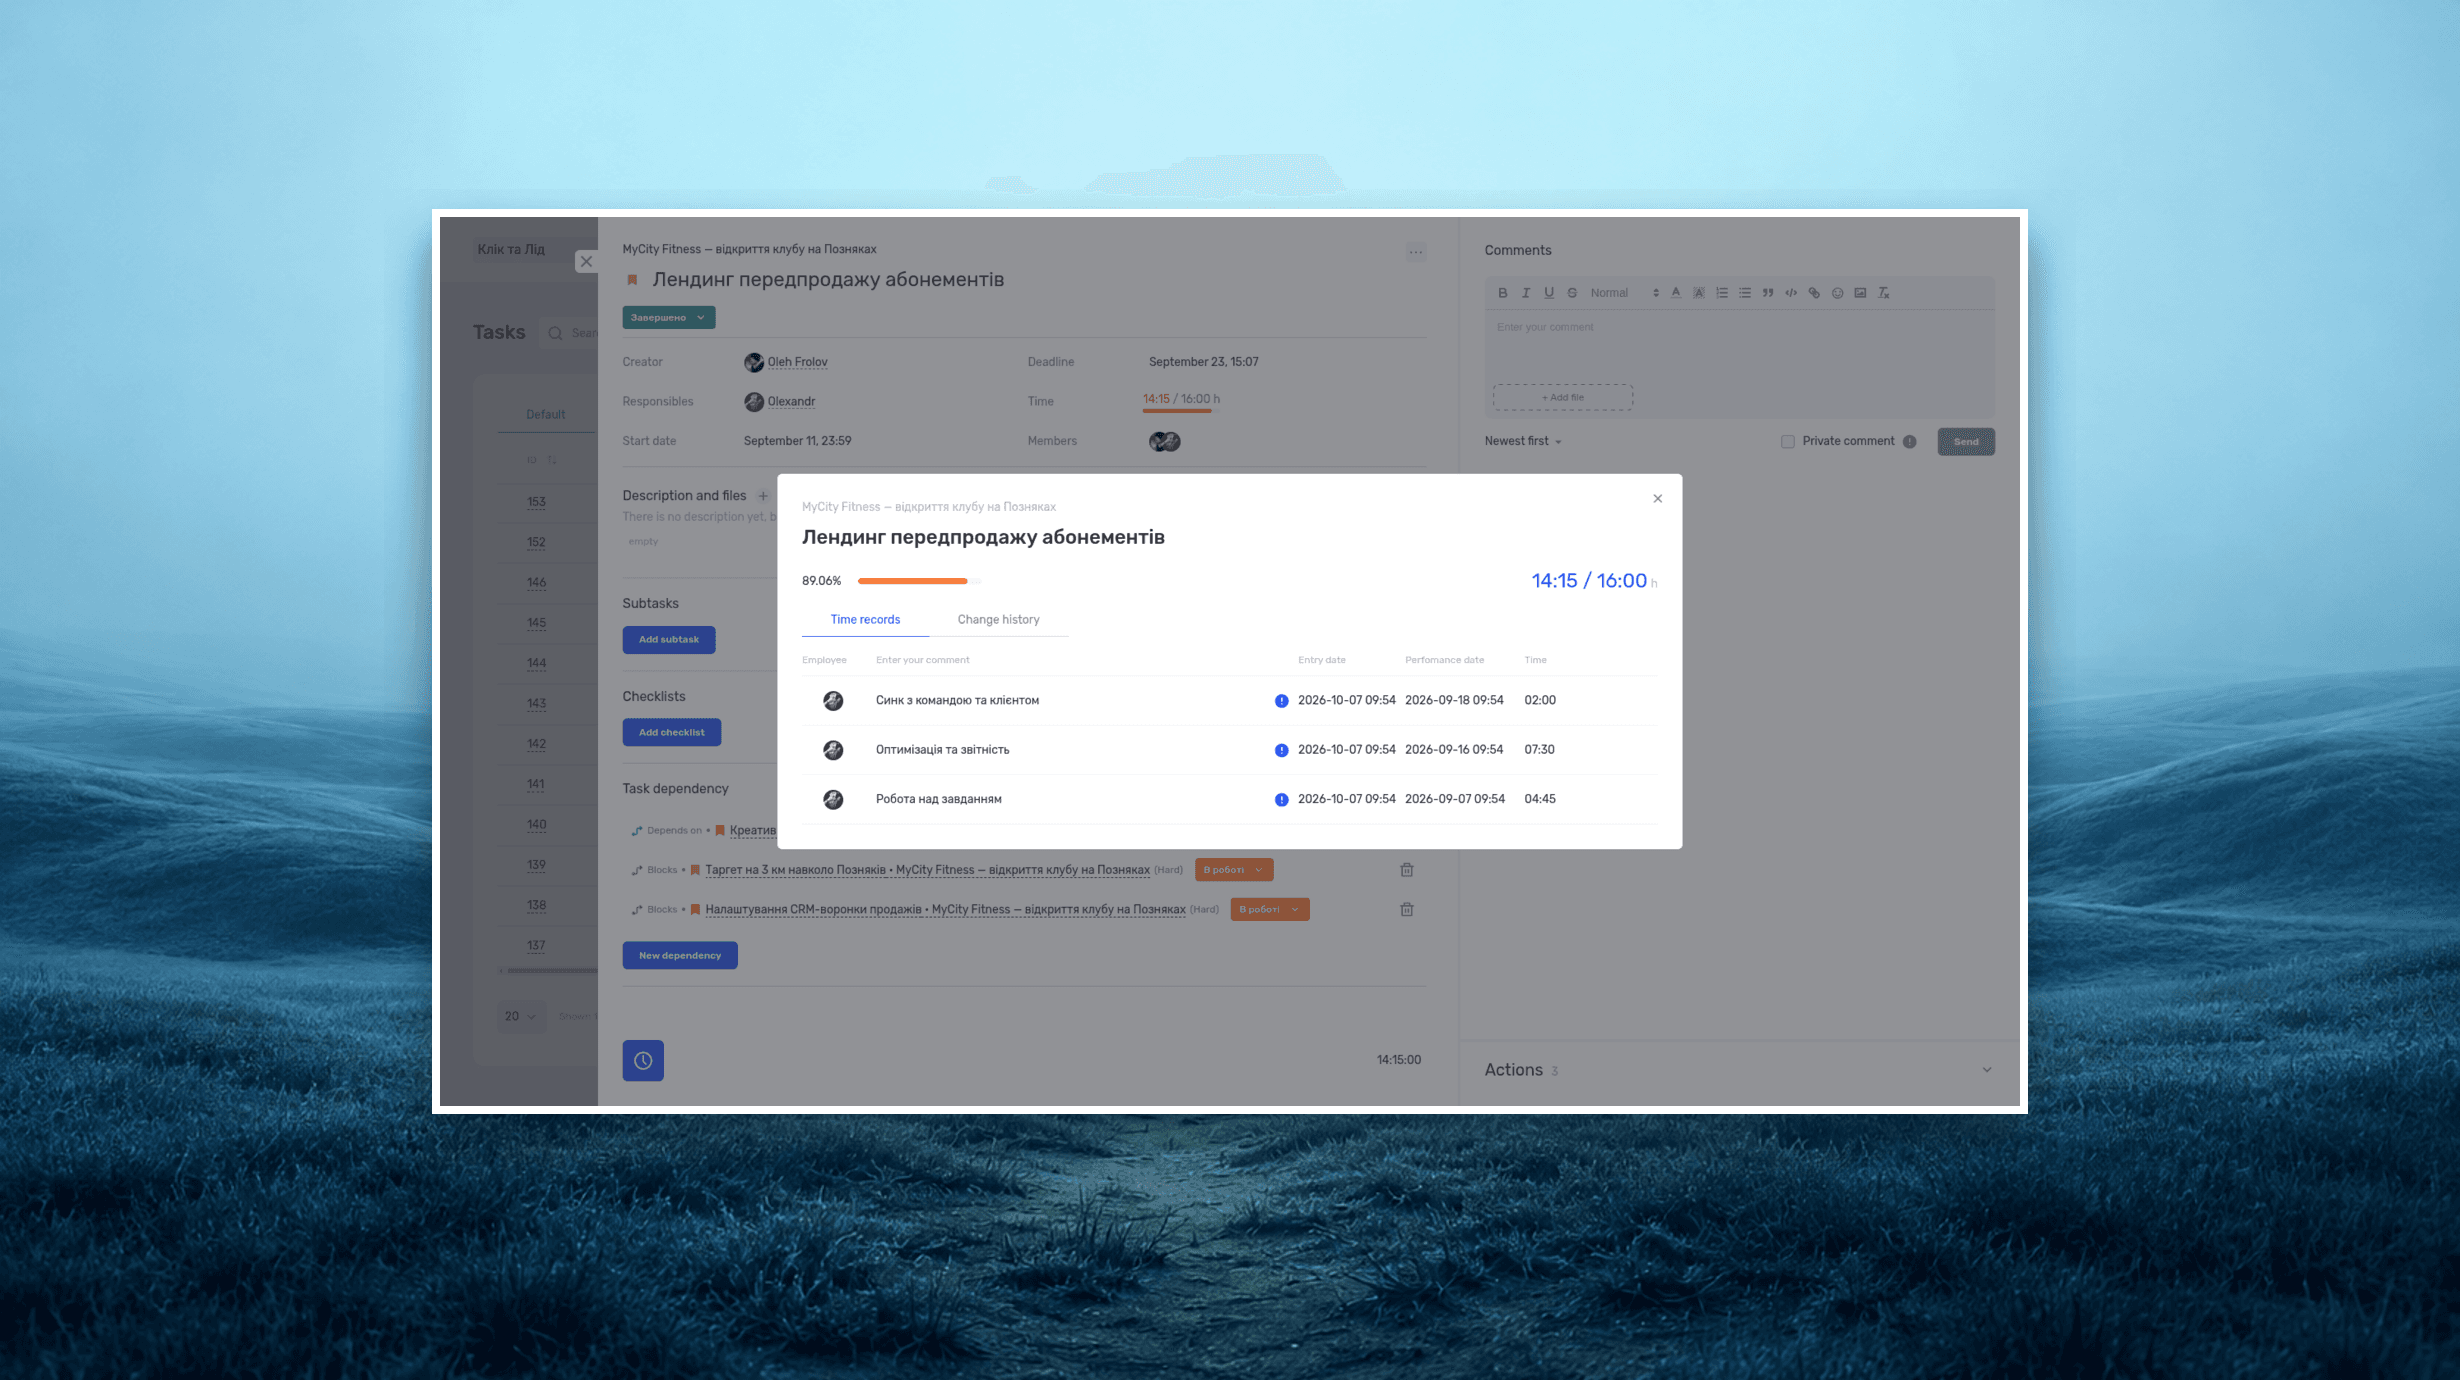
After delivery, compare logged hours with estimates and investigate schedule changes. If design took the expected effort but approval took three days instead of one, revise the approval agreement for the next project.
Project finances provide a separate view of how additional work affects costs. See project financial management for the relationship between hours, rates and financial records.
How a company uses the shared schedule
Oasis Comfort uses a shared Gantt chart to plan HVAC and plumbing projects. The team expands projects into stages to compare dates across sites and see the work inside each project. The team reviews several delivery schedules together before changing a stage or assigning a crew.
Start an if.team trial with one project, or book a demo to review your stages and dependencies.
Frequently asked questions
What is a Gantt chart in simple terms?
It is a task list arranged on a timeline. Each bar shows when work starts and finishes. Dependency links show which tasks rely on others.
What does a Gantt chart show?
It shows task dates, duration and overlap. Depending on the tool, it can also display owners, milestones, progress and dependencies. It does not automatically explain the hours of effort behind each bar.
How does a Gantt chart work?
The chart places tasks against dates and connects dependent work. When the plan changes, the team checks the downstream effect and updates the schedule. Some software automates date changes based on configured relationships.
What is the critical path in a Gantt chart?
It is the chain of dependent work that determines the earliest finish under the current schedule. Work on that path has no available total float in the basic model. Delaying it can delay the project unless another change offsets the delay.
Can I make a Gantt chart in Excel?
Yes. Use task start and finish dates with a calendar grid and conditional formatting. Dependency-driven rescheduling needs additional formulas; coloring a date range alone does not provide it.
Is a Gantt chart better than Kanban?
They answer different questions. Gantt charts help with dates and dependencies; Kanban helps with workflow status and queues. A project team can use both views for the same tasks.
When should you use a Gantt chart for project management?
Use one when delivery depends on a sequence of tasks, several people need to coordinate handovers or a client needs to see the schedule. For a simple queue without date dependencies, a board or task list may be enough.
Author
Vladyslav ChesnokovPublished
Nov 17, 2025
More articles to read
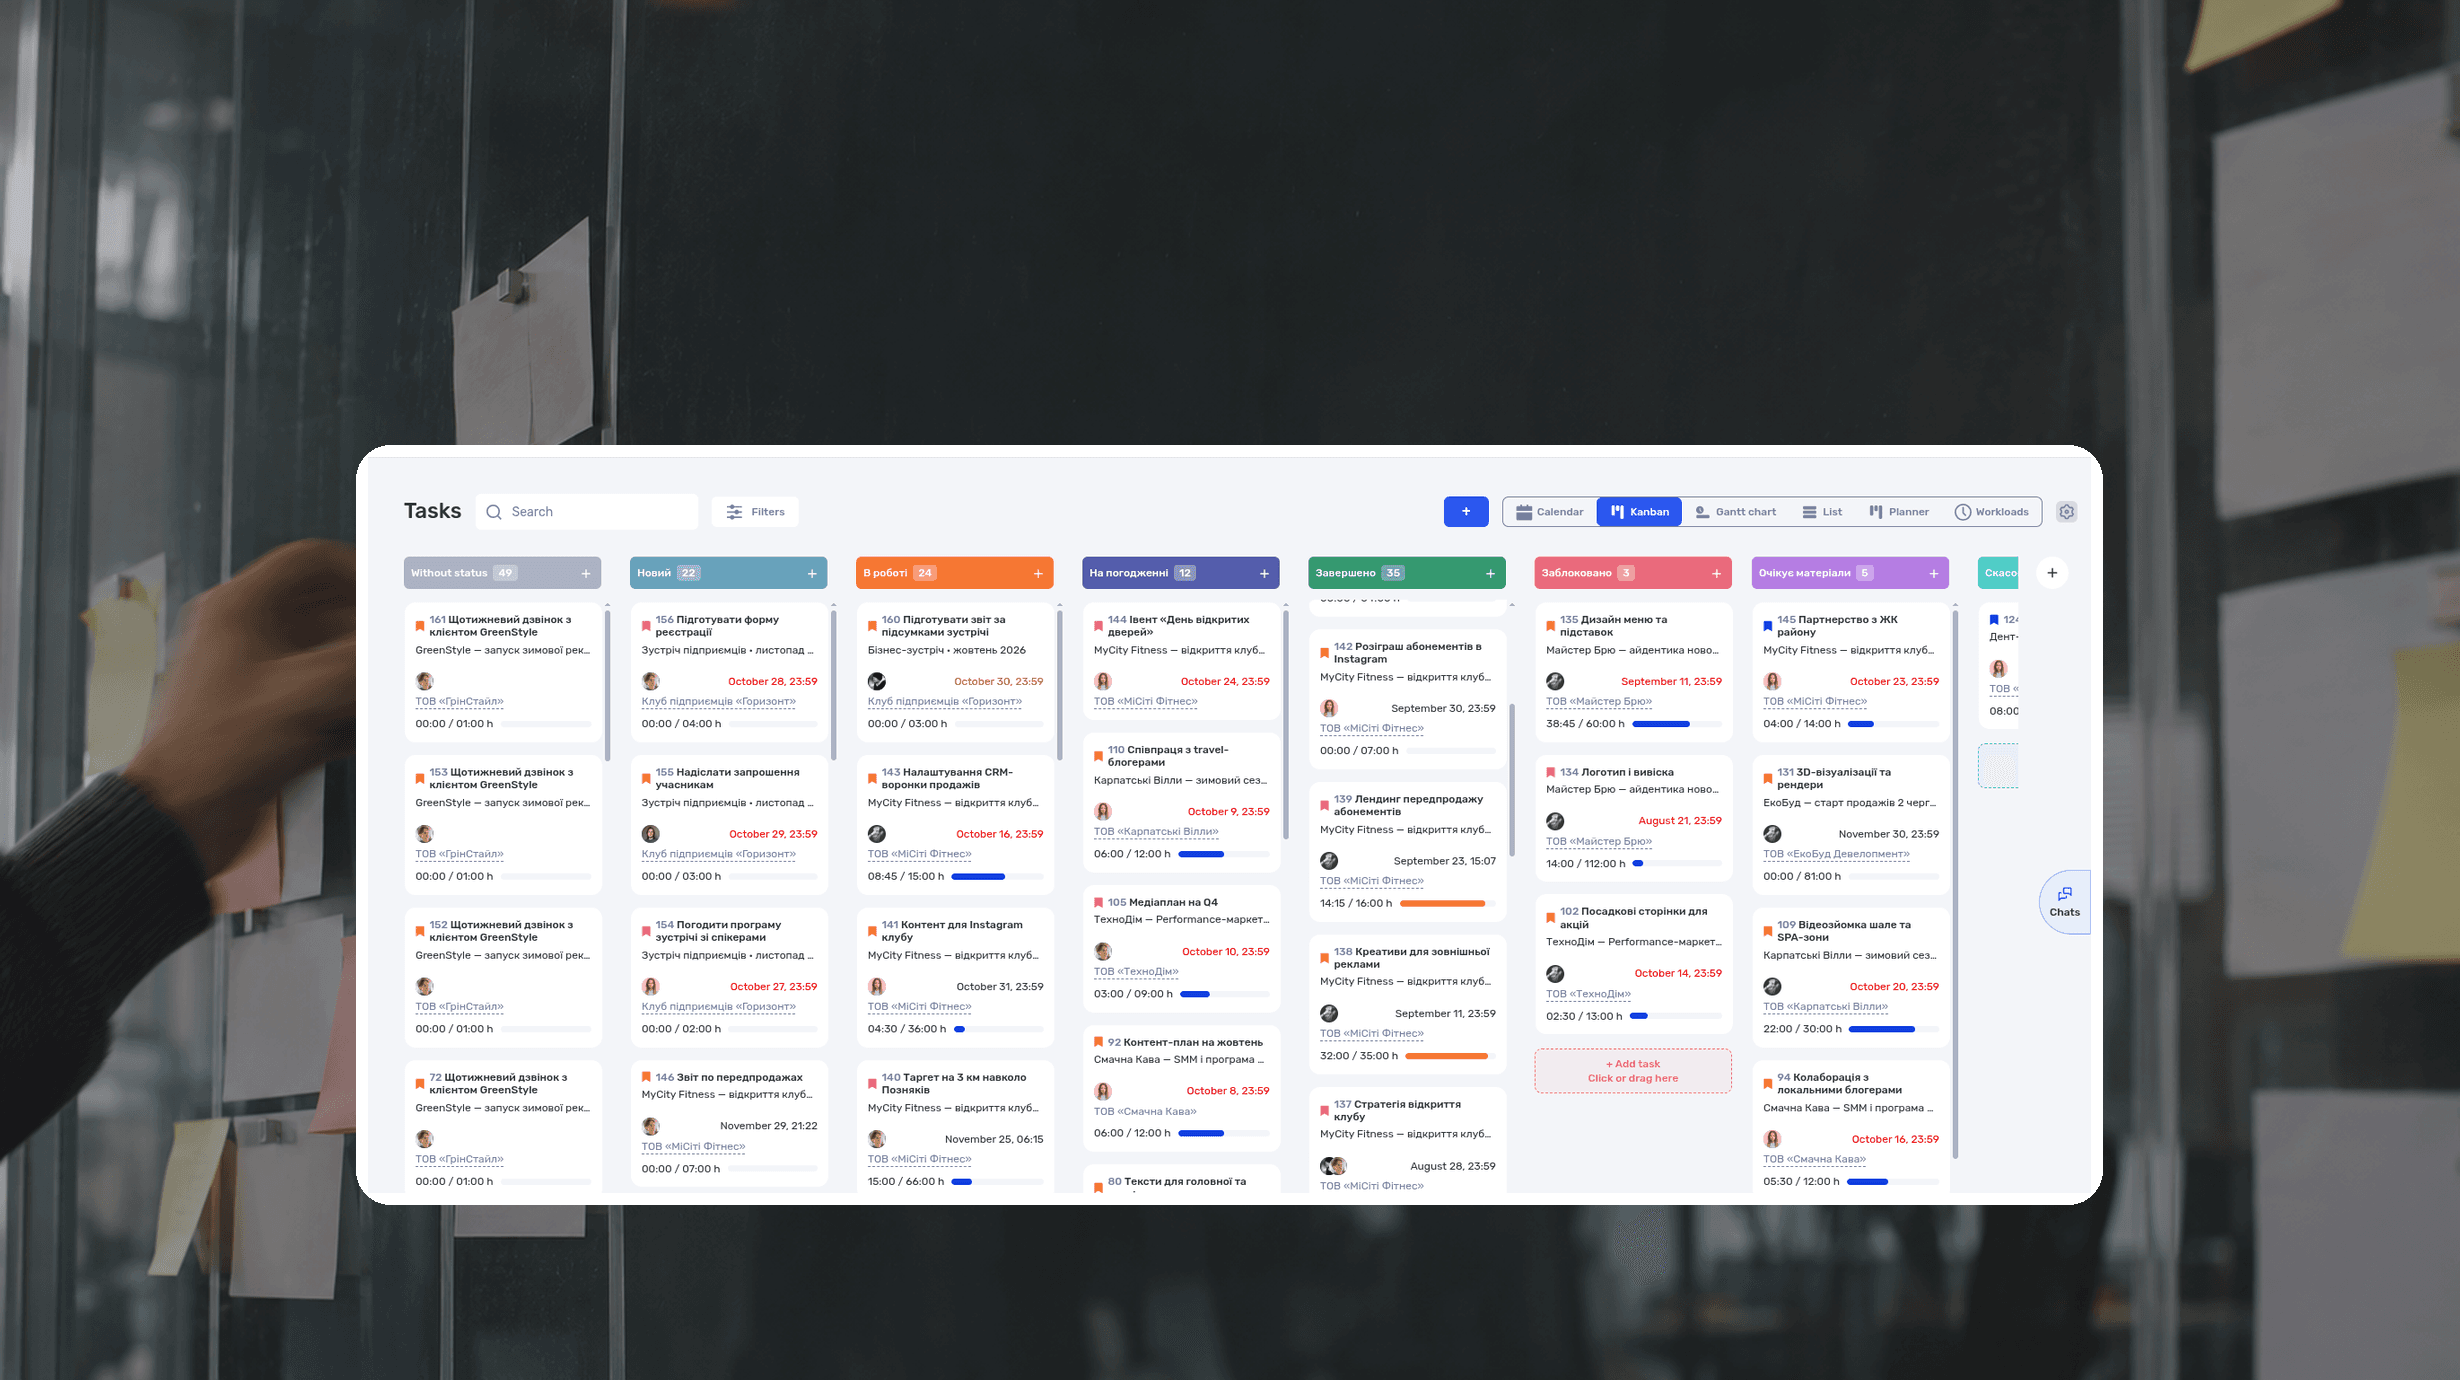
What Is a Kanban Board? Definition, Examples, Setup
A Kanban board is a visual workflow tool that represents work as cards moving through columns. The columns show each stage of the process, while work-in-progress limits control how many items a team handles at once. The board makes blocked work, queues, and delays visible.
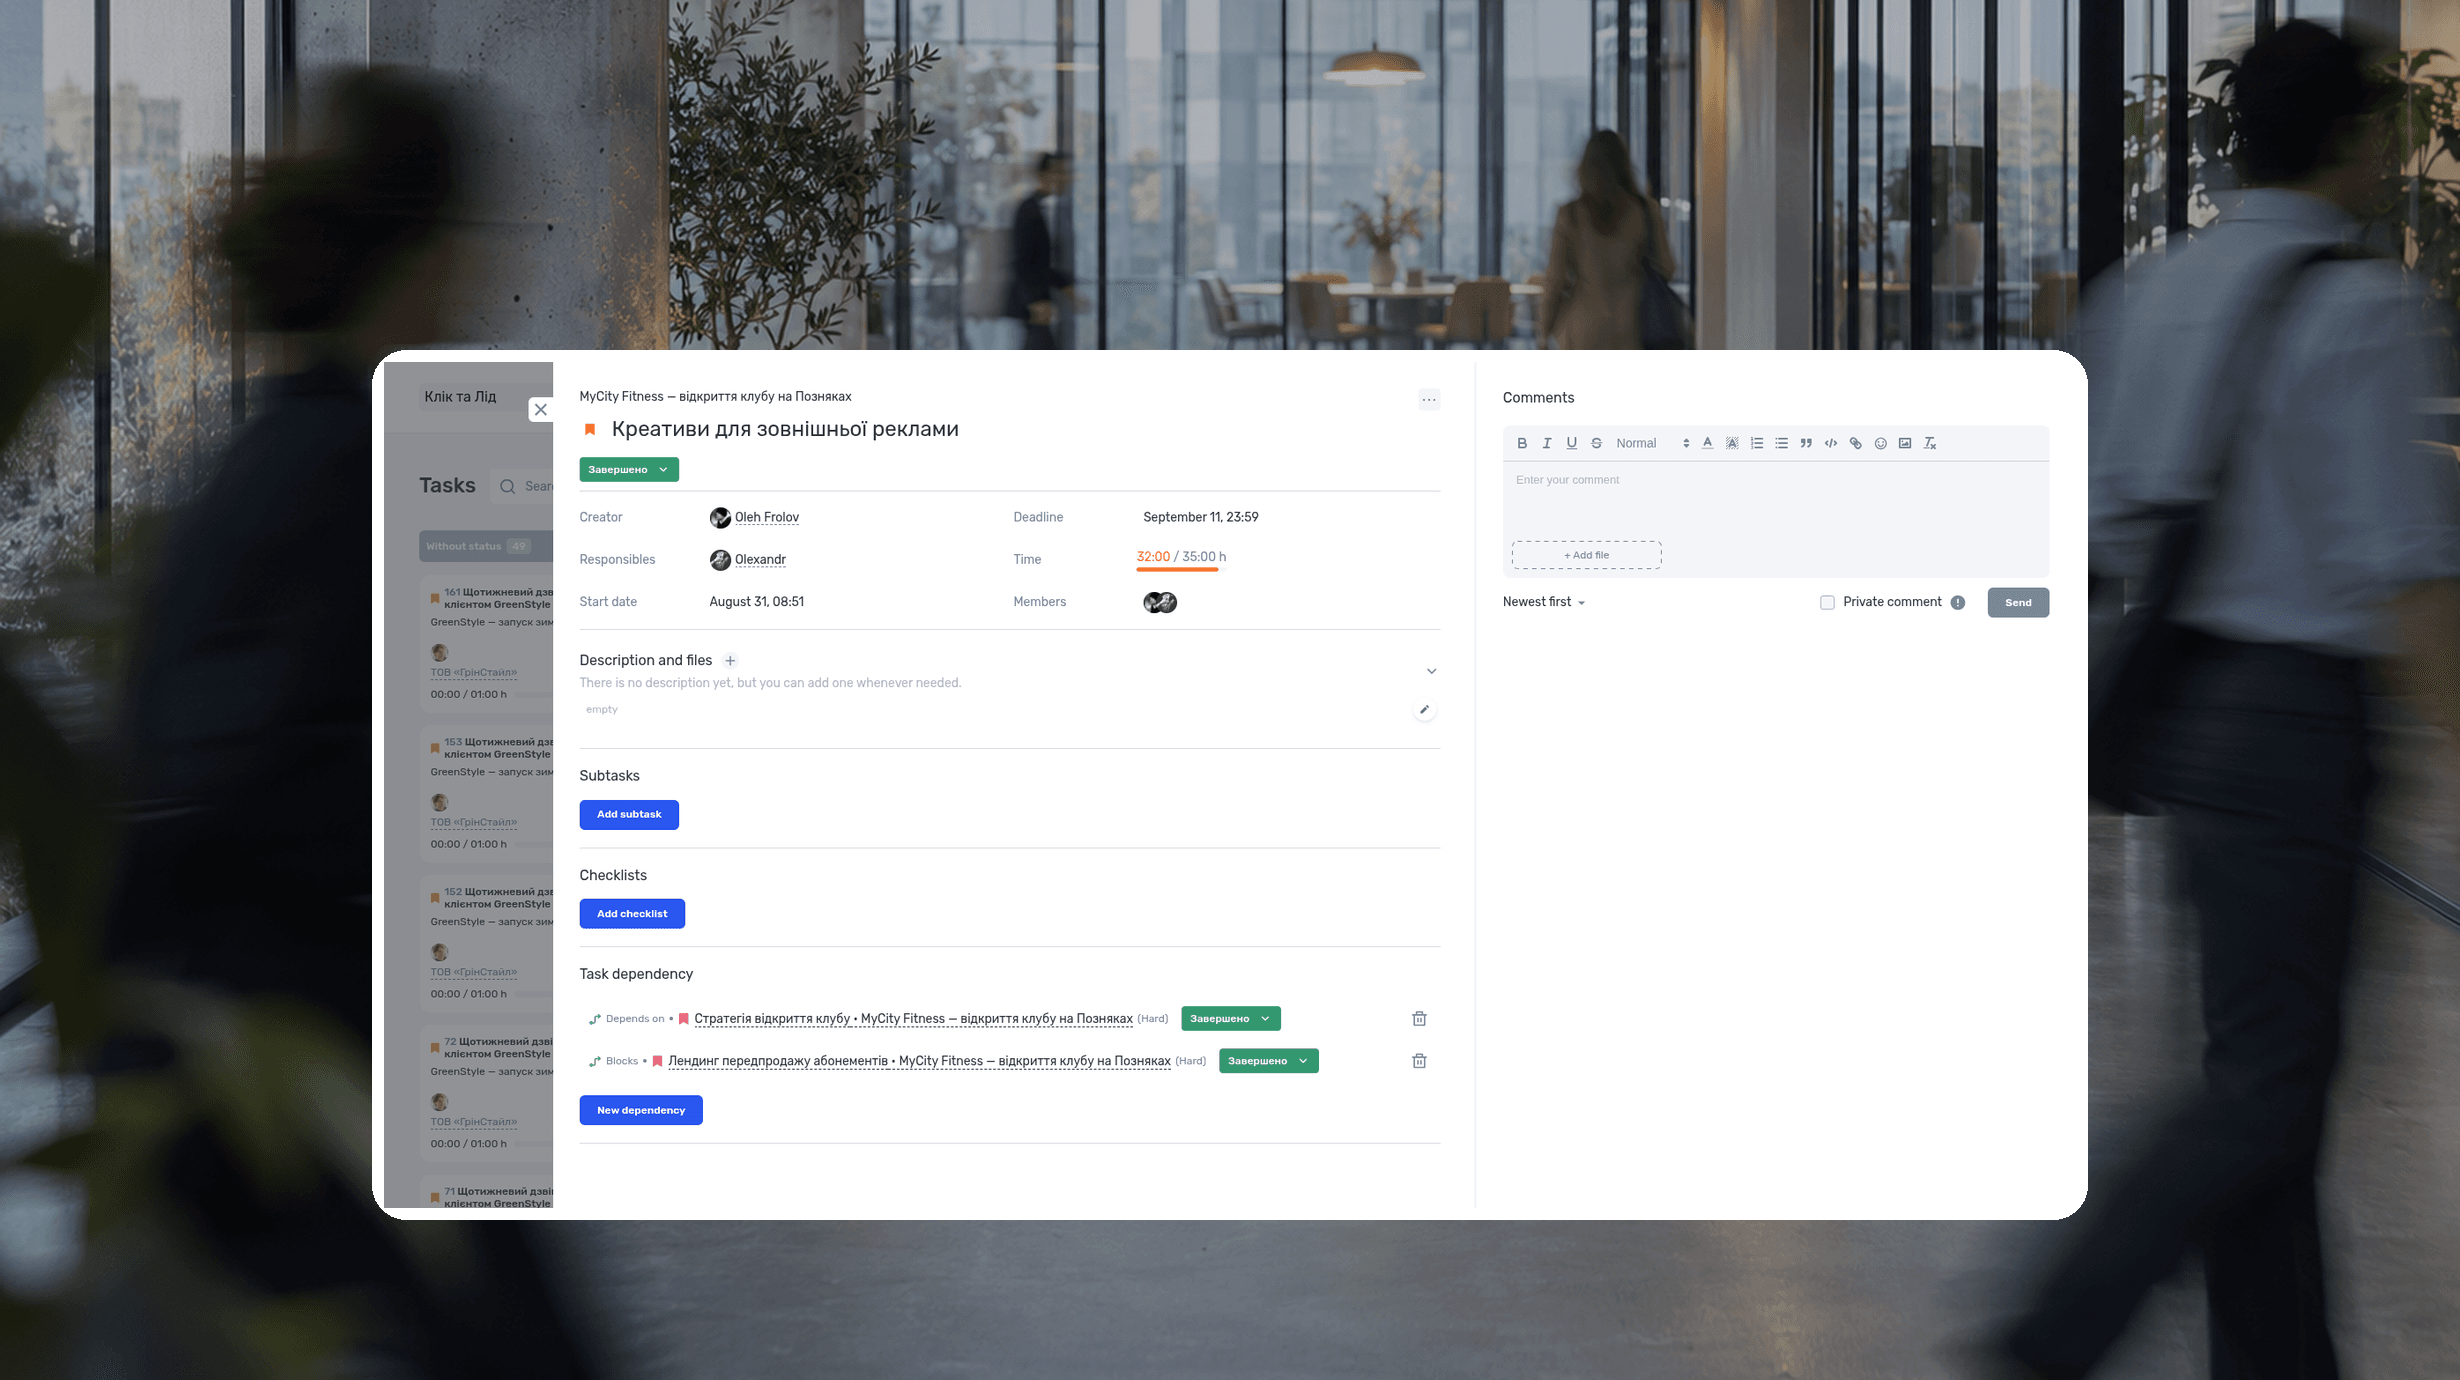
RACI Matrix: Definition, Free Template and Example
A RACI matrix is a table that shows who does the work on a project, who accepts the result, who gives input, and who gets updates. The name comes from the four roles: Responsible, Accountable, Consulted, Informed. Rows are deliverables or decisions, columns are people or roles.
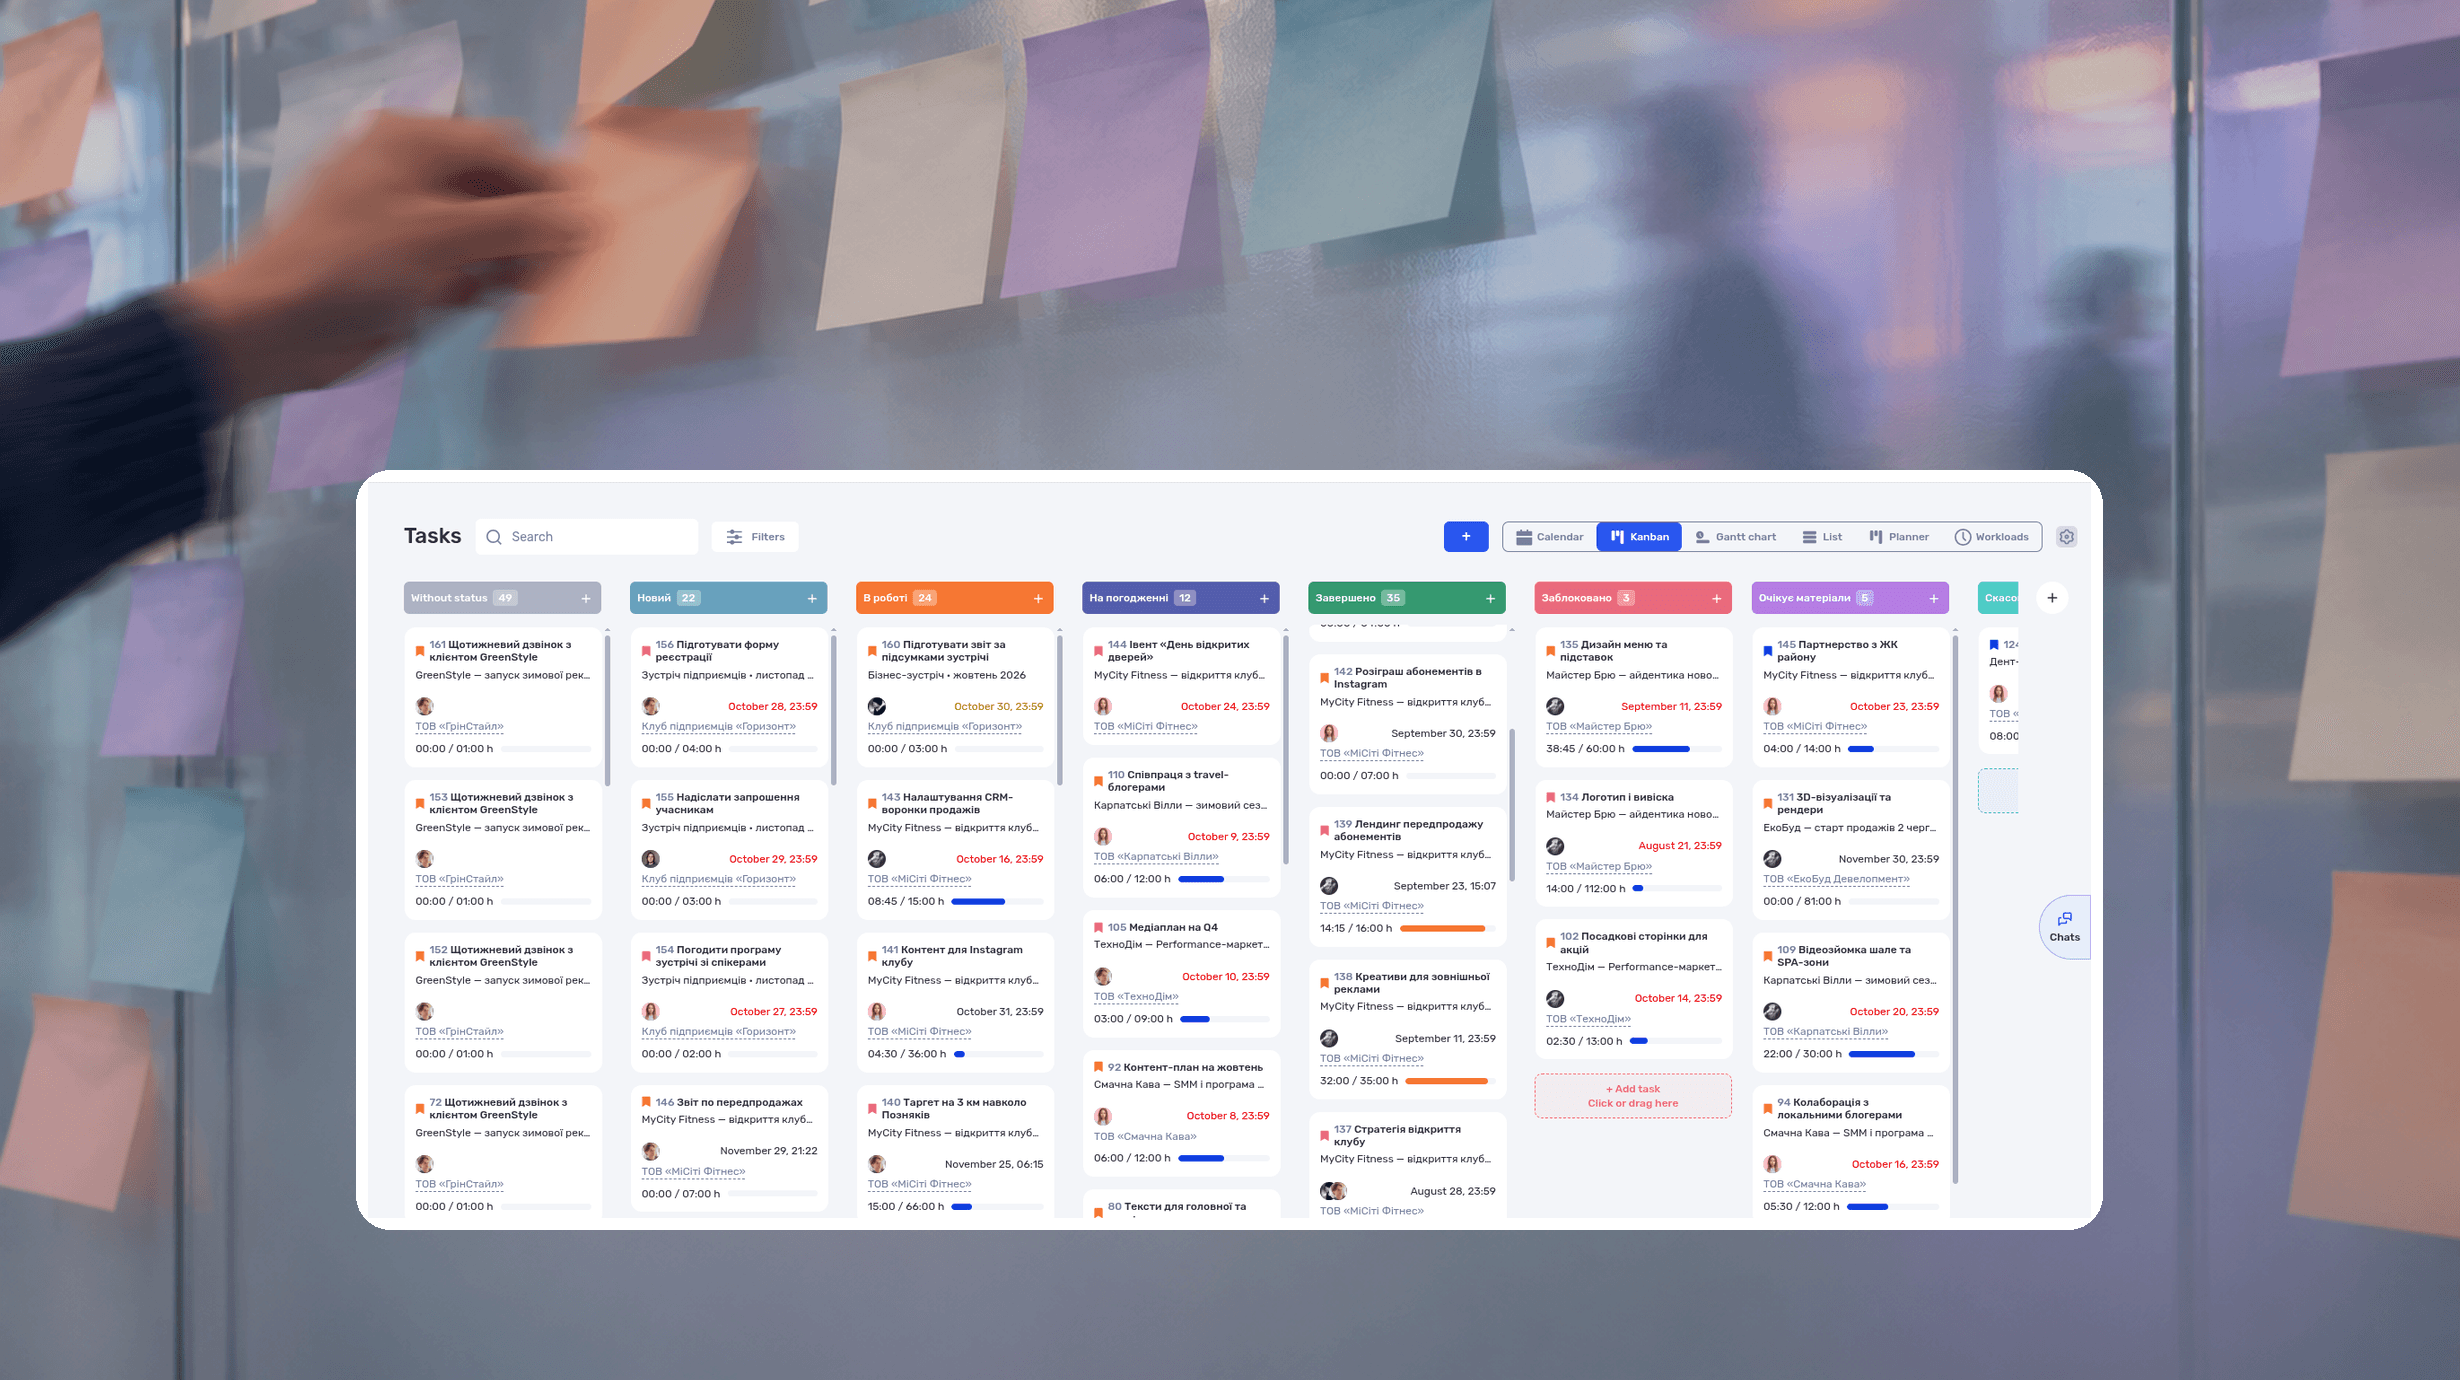
Agile Methodology: What It Is, Principles, Example
Agile methodology is an approach to project management in which a team delivers results in short cycles, shows them to the client and adjusts the plan based on feedback. Instead of one big six-month plan, agile project management works in a series of small, tested steps.
What is a deadline? How to set and meet realistic deadlines
Why six hours of work can take several days—and how to build a schedule around availability, review, and revisions. With a practical if.team walkthrough.
ERP systems explained—what they do and when your business needs one
See how ERP connects sales, delivery, and finances, with a worked example and a practical walkthrough in if.team.
Project time tracking — how to track team hours and costs
A practical guide to recording project hours, understanding overruns, and calculating team costs, with a worked example and a walkthrough in if.team.
See if.team in action for your company
We’ll show how projects, team time and finances connect in one system, using your processes as an example.