Financial Management
The Finance section is the center for managing the company’s cash flows. Here, you track income and expenses, analyze business profitability, control payroll payments, and plan future payments. All financial data is linked to projects, clients, and employees, giving you a complete real-time view of
To open the section, click Finance in the top navigation. A sidebar appears on the left with five subsections: Cash Flow, P&L (Profit and Loss Statement), Transactions, Payroll, and Integrations.
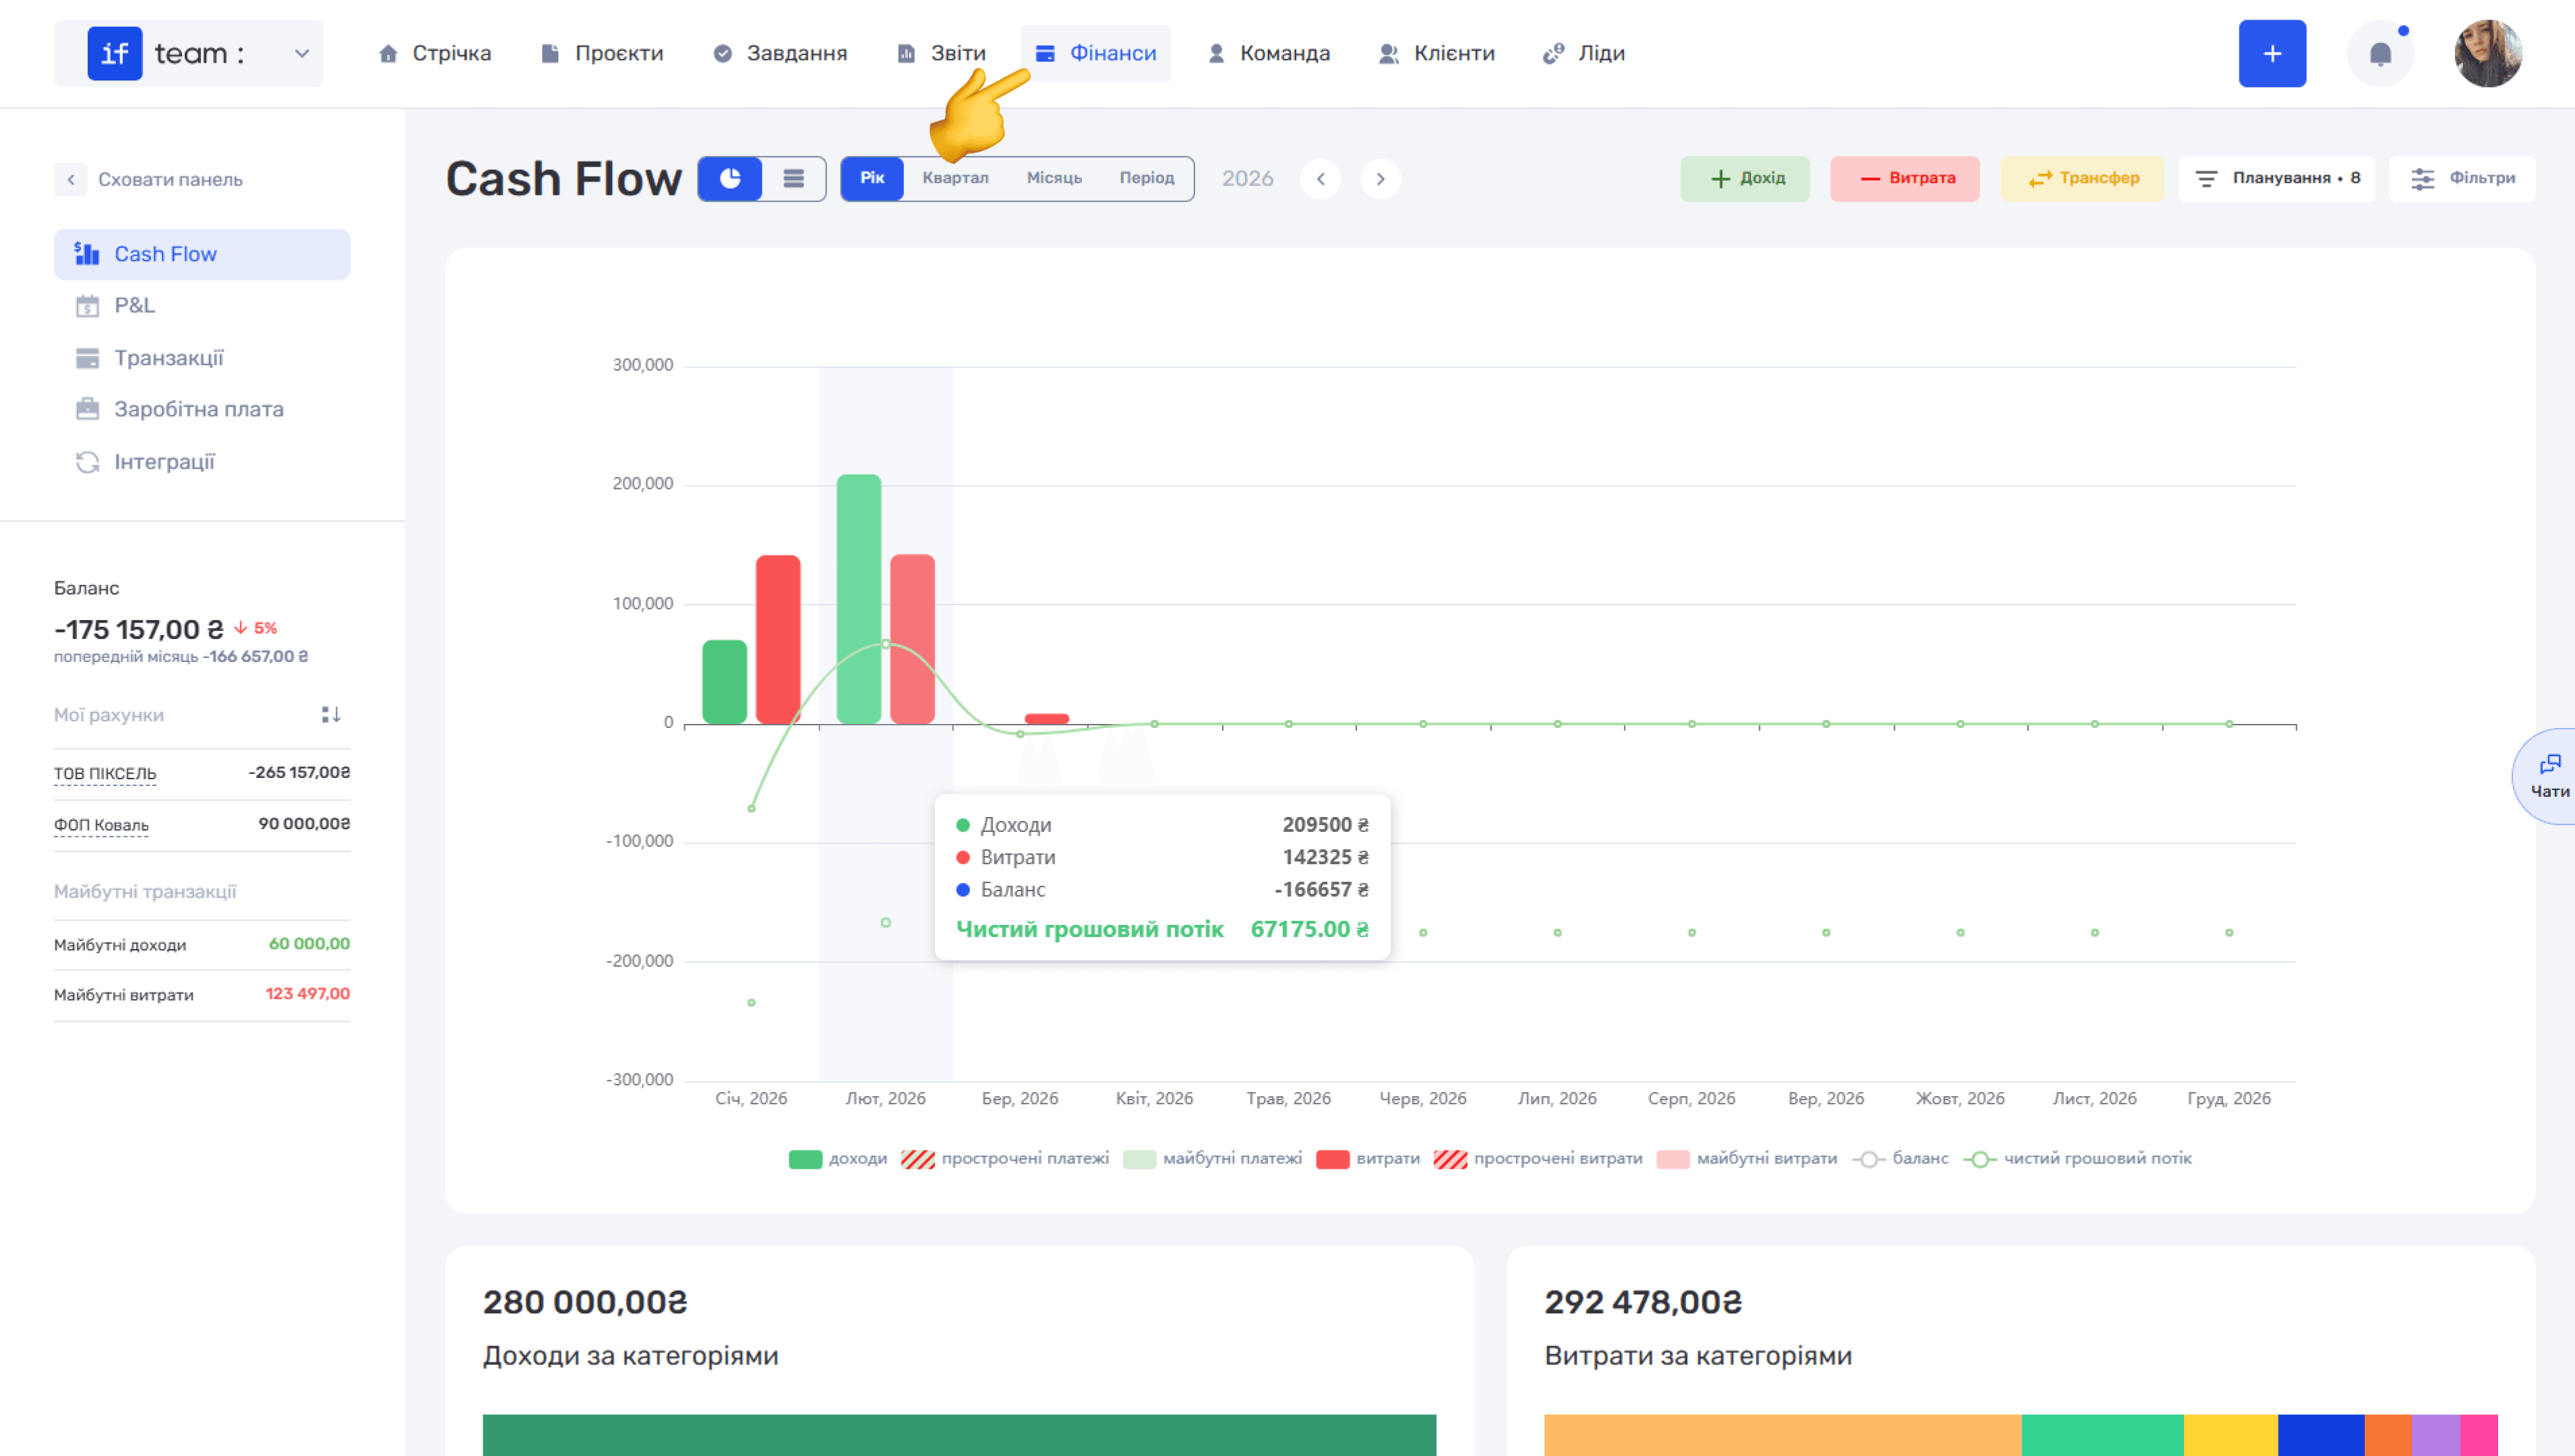
Sidebar
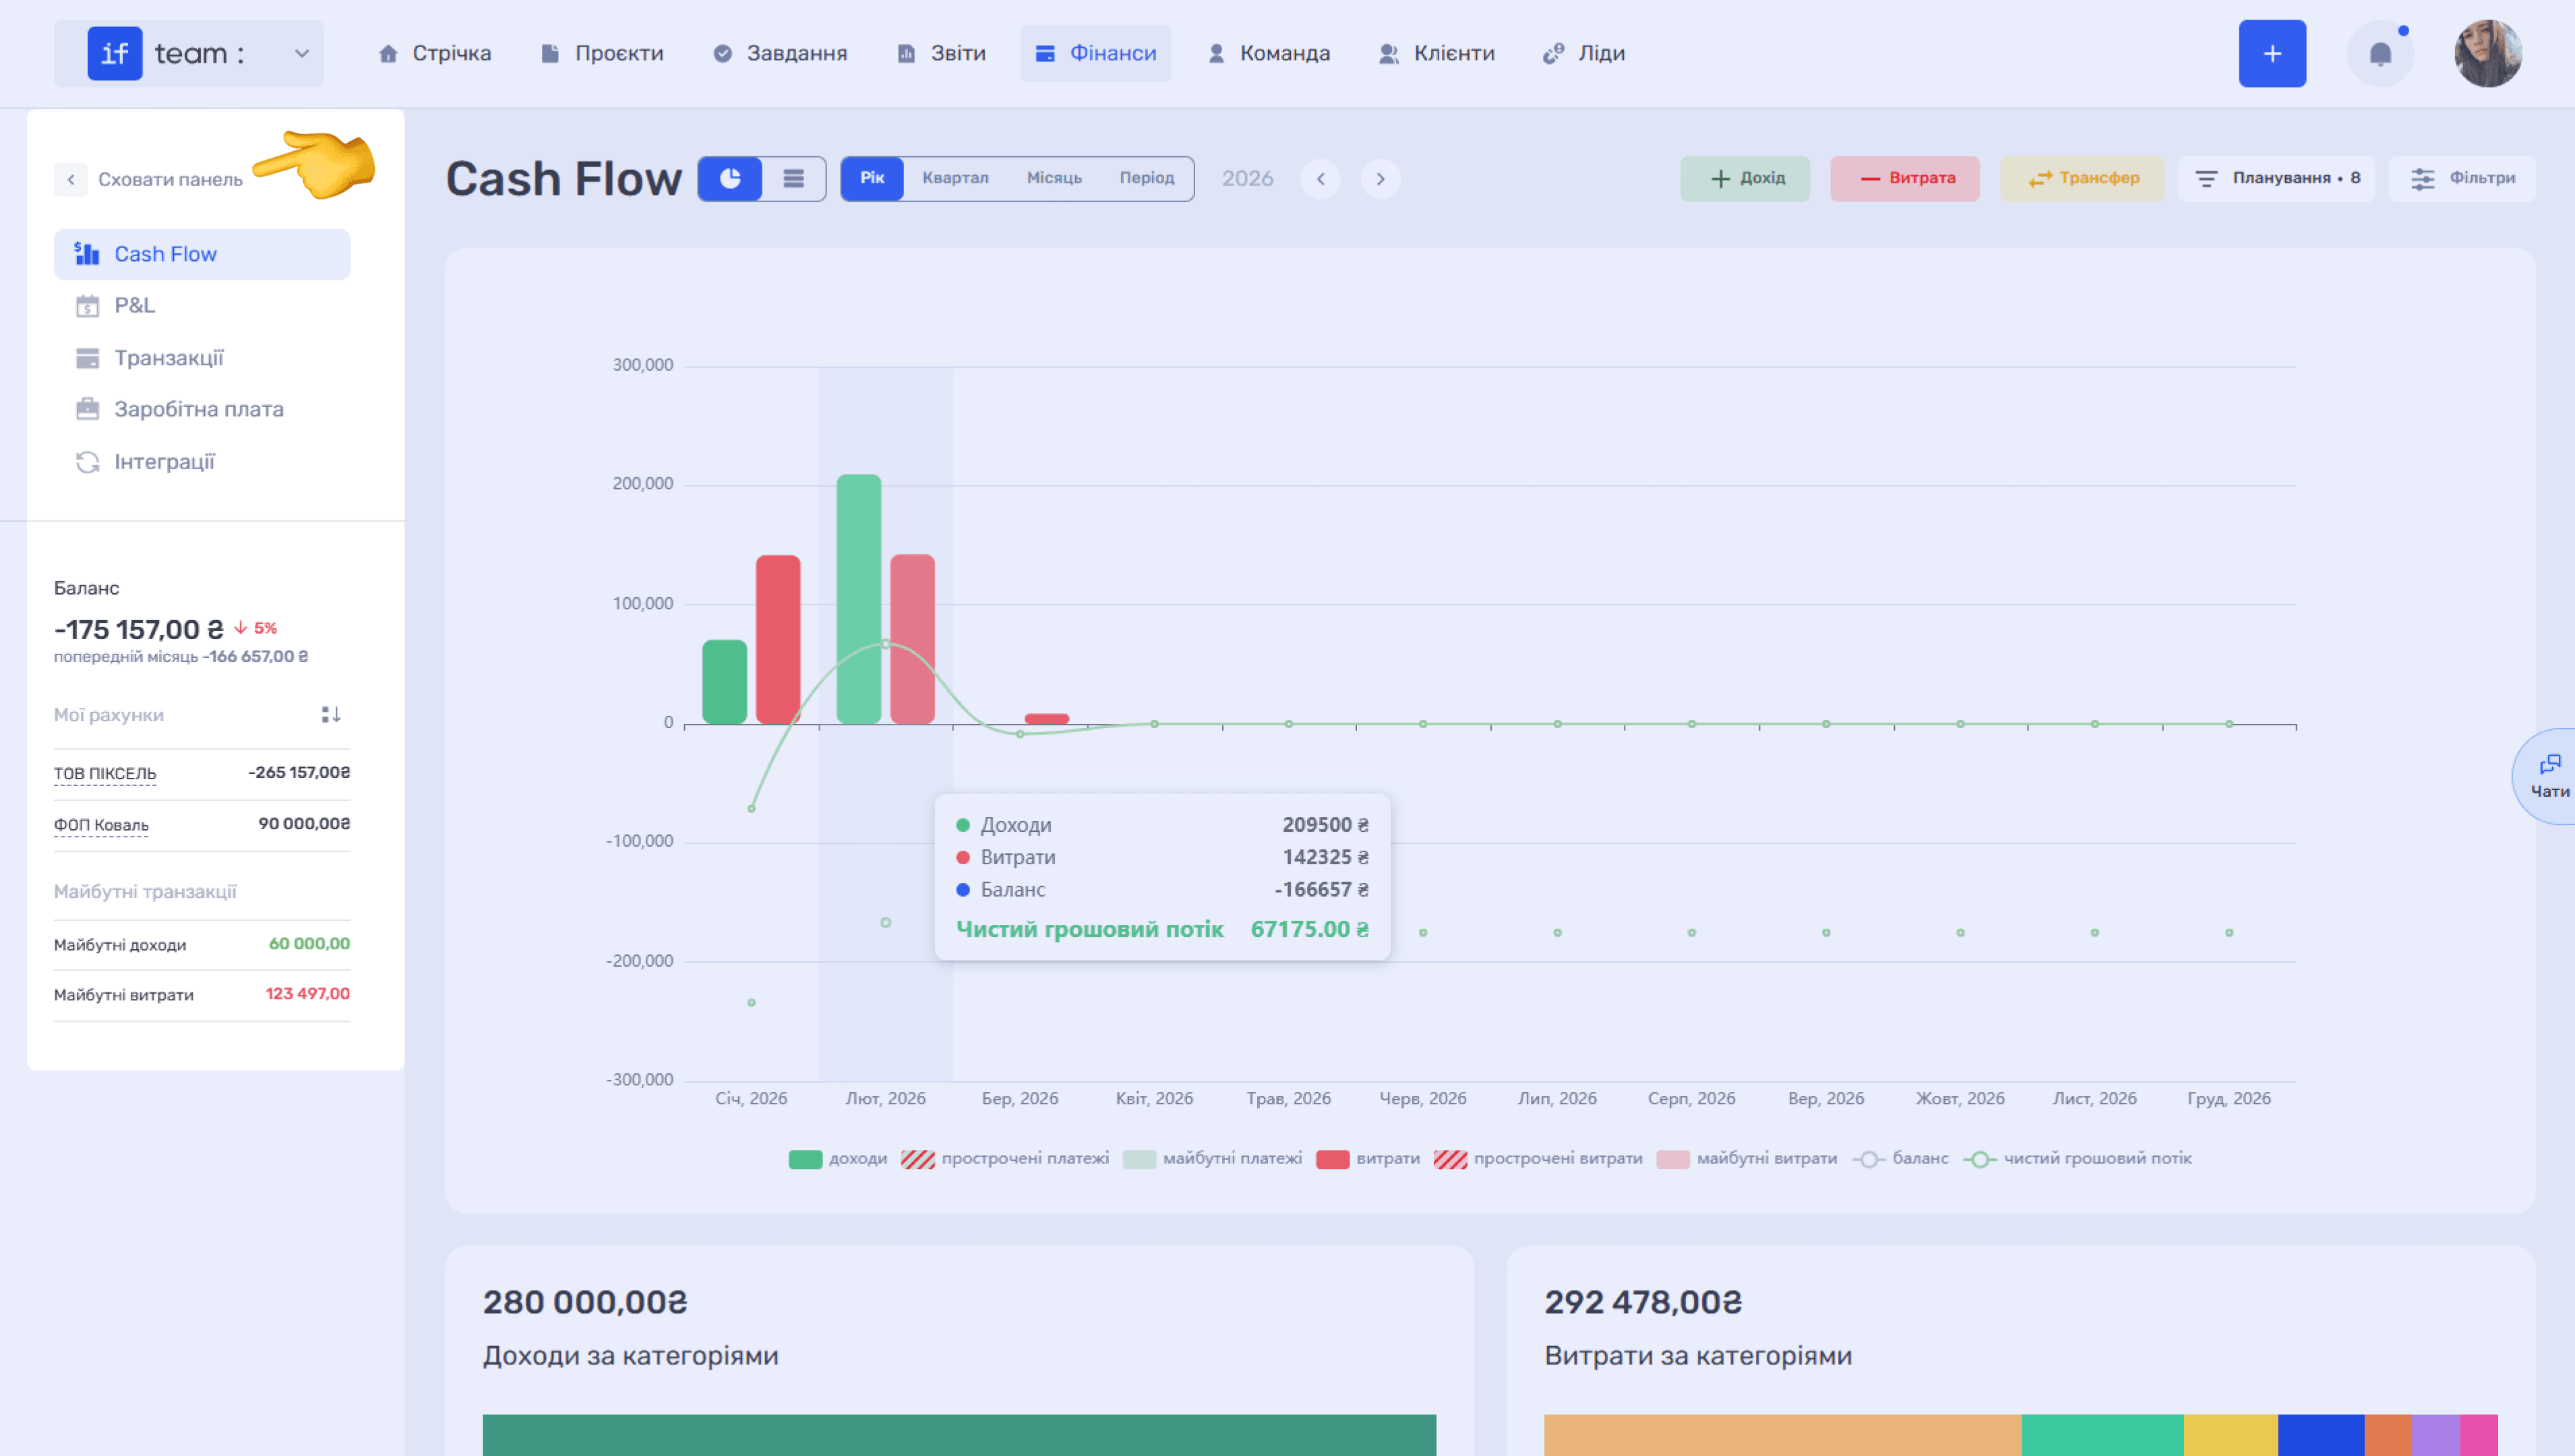
In addition to subsection navigation, the left sidebar displays general company financial information: the current company balance with its percentage change from the previous month, all accounts with balances in different currencies, and future income and expense amounts. Click Hide Panel to collapse it.
Cash Flow
The Cash Flow subsection shows company cash movement—all incoming funds, expenses, and balances for the selected period. It lets you analyze monthly cash-flow trends, quickly identify periods with a negative balance, and detect potential cash gaps in advance.
Views. Two view switches appear at the top of the page. Chart view, represented by the chart icon, visualizes data as a bar chart: green bars are income, red bars are expenses, and the line is the balance. Hovering over the chart displays a tooltip with the exact income, expense, and net cash-flow amounts.
Below the chart are totals for the selected period: total income and expenses by category as colored bars with percentages and amounts, followed by a list of all transactions.
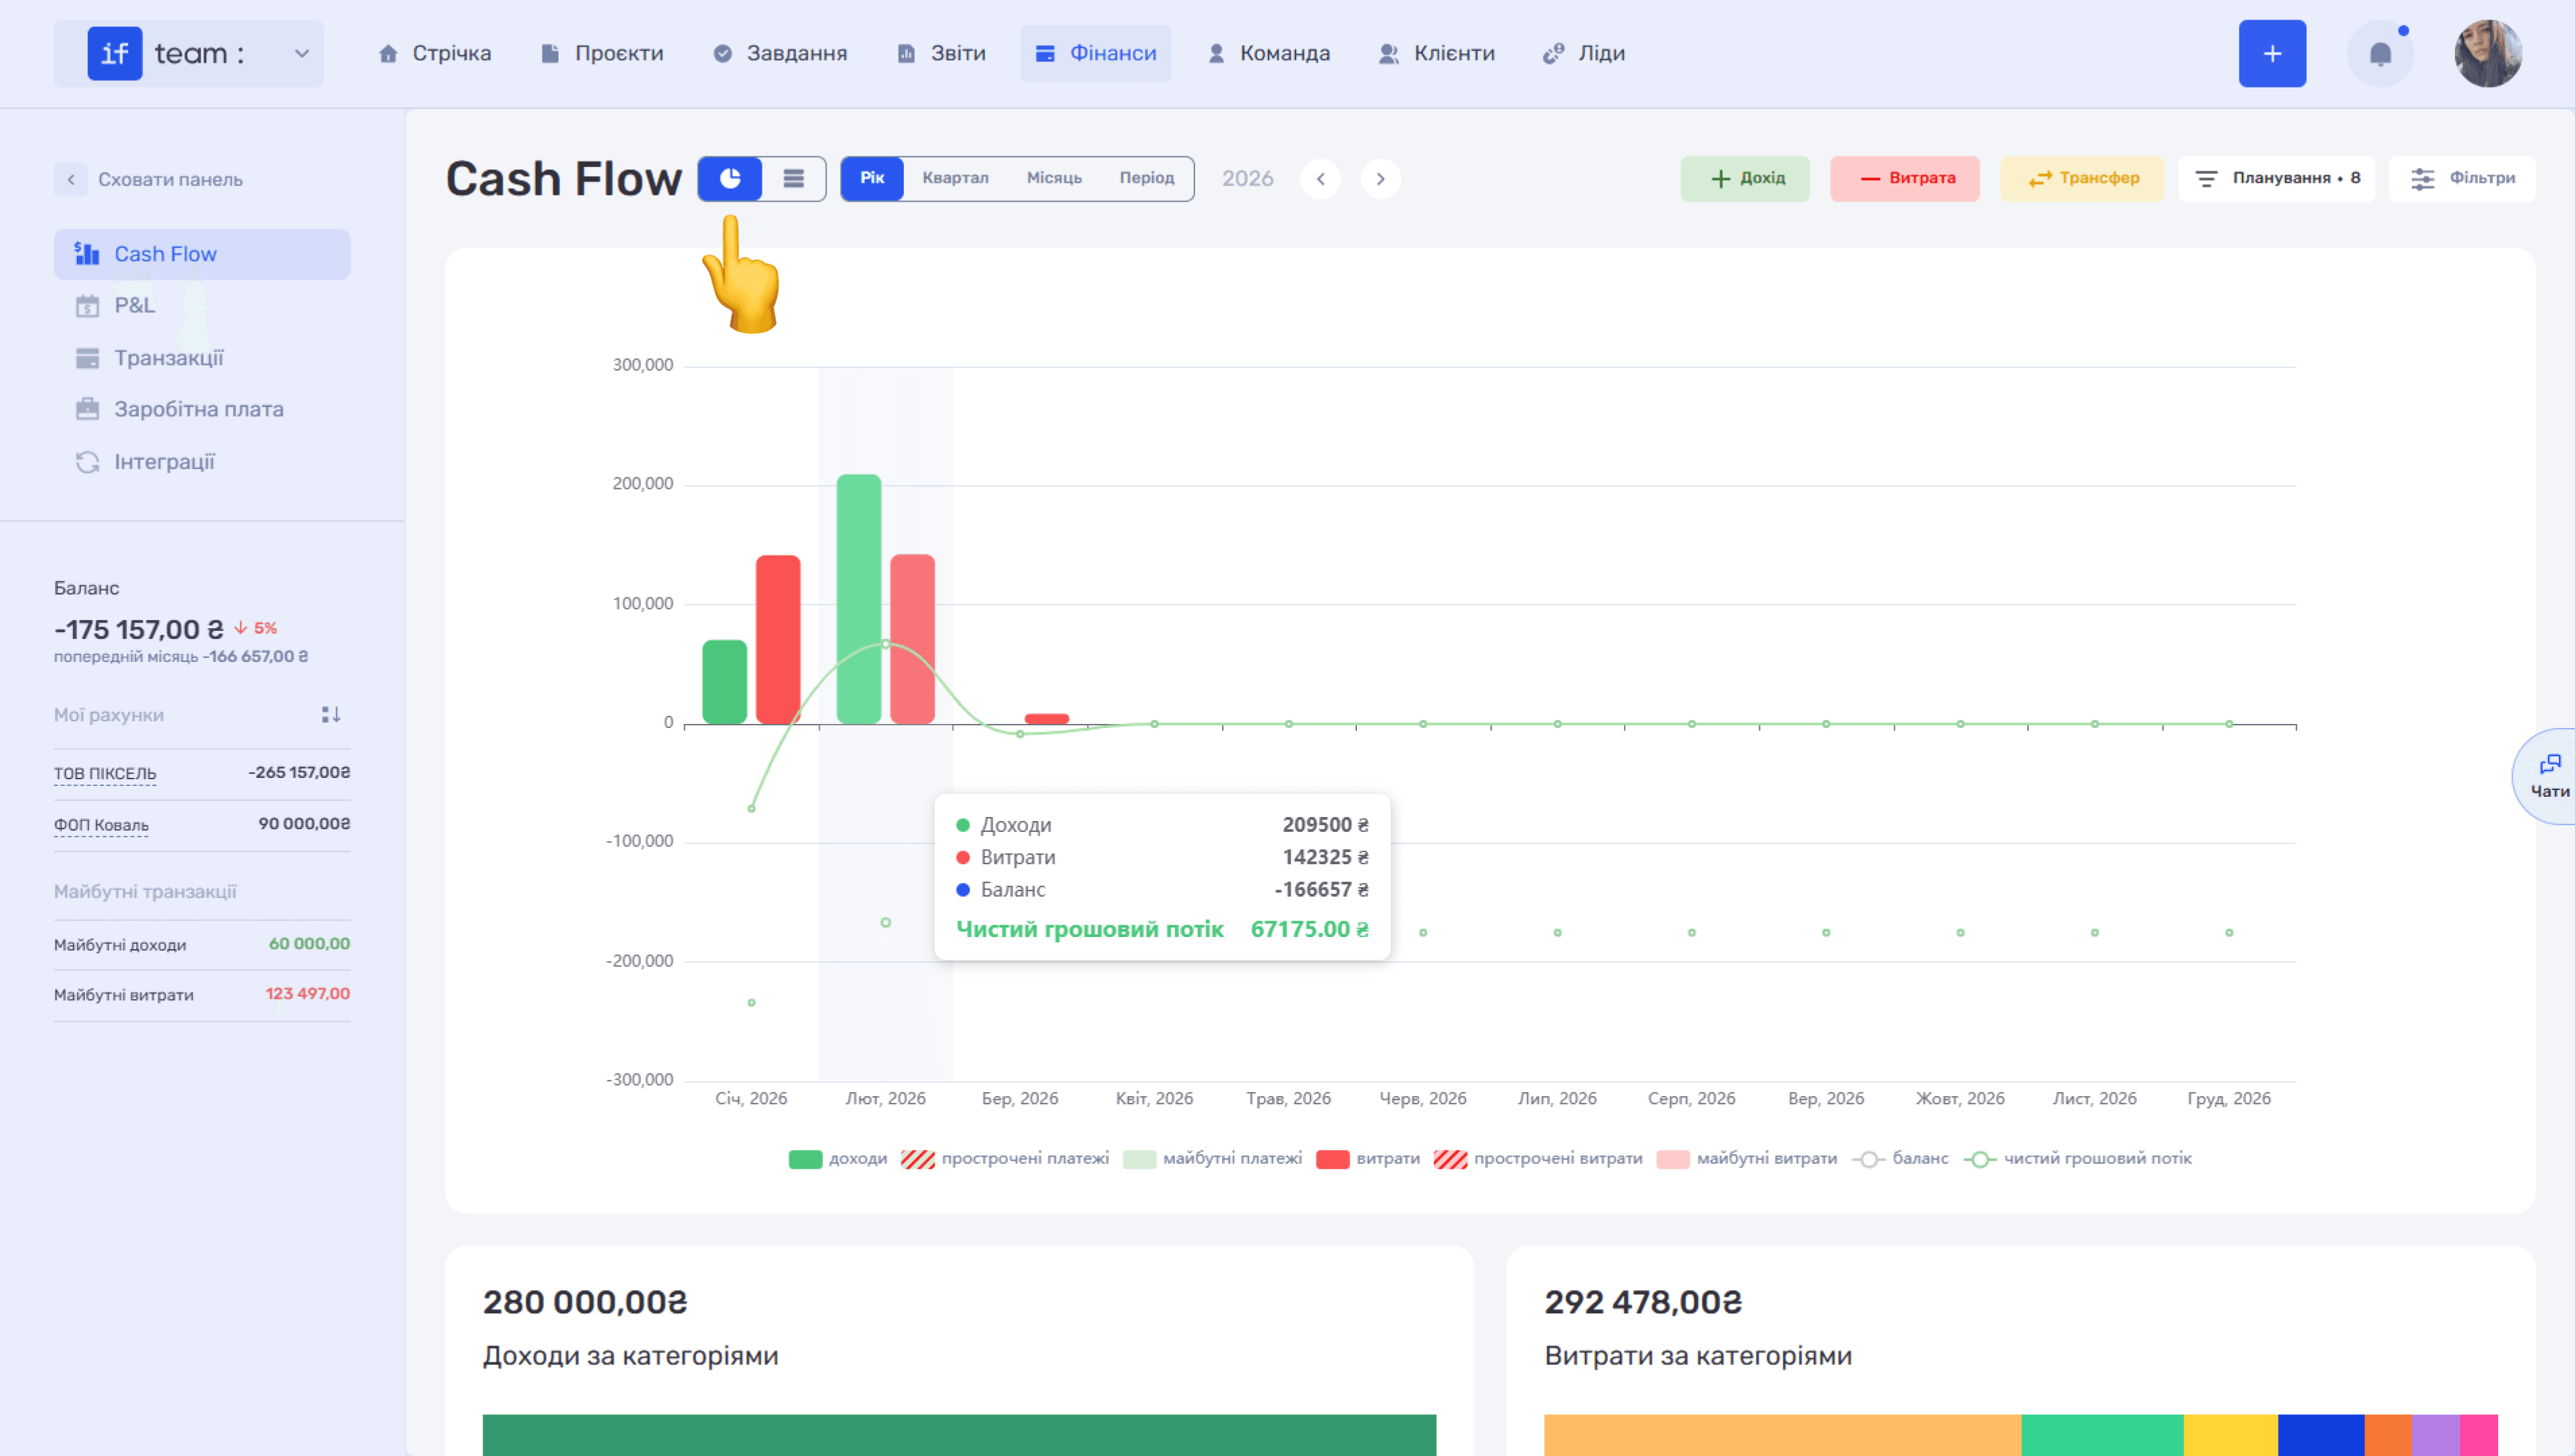
Table view, represented by the list icon, breaks down cash flow by month in a detailed table. For each month, you see the opening balance, income and expenses by category, net cash flow, and closing balance. The final Total column summarizes the entire selected period.
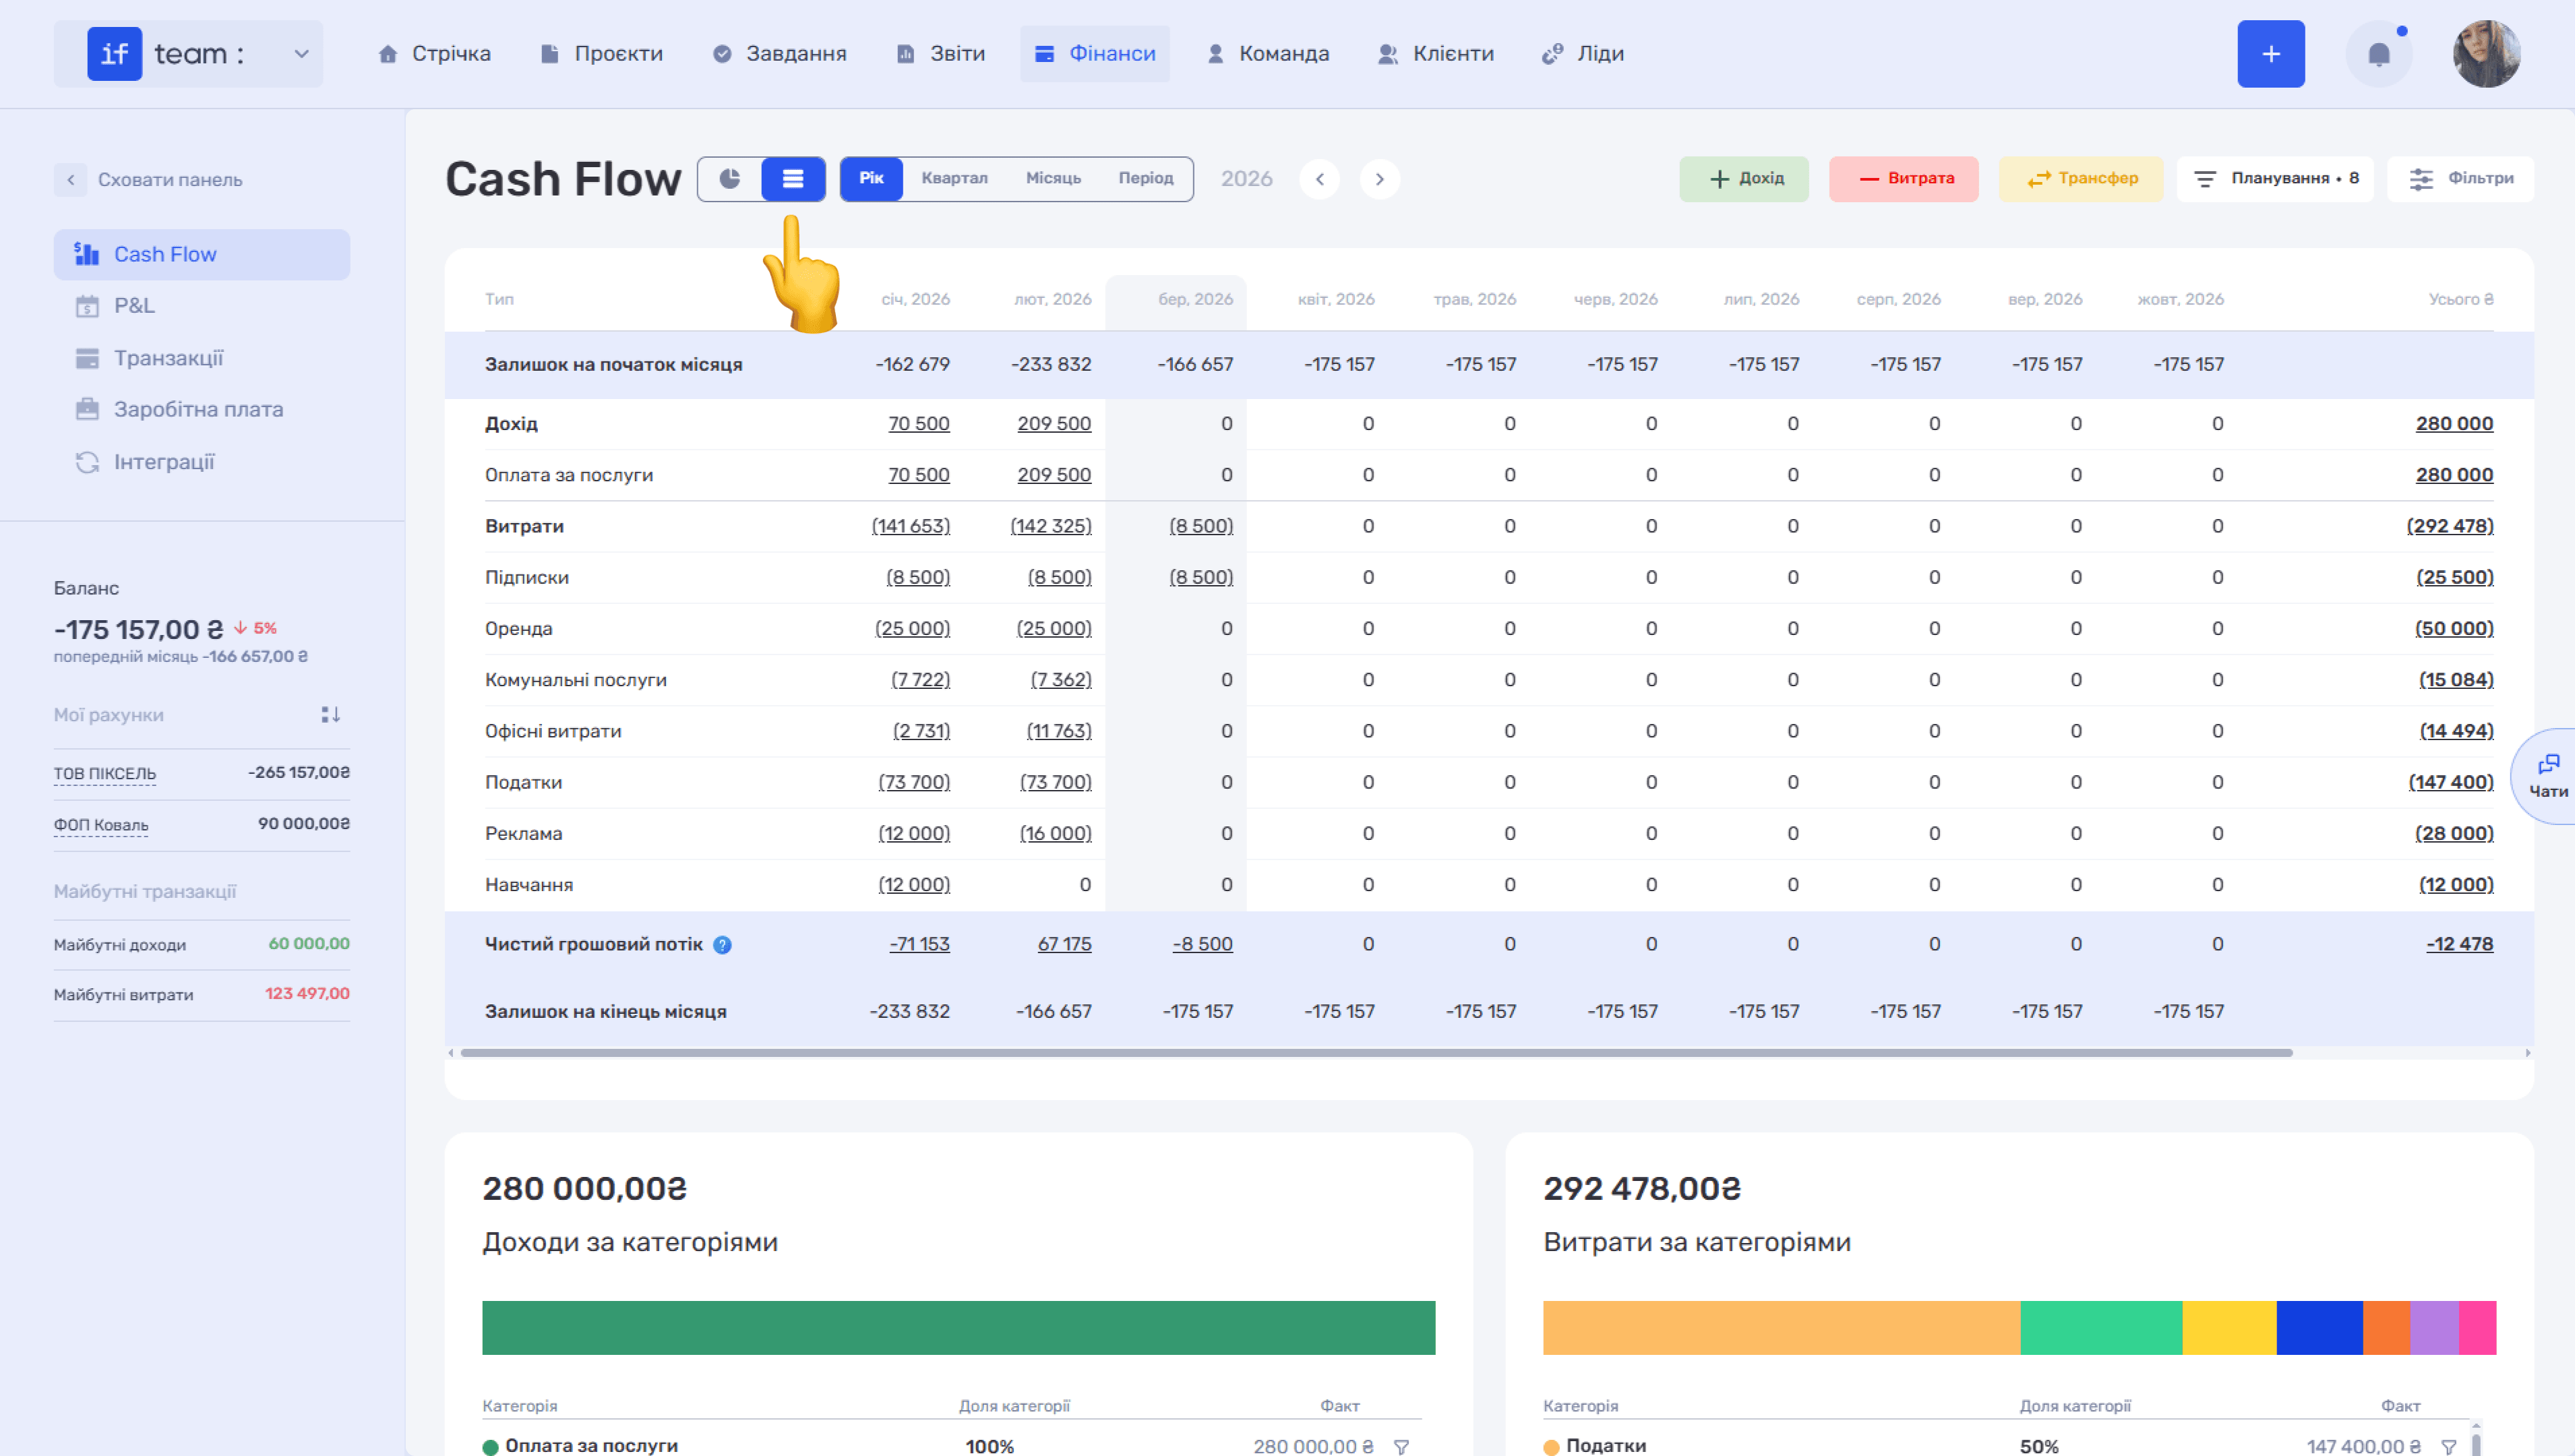
Table and chart views are synchronized and use the same data, filters, and period, so you can switch freely between an overall view on the chart and a specific figure in the table. To see what a specific figure consists of, click the amount in any table cell to open the transactions that make up that amount.
Period. Select the data scale: Year, Quarter, Month, or a custom date range under Period. The arrows move between periods. When you select Period, a field with editable dates appears.
To set a range, click the calendar icon, use the arrows to select the required year, and click a month to set the beginning of the period. Then select the year and month for the end date in the same way. If you need only one specific month, click it twice.
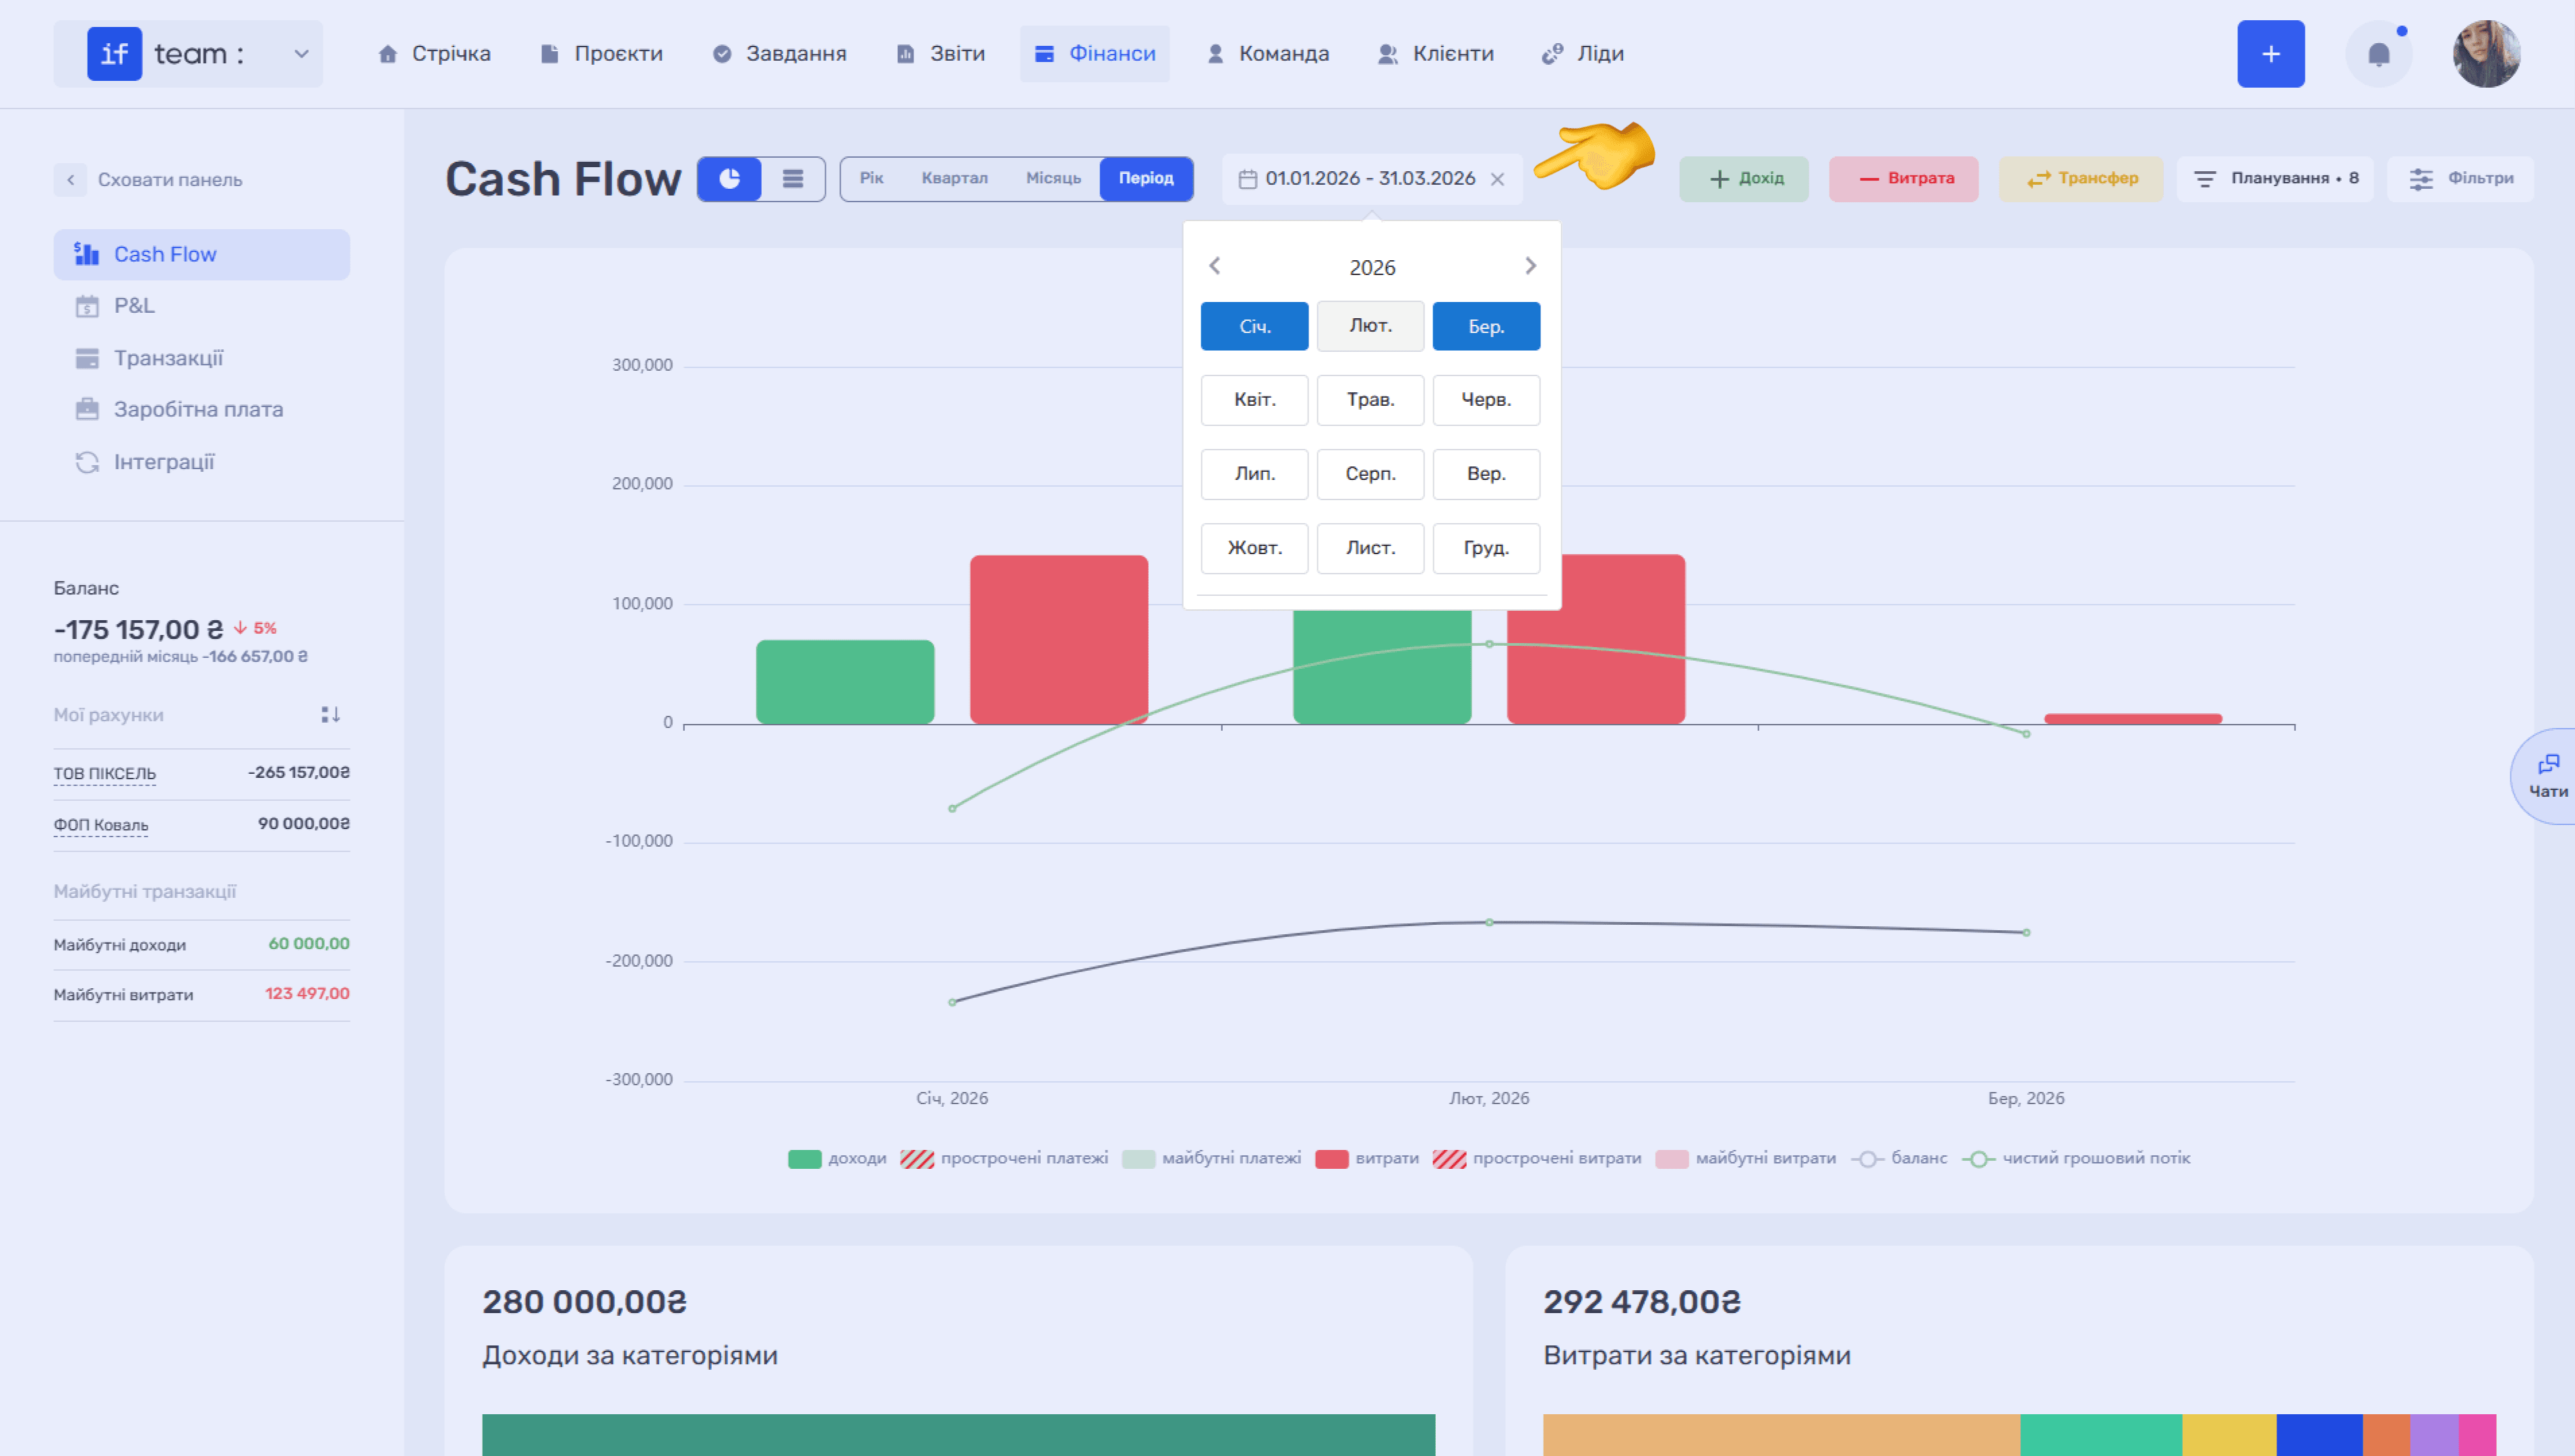
Adding Transactions. The buttons in the top panel let you quickly add a new transaction: green + Income, red − Expense, or yellow Transfer, which moves funds between accounts.
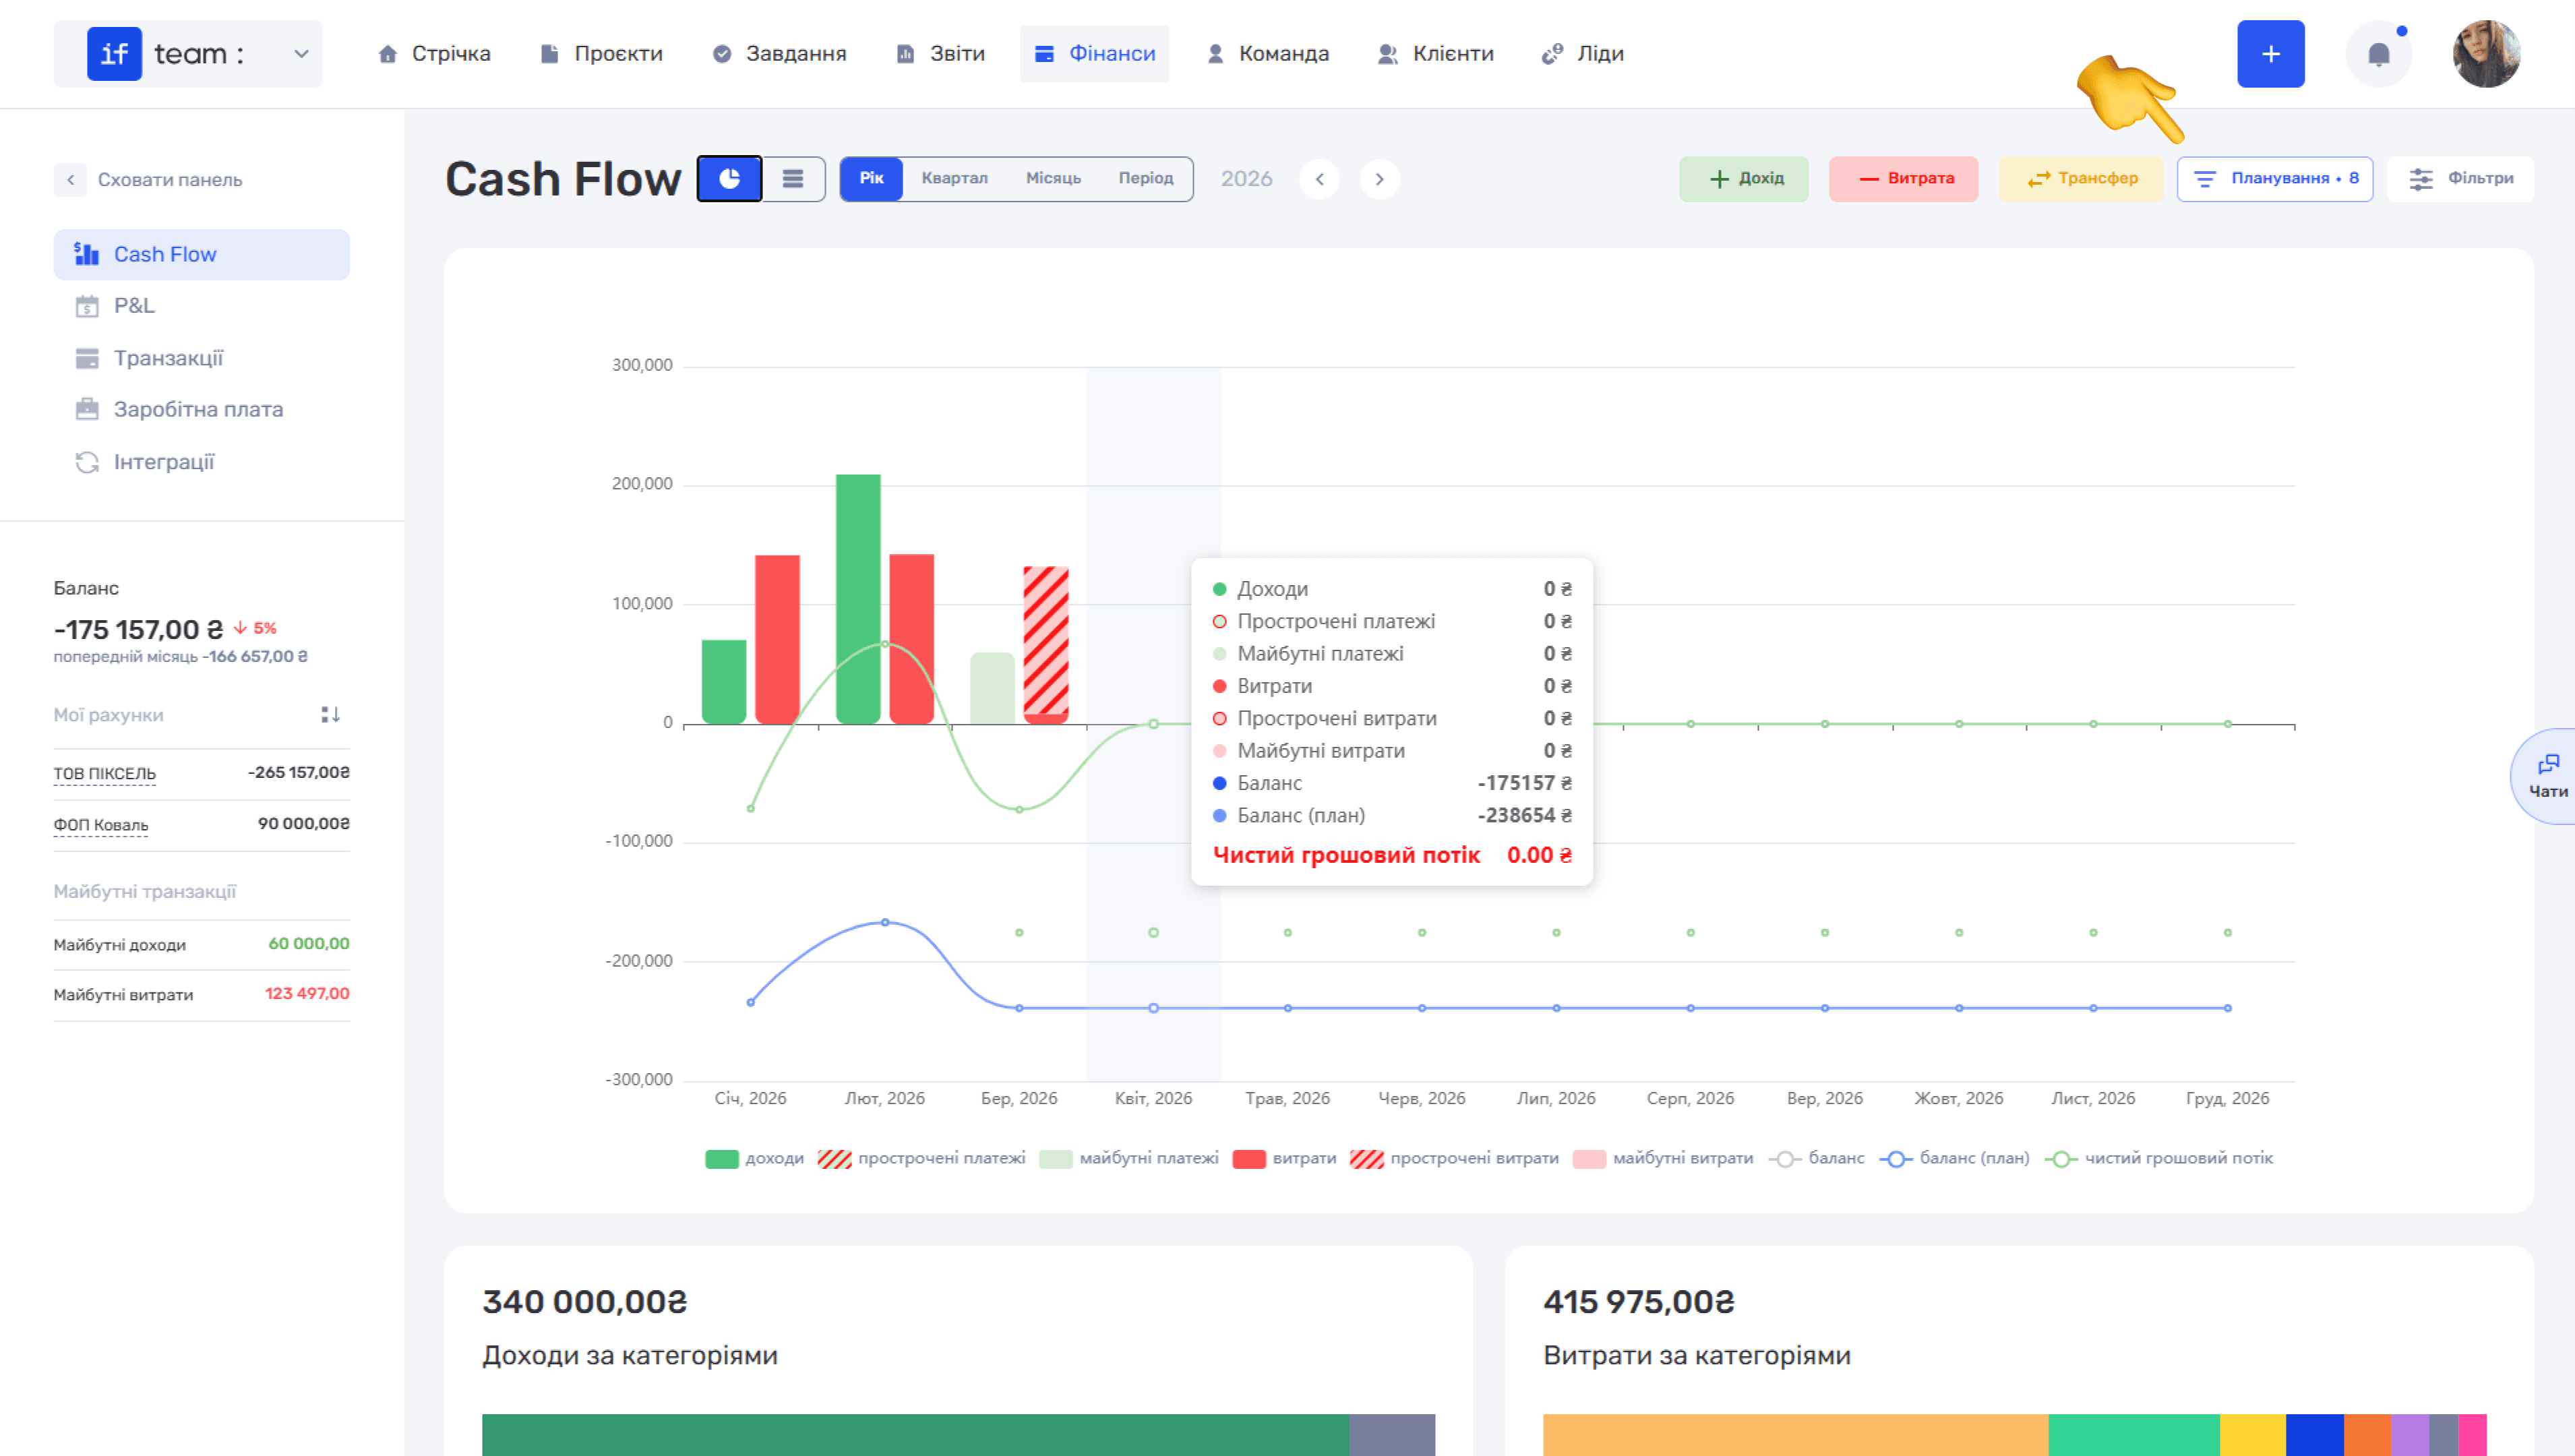
Planning. The Planning button with a counter shows the number of planned transactions. Click it to show or hide planned payments. When planning is active, additional rows appear in the table and additional elements appear on the chart: future income and expenses as semi-transparent green and red bars, and a second Balance (Plan) line that includes planned payments and helps forecast the company’s financial position. The hover tooltip also shows overdue payments, future payments, overdue expenses, future expenses, and the planned balance.
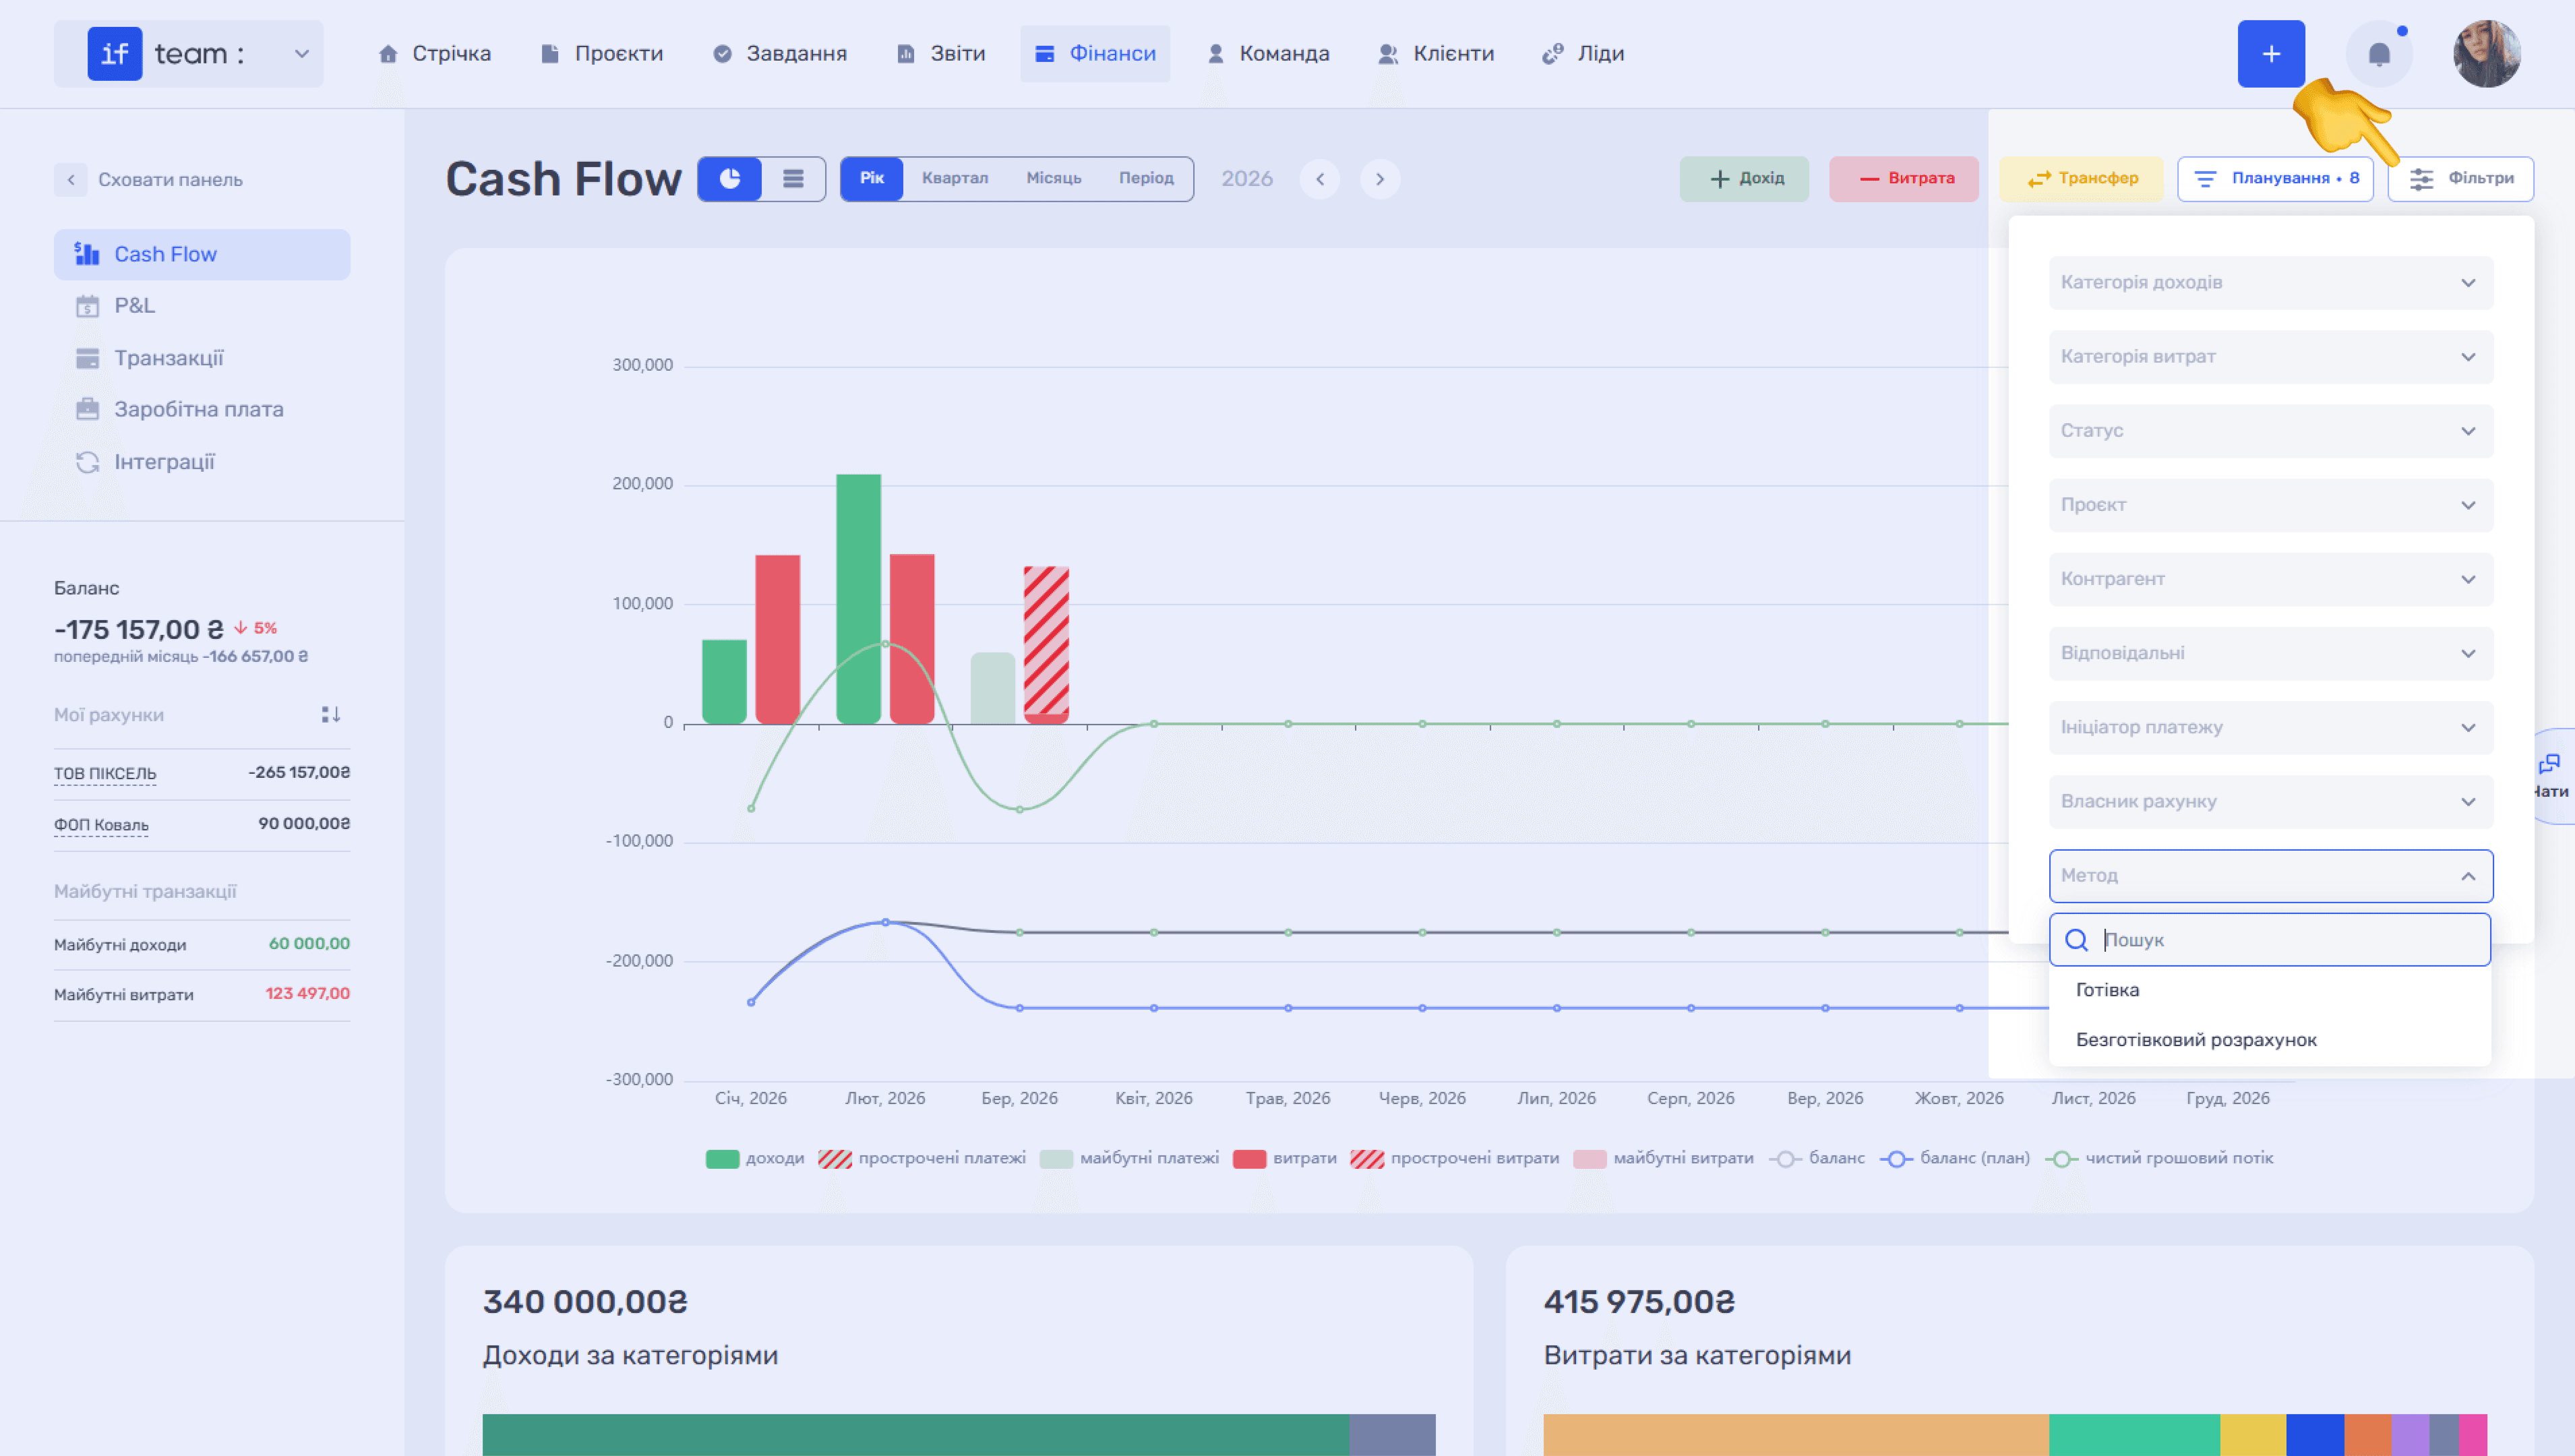
Filters. Click Filters to open a panel with options such as income category, expense category, status, project, counterparty, responsible employees, payment initiator, and account owner. For example, this lets you view cash movement for only a specific project or counterparty.
P&L (Profit & Loss)
The P&L subsection is the company’s profit and loss report. It shows how much the company earned, how much it spent, and the financial result for the selected period.
Views. Like Cash Flow, P&L has chart and table views. Chart view shows a bar chart of income and expenses with a balance line, followed by a list of transactions.
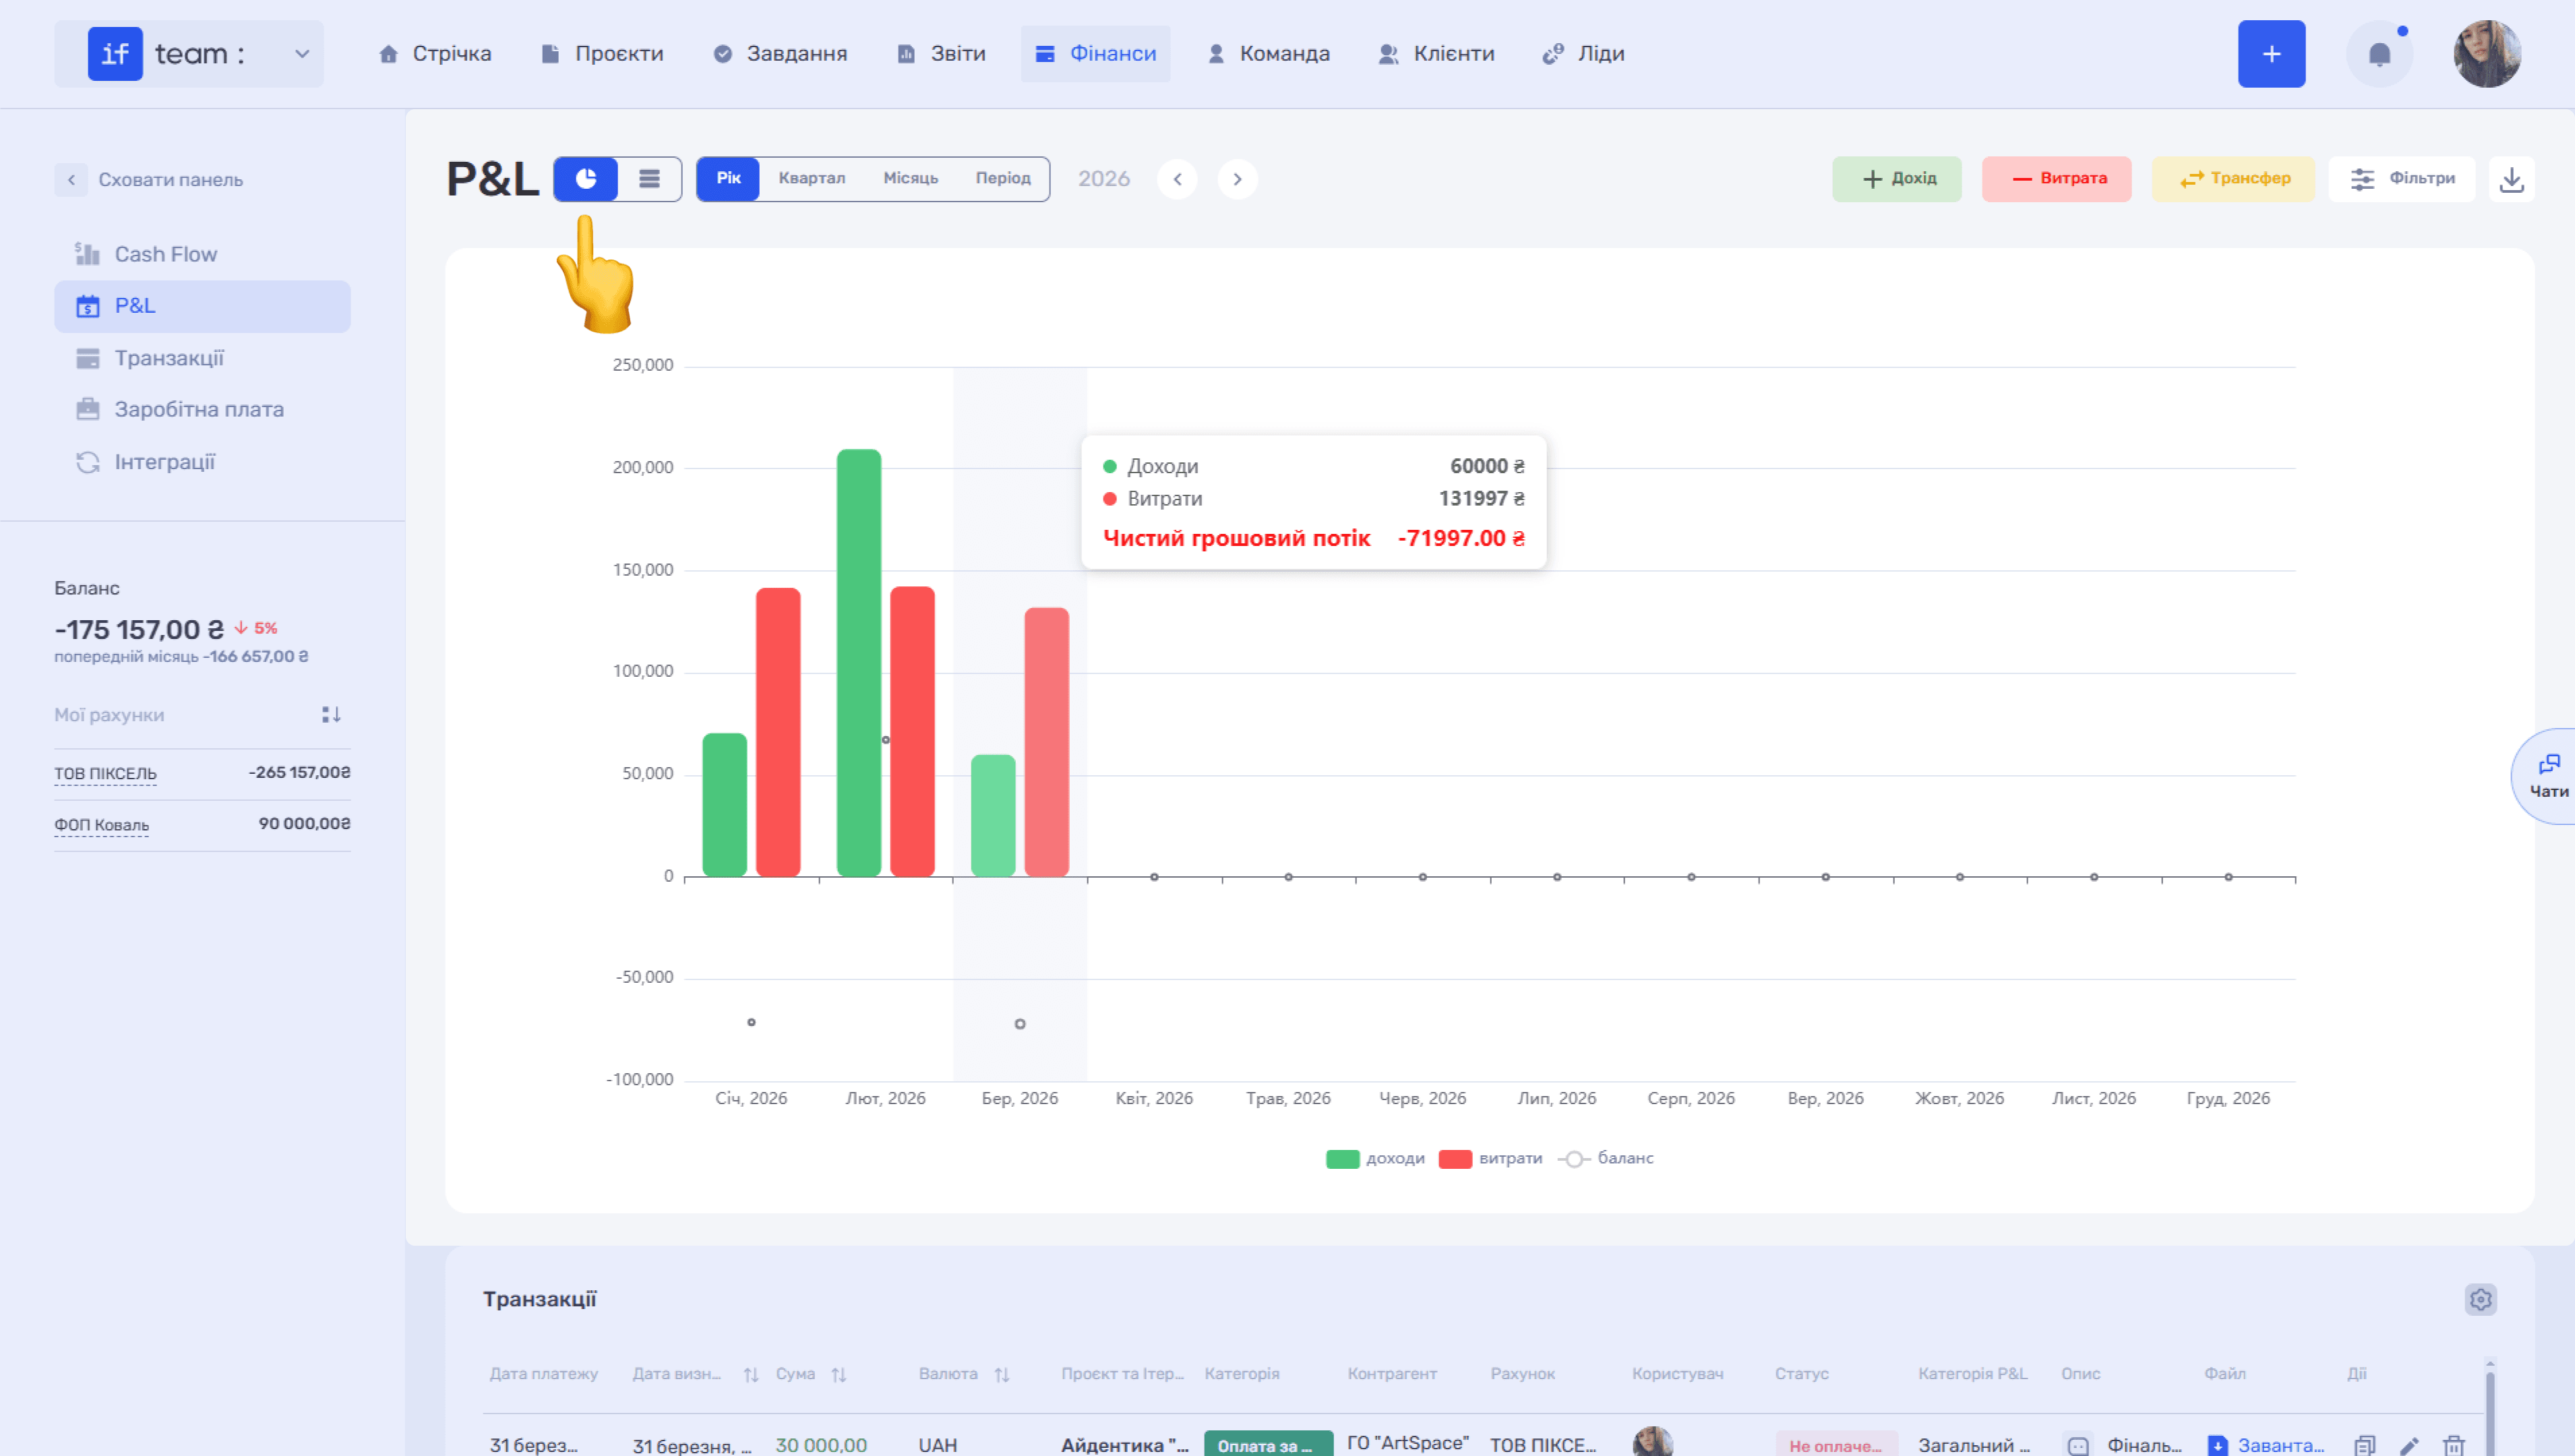
Table view displays the complete financial report with key monthly metrics: total income broken down by category, project expenses, gross profit, operating expenses and EBITDA including percentages, non-operating income and expenses, EBT or company profit before tax, taxes, net profit and profitability, dividend payments, recapitalization, and the financial result.
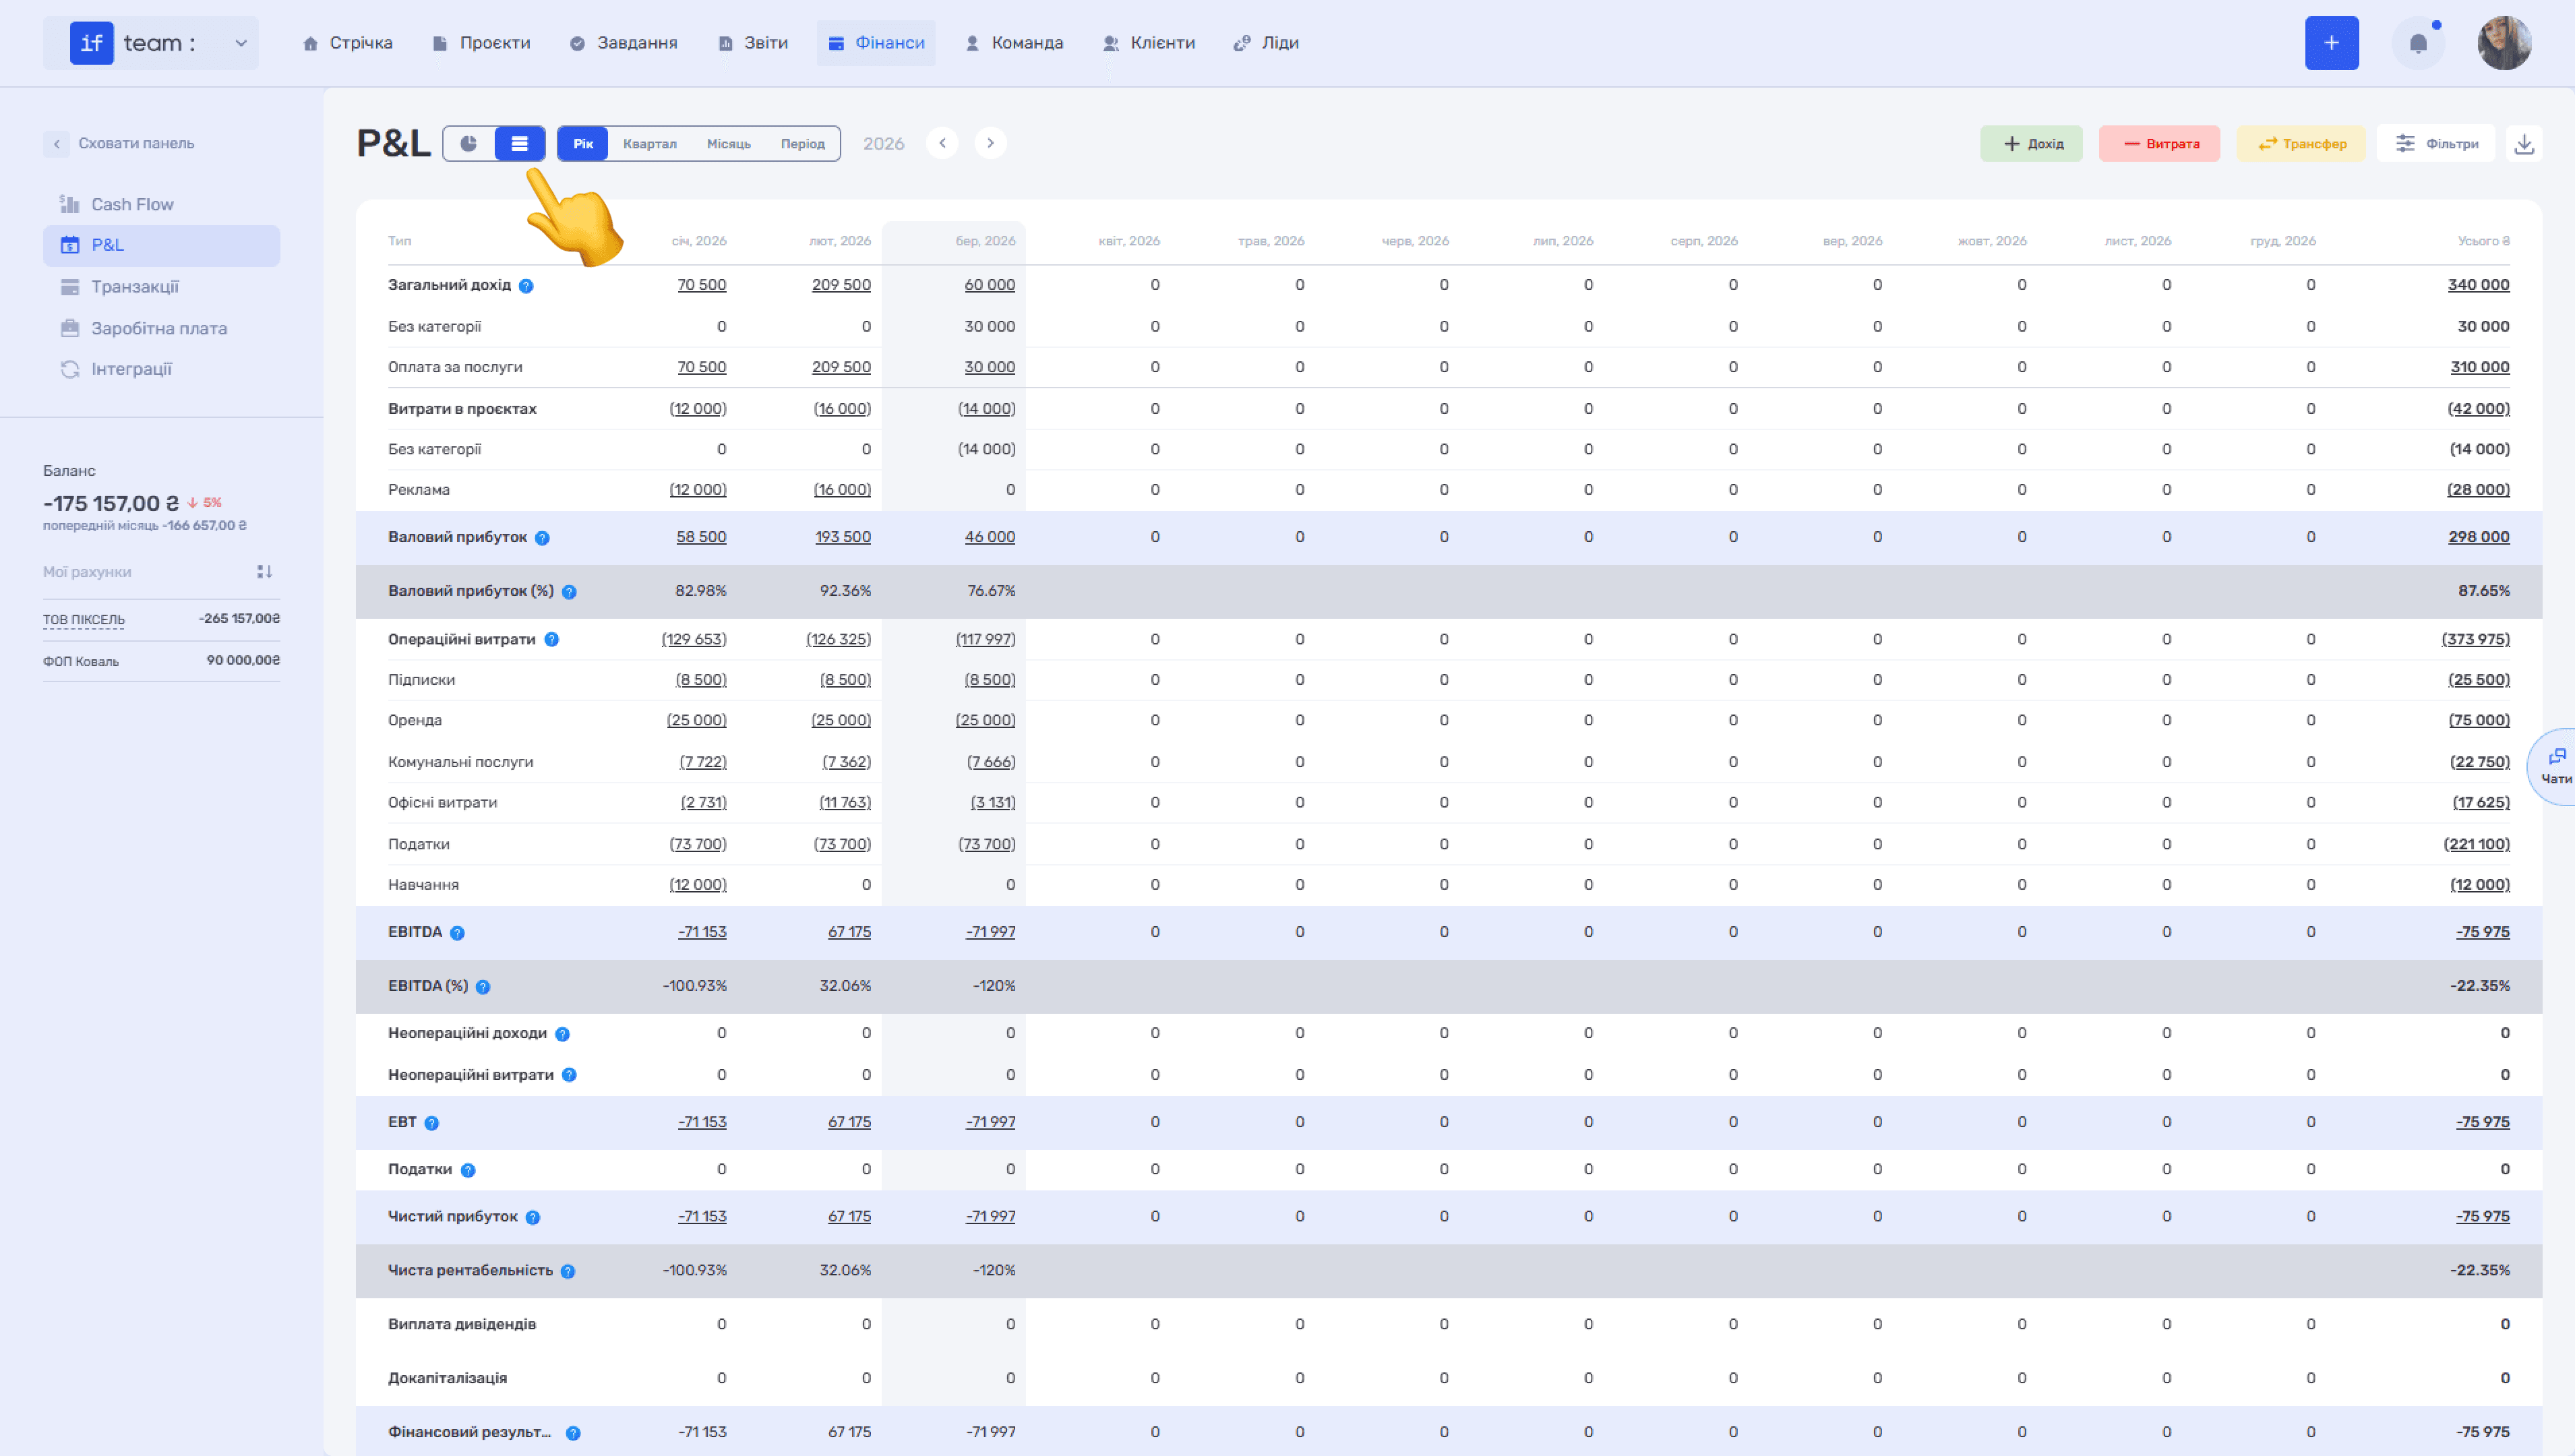
As in Cash Flow, clicking an amount in a P&L table cell opens the transactions that make up that amount.
The final Total column summarizes the entire period, allowing you to immediately assess overall business profitability and understand which expense categories have the greatest effect on the financial result.
Please note
Key metrics such as gross profit, EBITDA, EBT, net profit, and financial result have tooltip icons. Hover over them to see an explanation and the calculation method for each metric.
Period, Filters, Adding Transactions, and Downloading. These work the same way as in Cash Flow. P&L also has a download button—the ⬇ icon in the upper-right corner—that exports the financial report to Excel. The P&L filter set is slightly broader than Cash Flow and additionally includes P&L Category and Account.
Transactions
The Transactions subsection is the complete register of all company financial transactions in one place: income, expenses, and transfers.
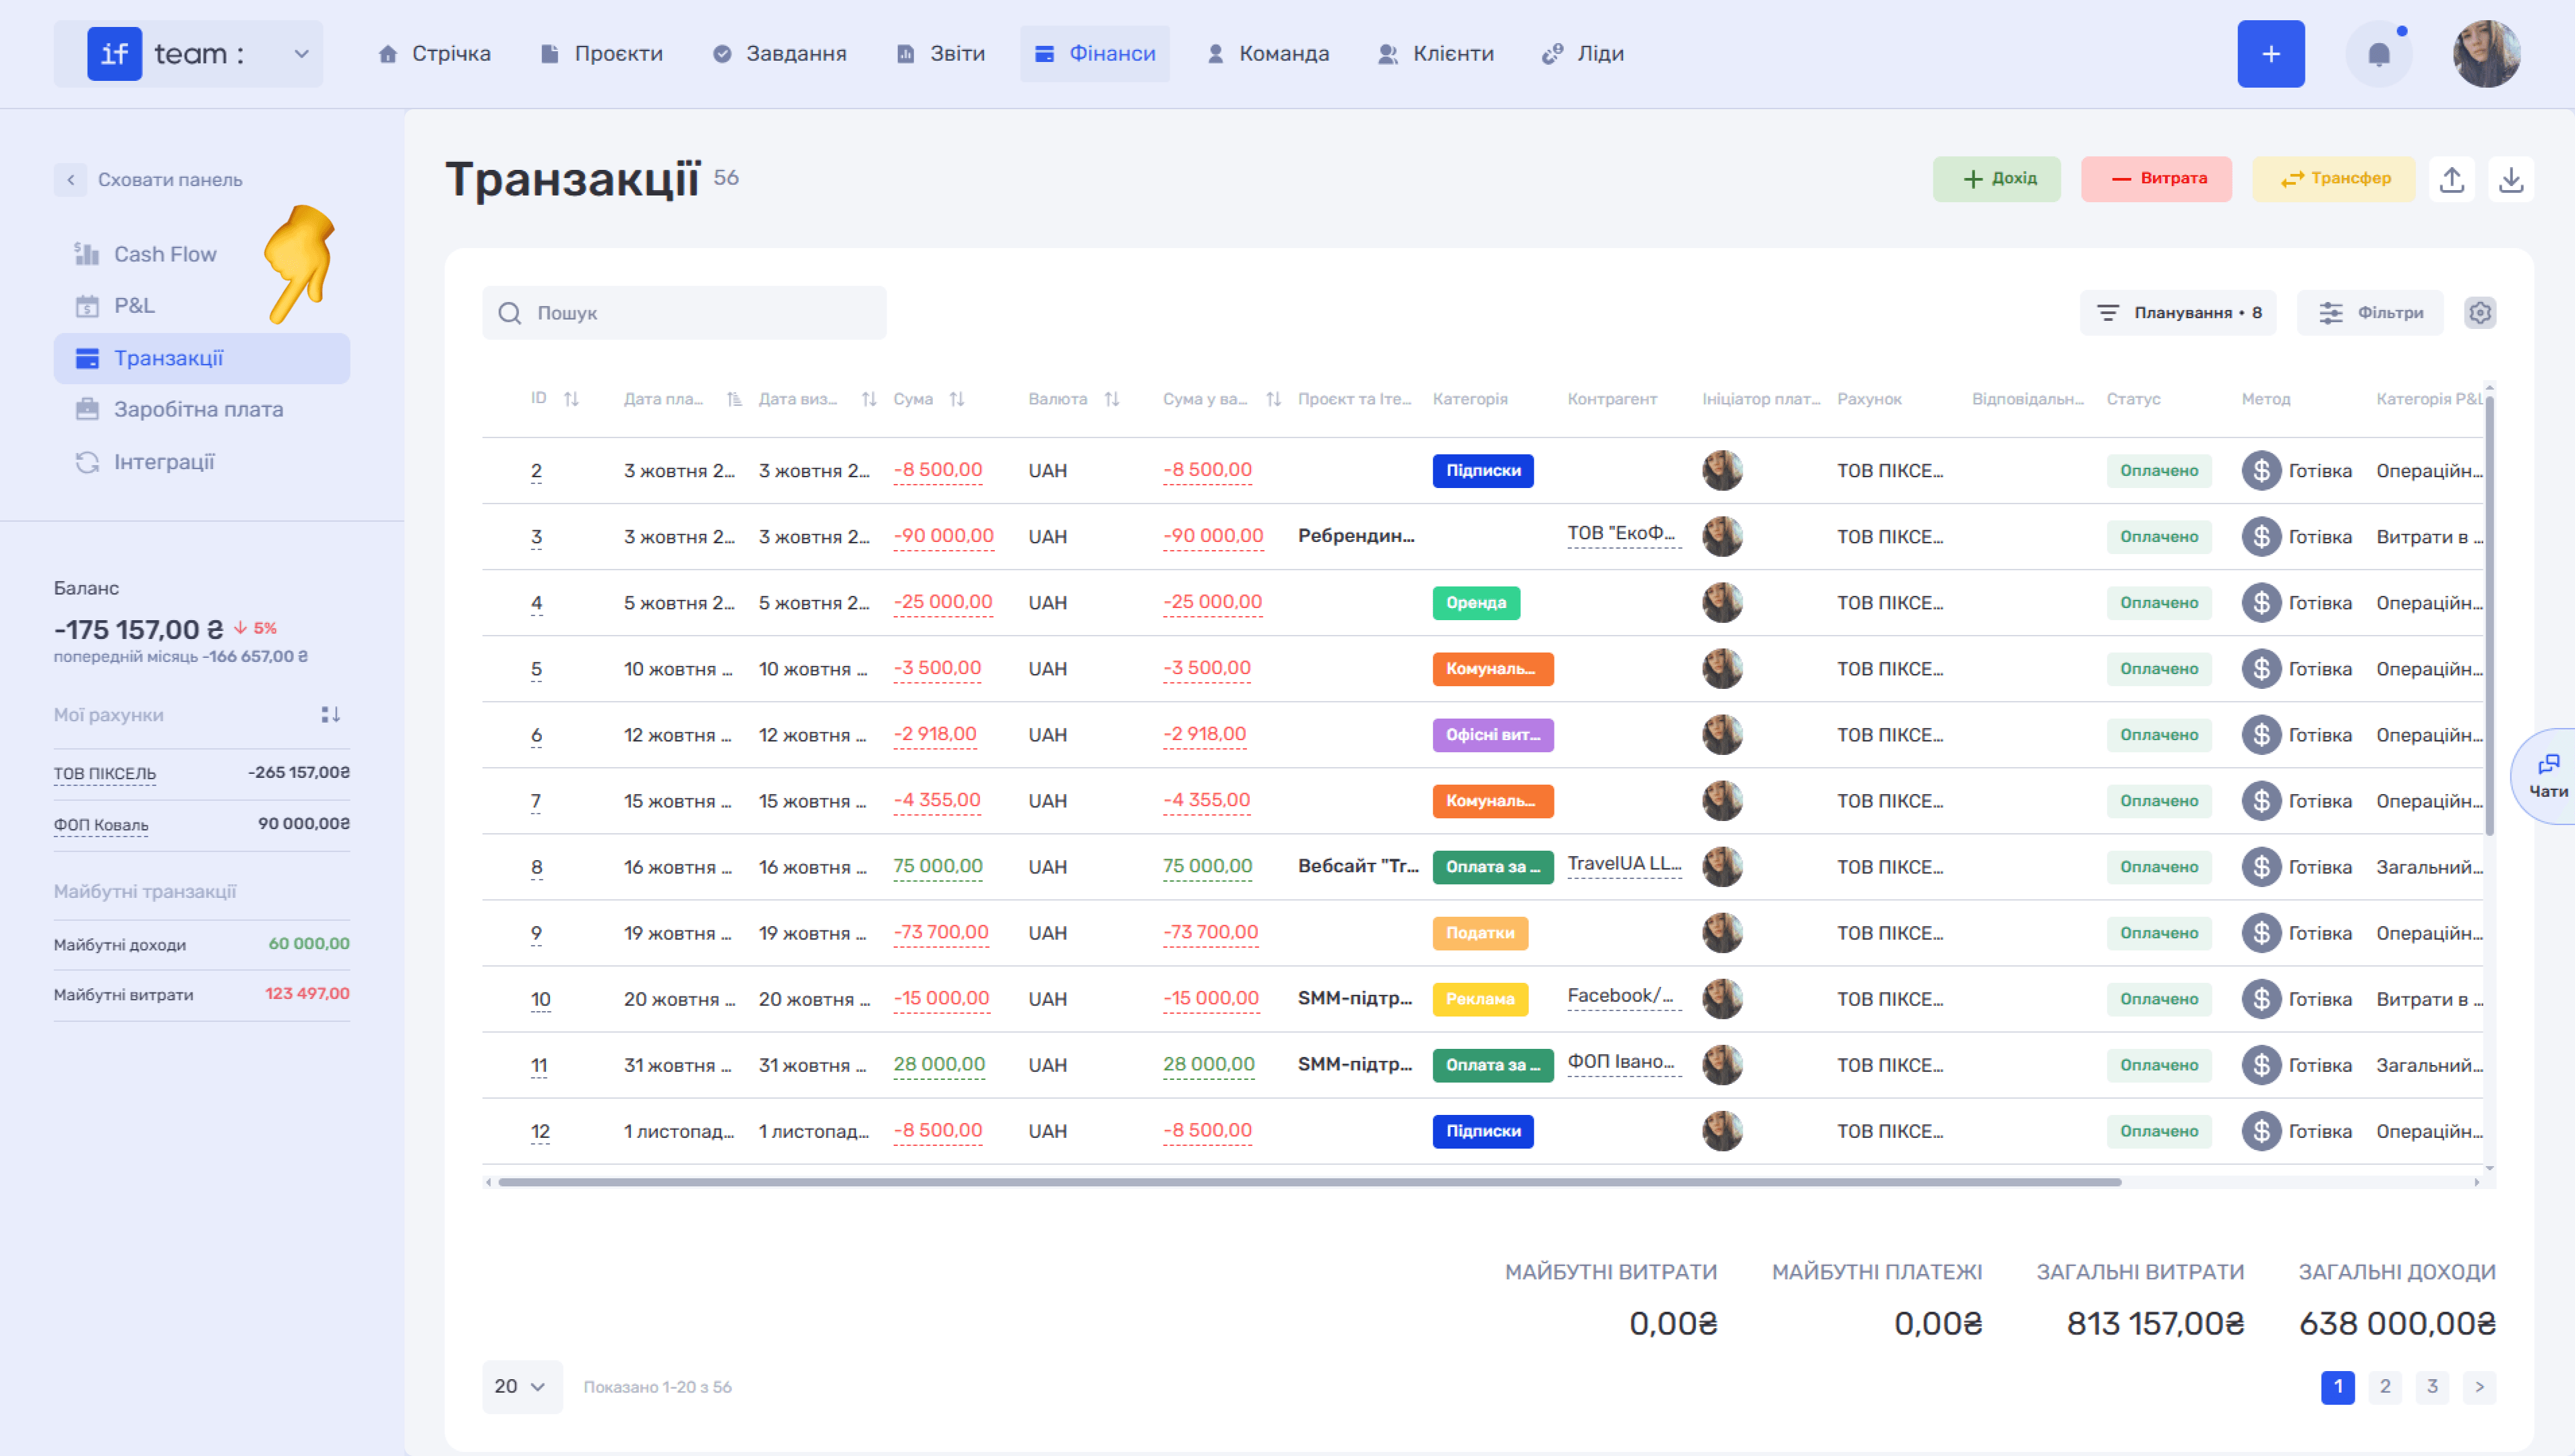
Transactions Table. Each transaction appears as a table row with color coding: green amounts are income and red amounts are expenses. Transaction categories are also shown as colored labels for convenience.
Navigation Within the Table. Many table elements are clickable and provide quick navigation:
- Click an amount or the edit icon (✏) to open the income, expense, or transfer card for viewing and/or editing.
- Click a project name to open that project’s page.
- Click the payment initiator to open the employee card with contact details, position, vacation, and rate history.
Attached files can also be clicked to download them.
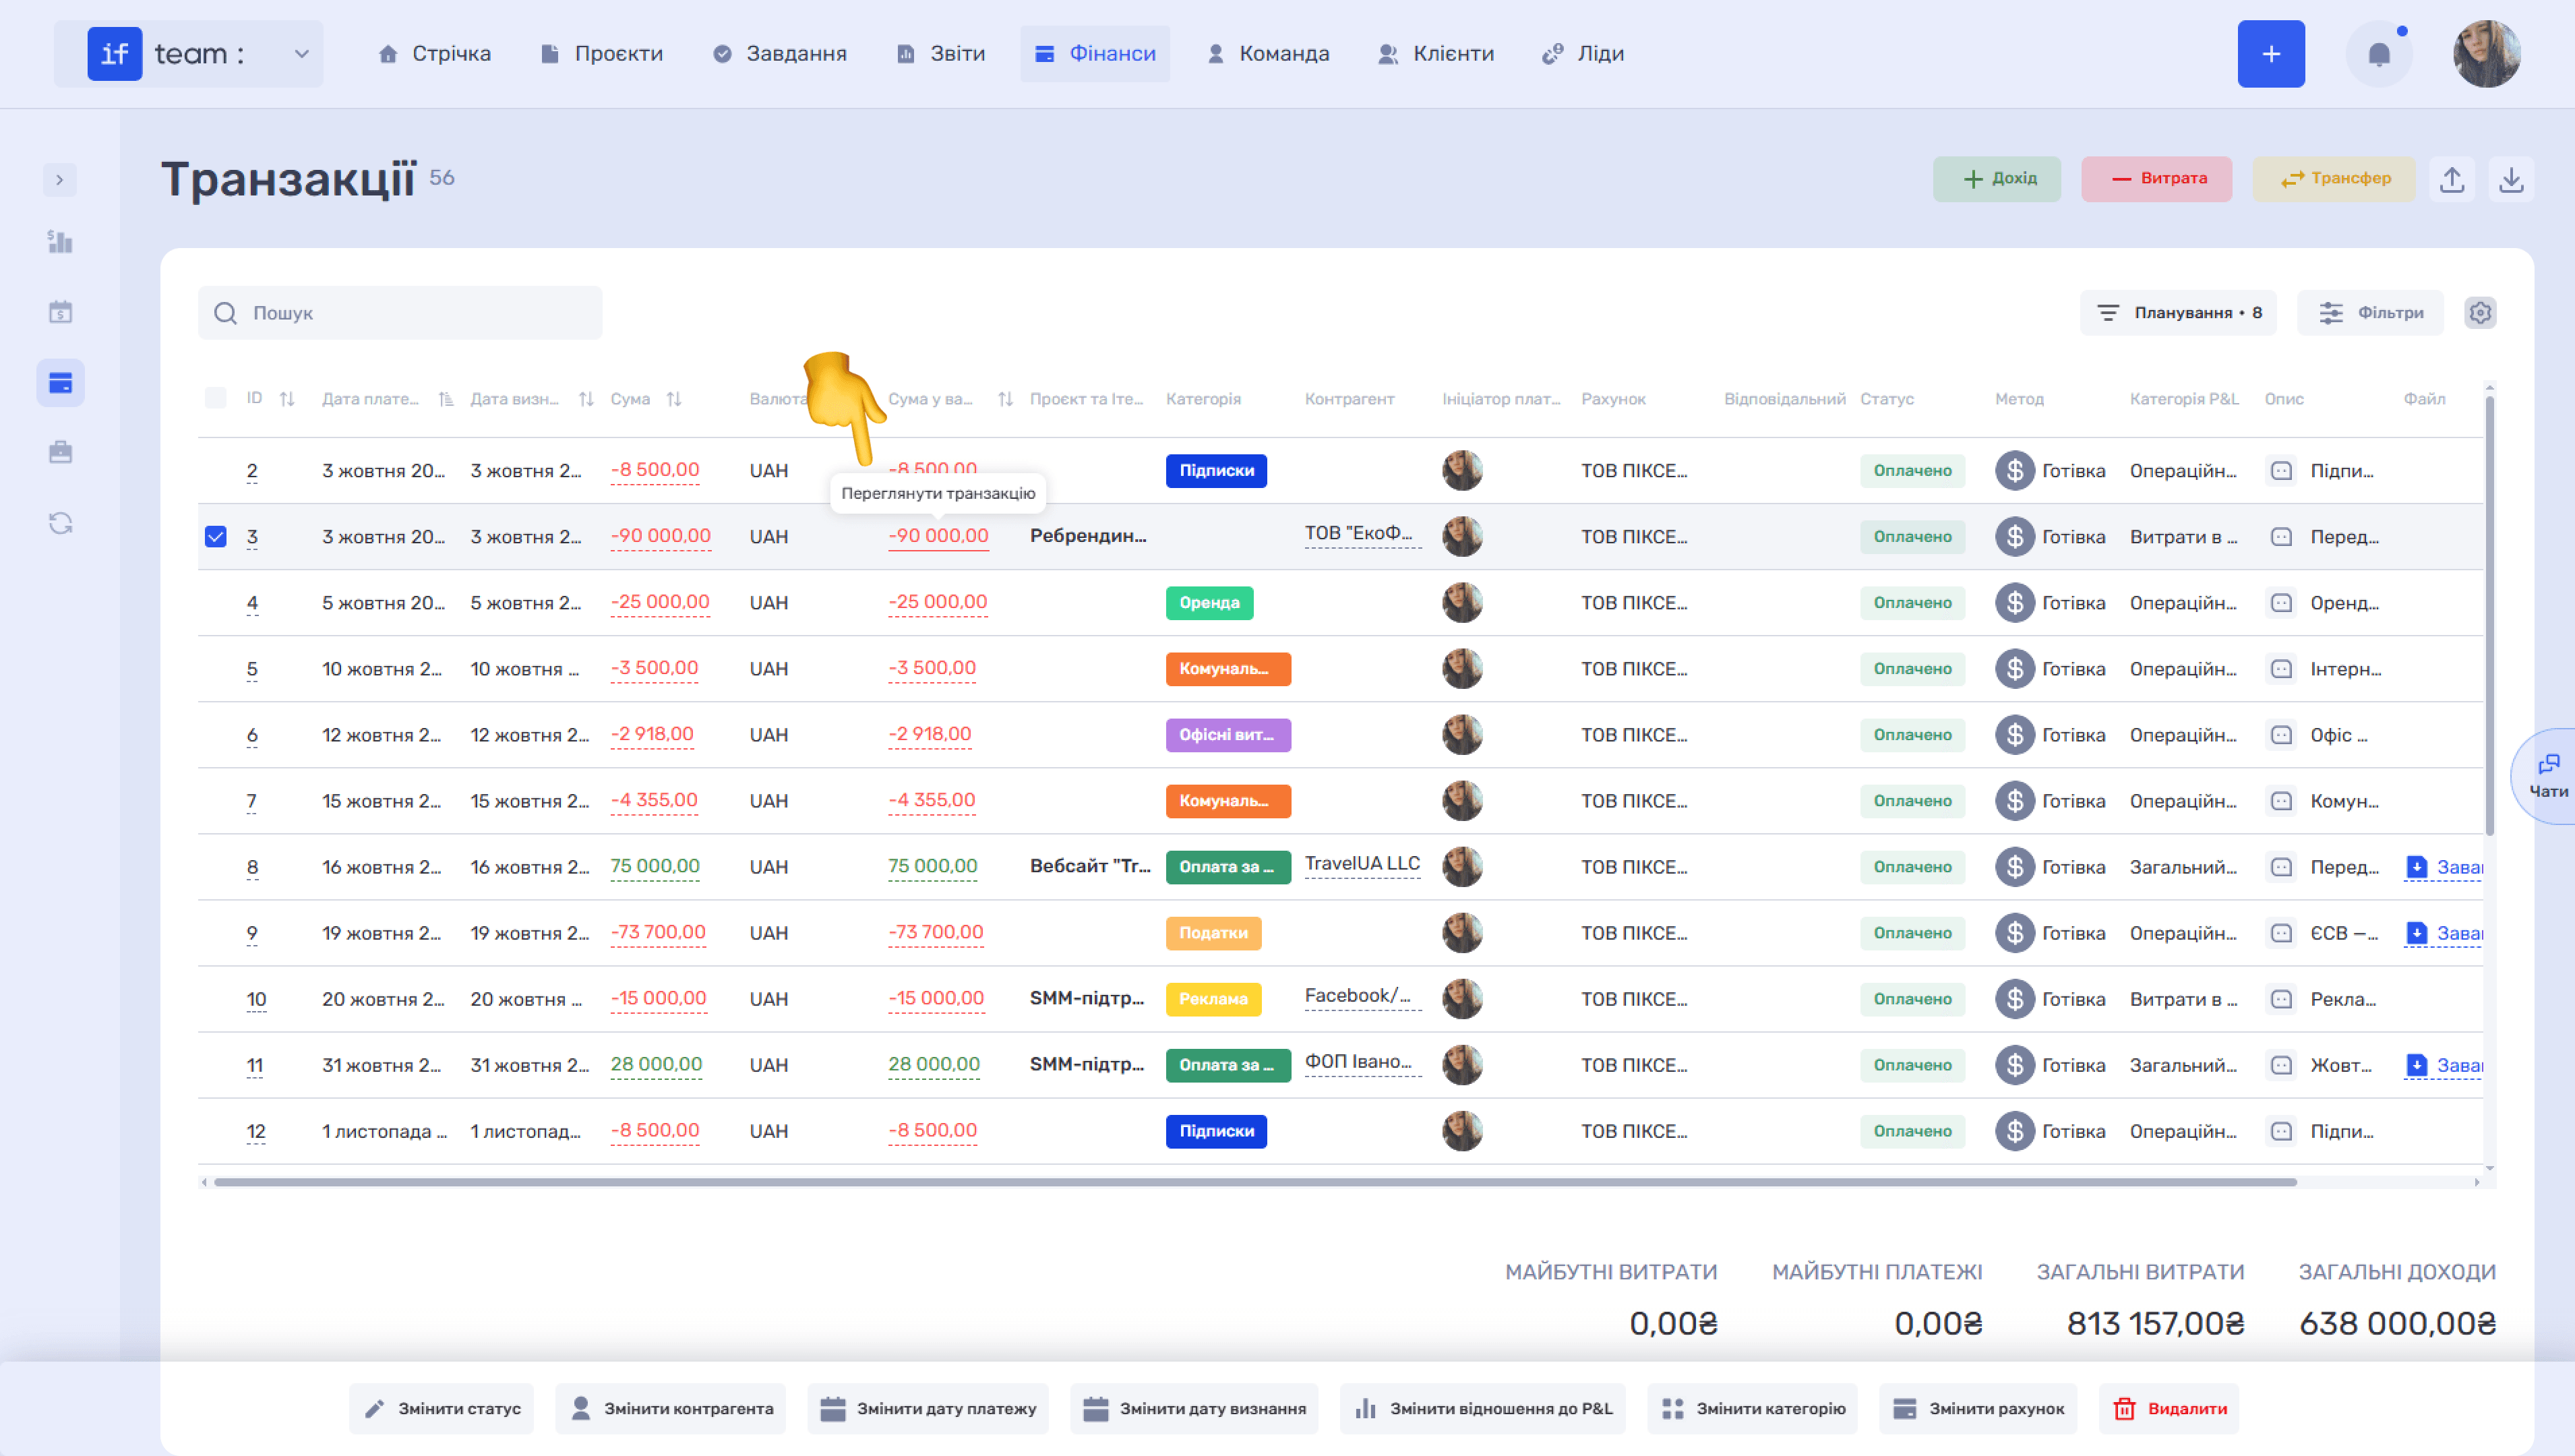
Column Settings and Filters. Click the gear icon (⚙) to open the panel and select fields from the complete list of available columns: ID, payment date, recognition date, amount, currency, amount in company currency, project and iteration, category, counterparty, payment initiator, account, responsible employee, status, method, P&L category, description, file, and actions. Enable or disable the required fields and click Save.
Transactions has the broadest filter set of all subsections because it contains every company financial transaction. Click Filters and filter by transaction date, type, category including P&L category, project, account, counterparty, status, responsible employees, payment initiator, and account owner.
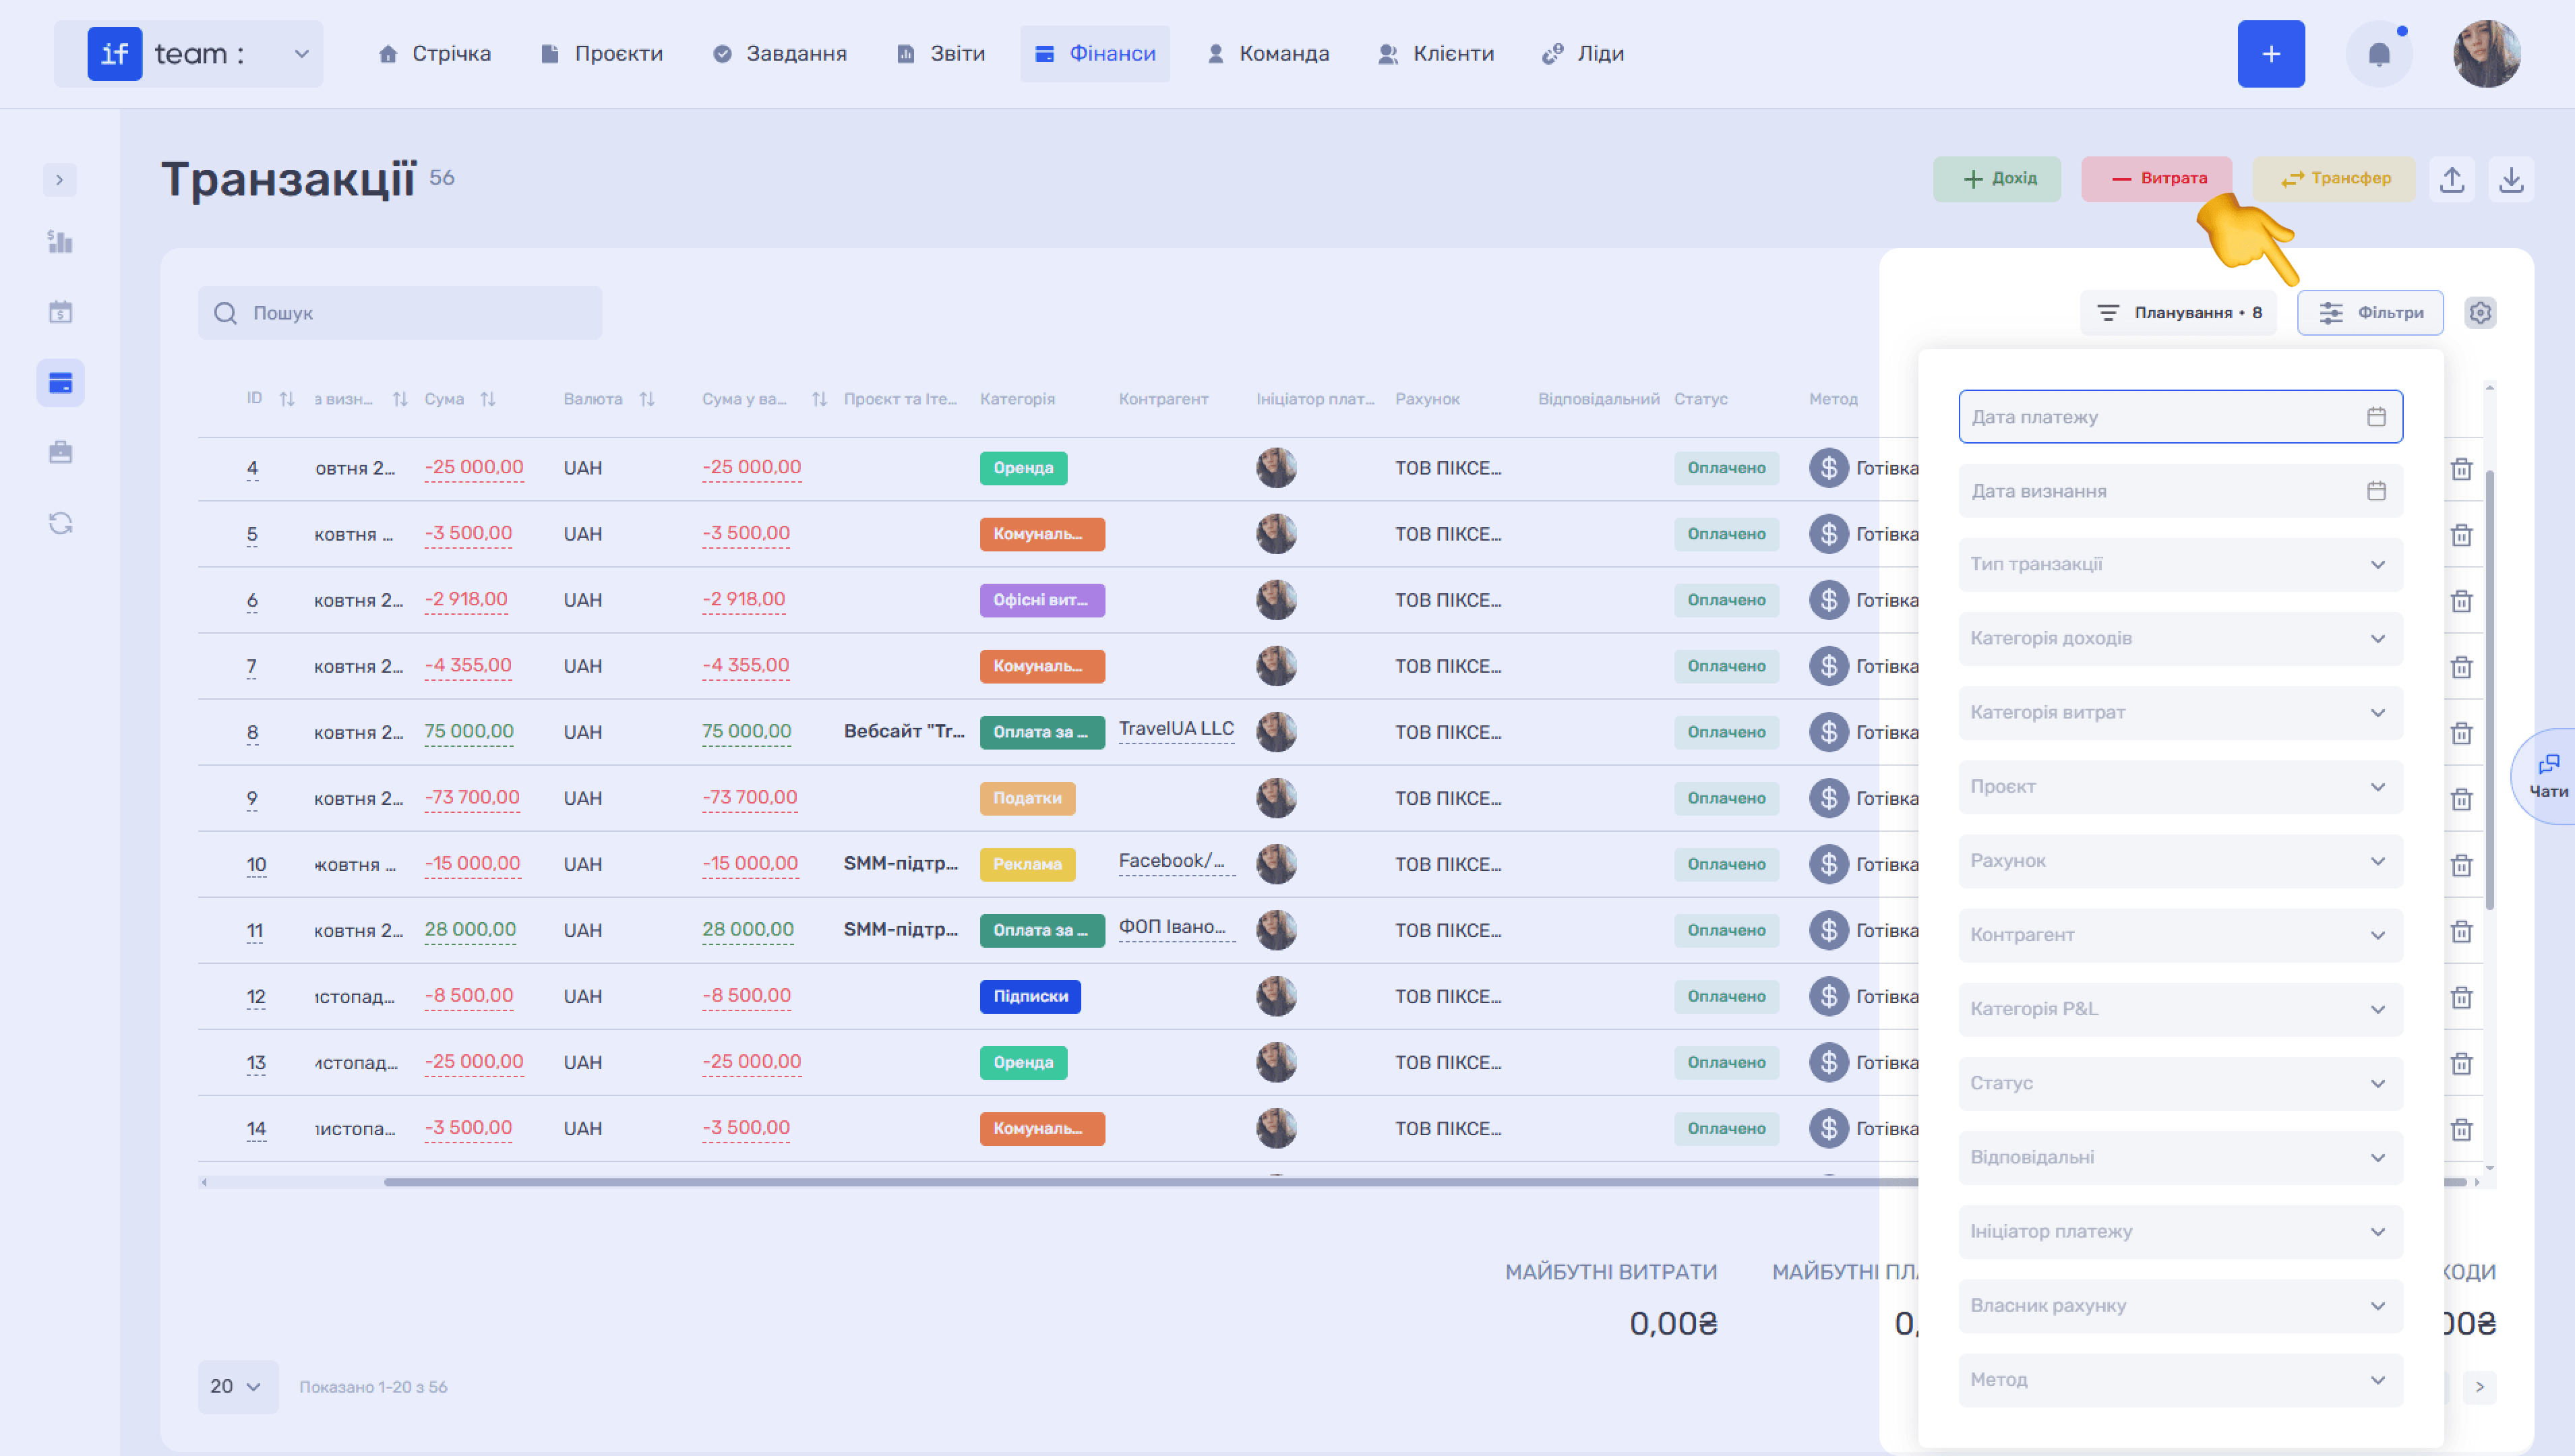
Bulk Editing. Select several transactions using the checkboxes. A bulk actions panel appears at the bottom of the page, where you can change status, counterparty, payment or recognition date, P&L treatment, category, or account, or delete the selected entries.
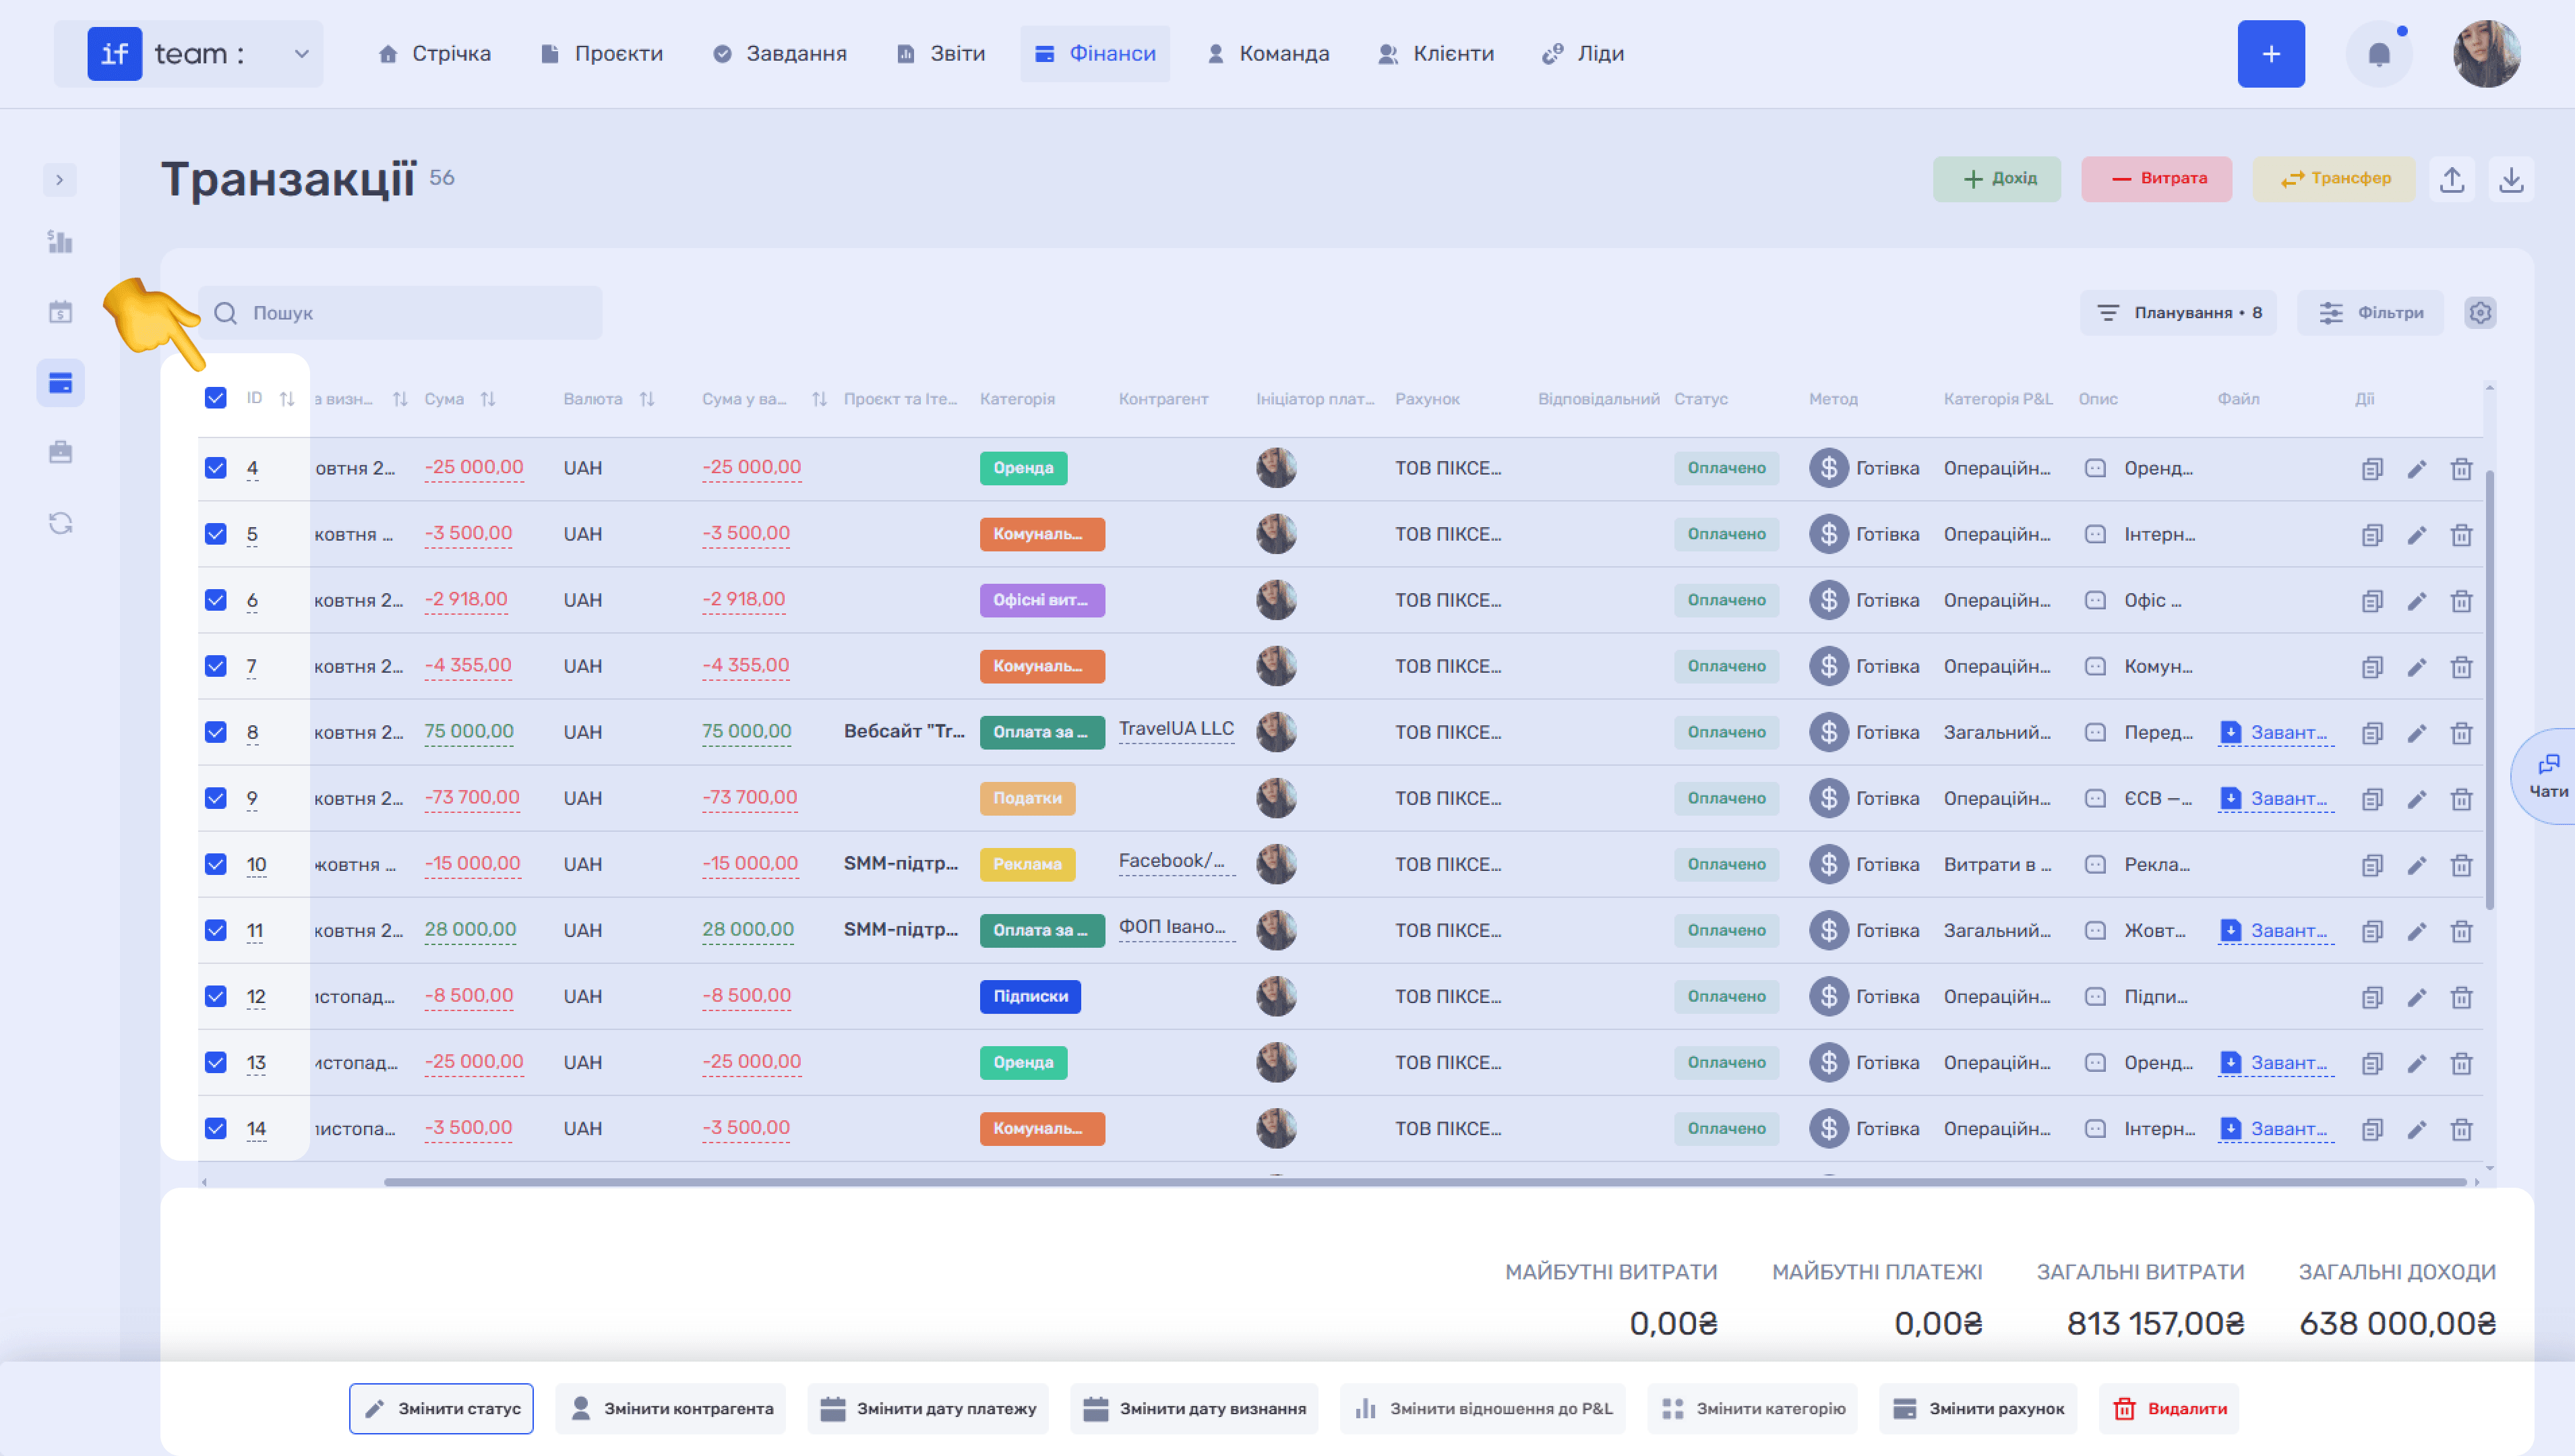
Totals. The bottom of the page displays overall totals: future expenses and payments, and total expenses and income.
Search, Planning, and Adding Transactions. + Income, − Expense, and Transfer let you quickly add a new transaction, while the import and export icons let you import or export data in Excel format.
Payroll
The Payroll subsection lets you create payroll calculations, track accruals and payments, and control payment statuses for each employee.
Views. The page has two views, List and Calendar, which you switch using the tab panel in the upper-right corner.
- List is a table where each row represents an employee’s payroll calculation for a specific period. Its columns are configurable. Click the gear icon (⚙) and select the required columns: period, rates, accrued, paid, status, calculation date, payment date, and file. Select the required fields, clear unnecessary ones, and click Save. The bottom of the table shows totals: employee count, transaction count, and total payments.
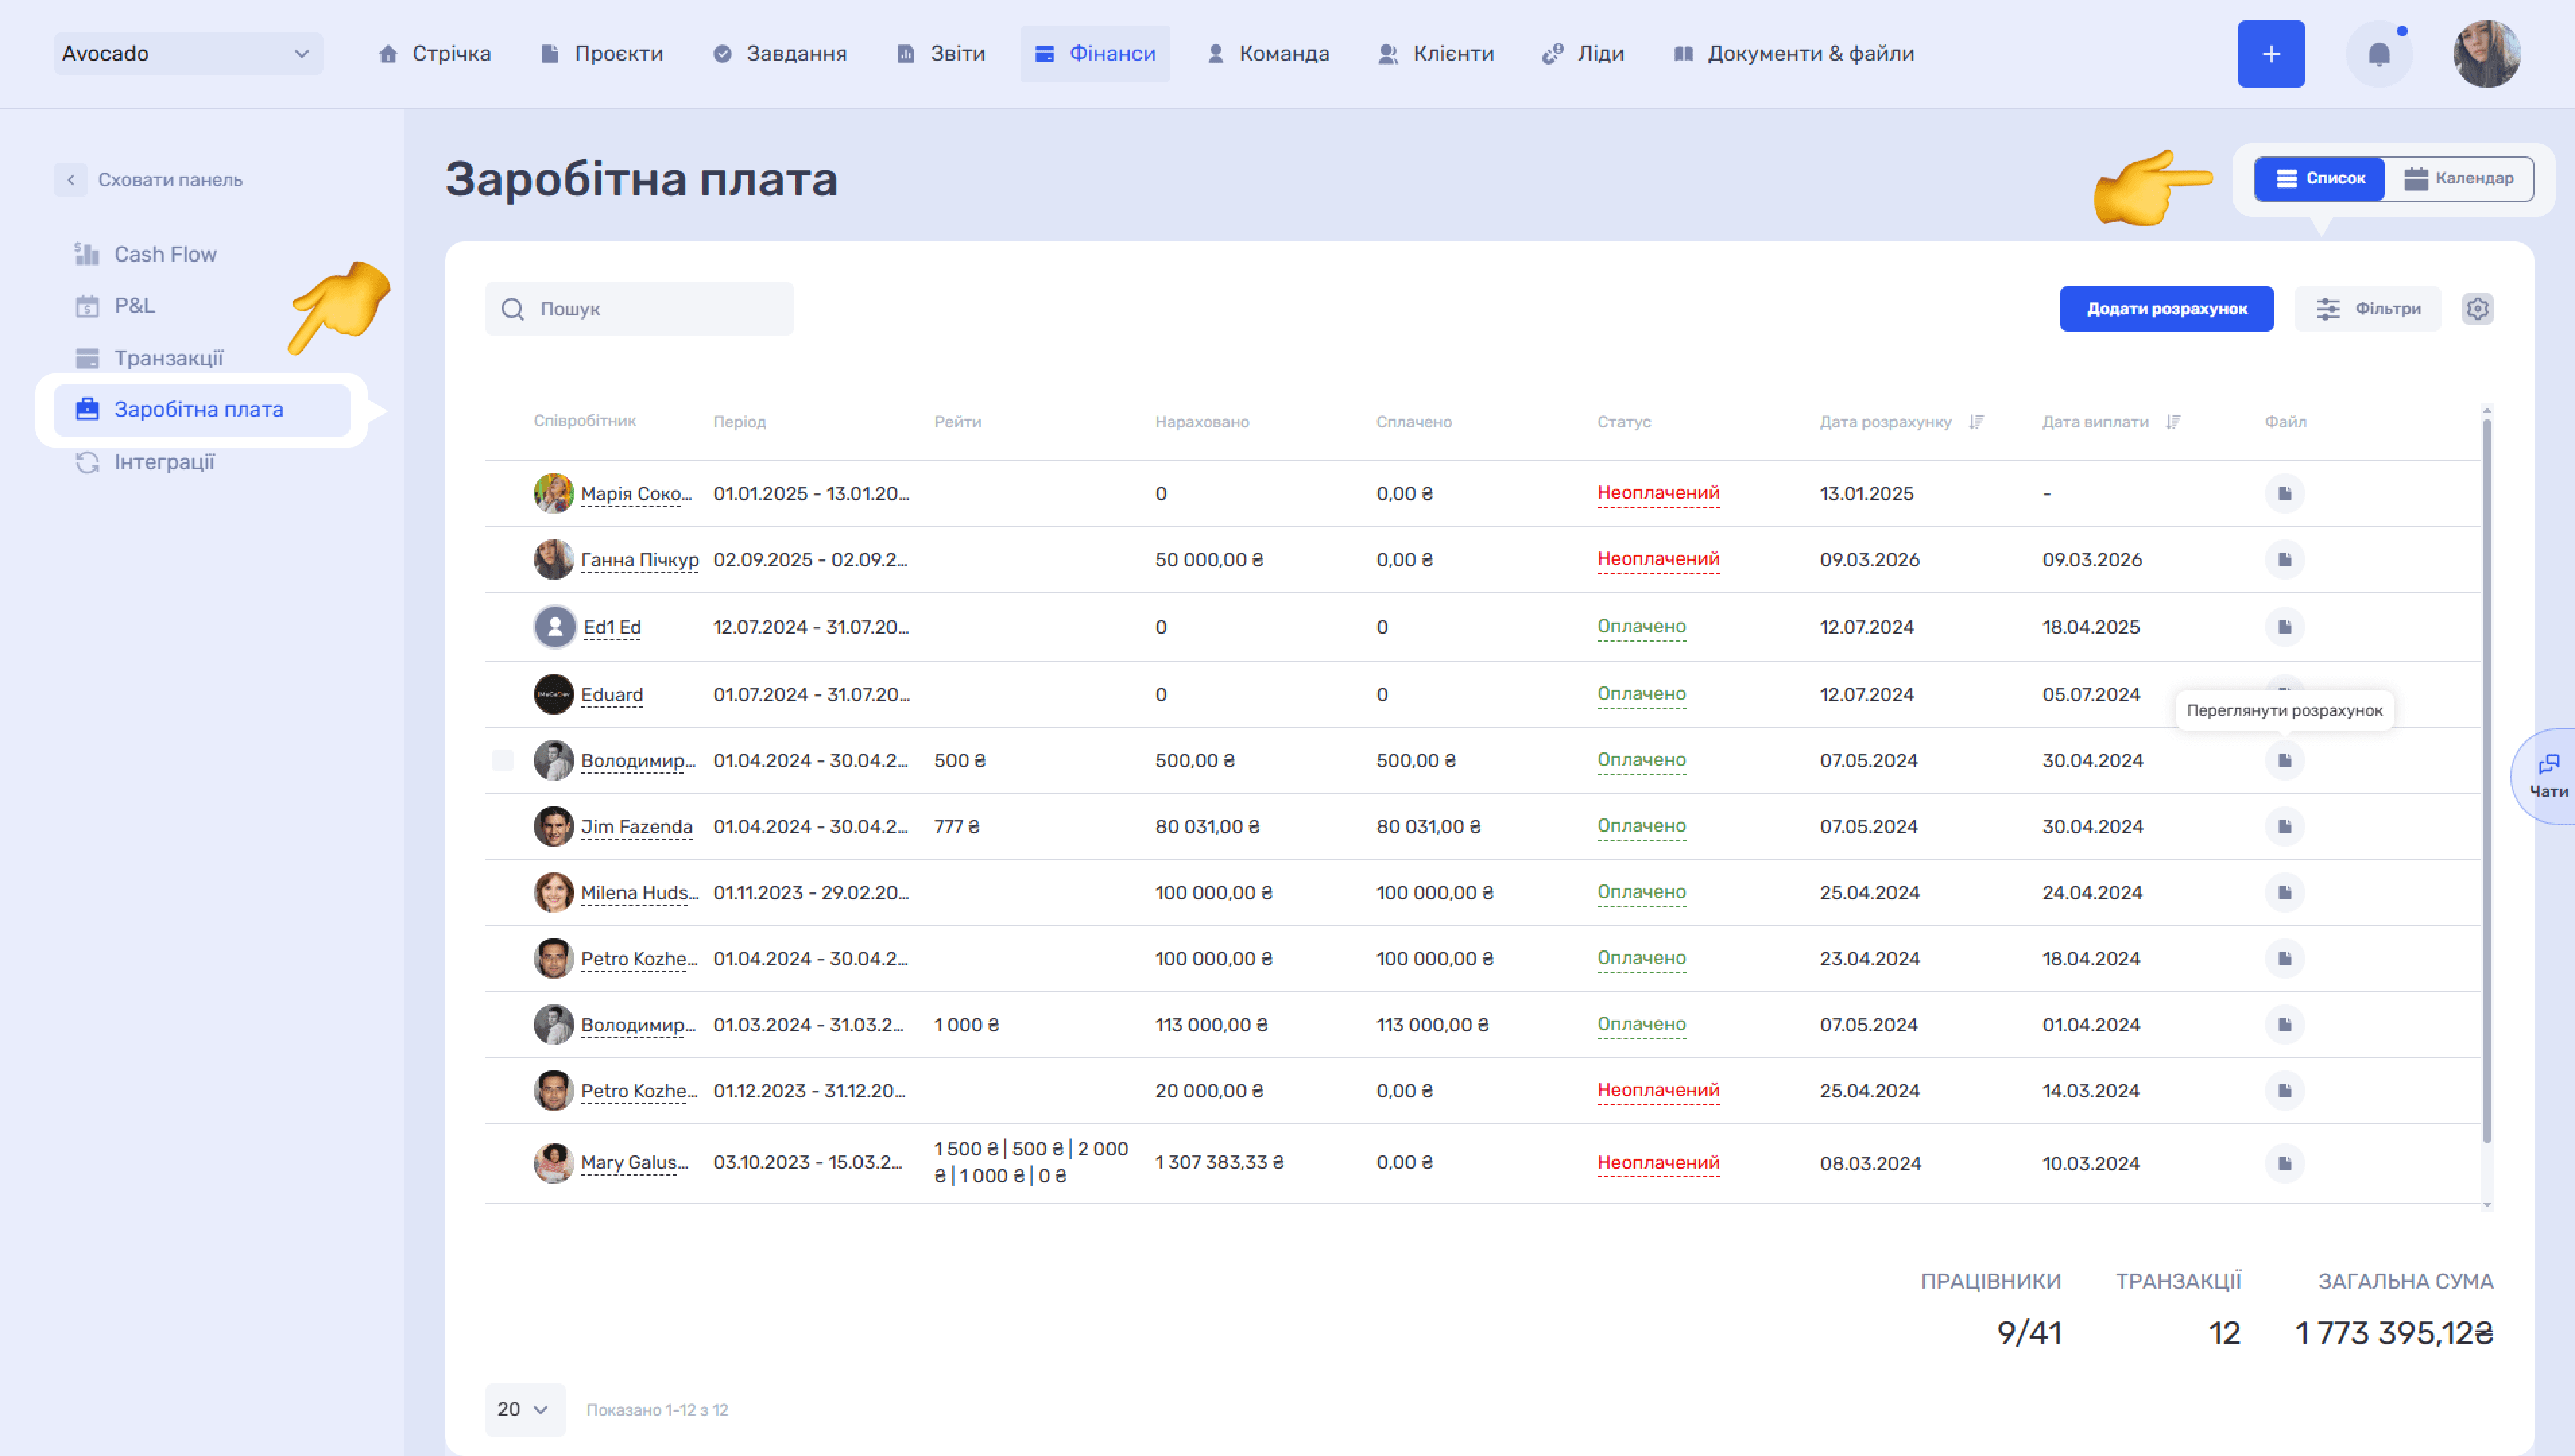
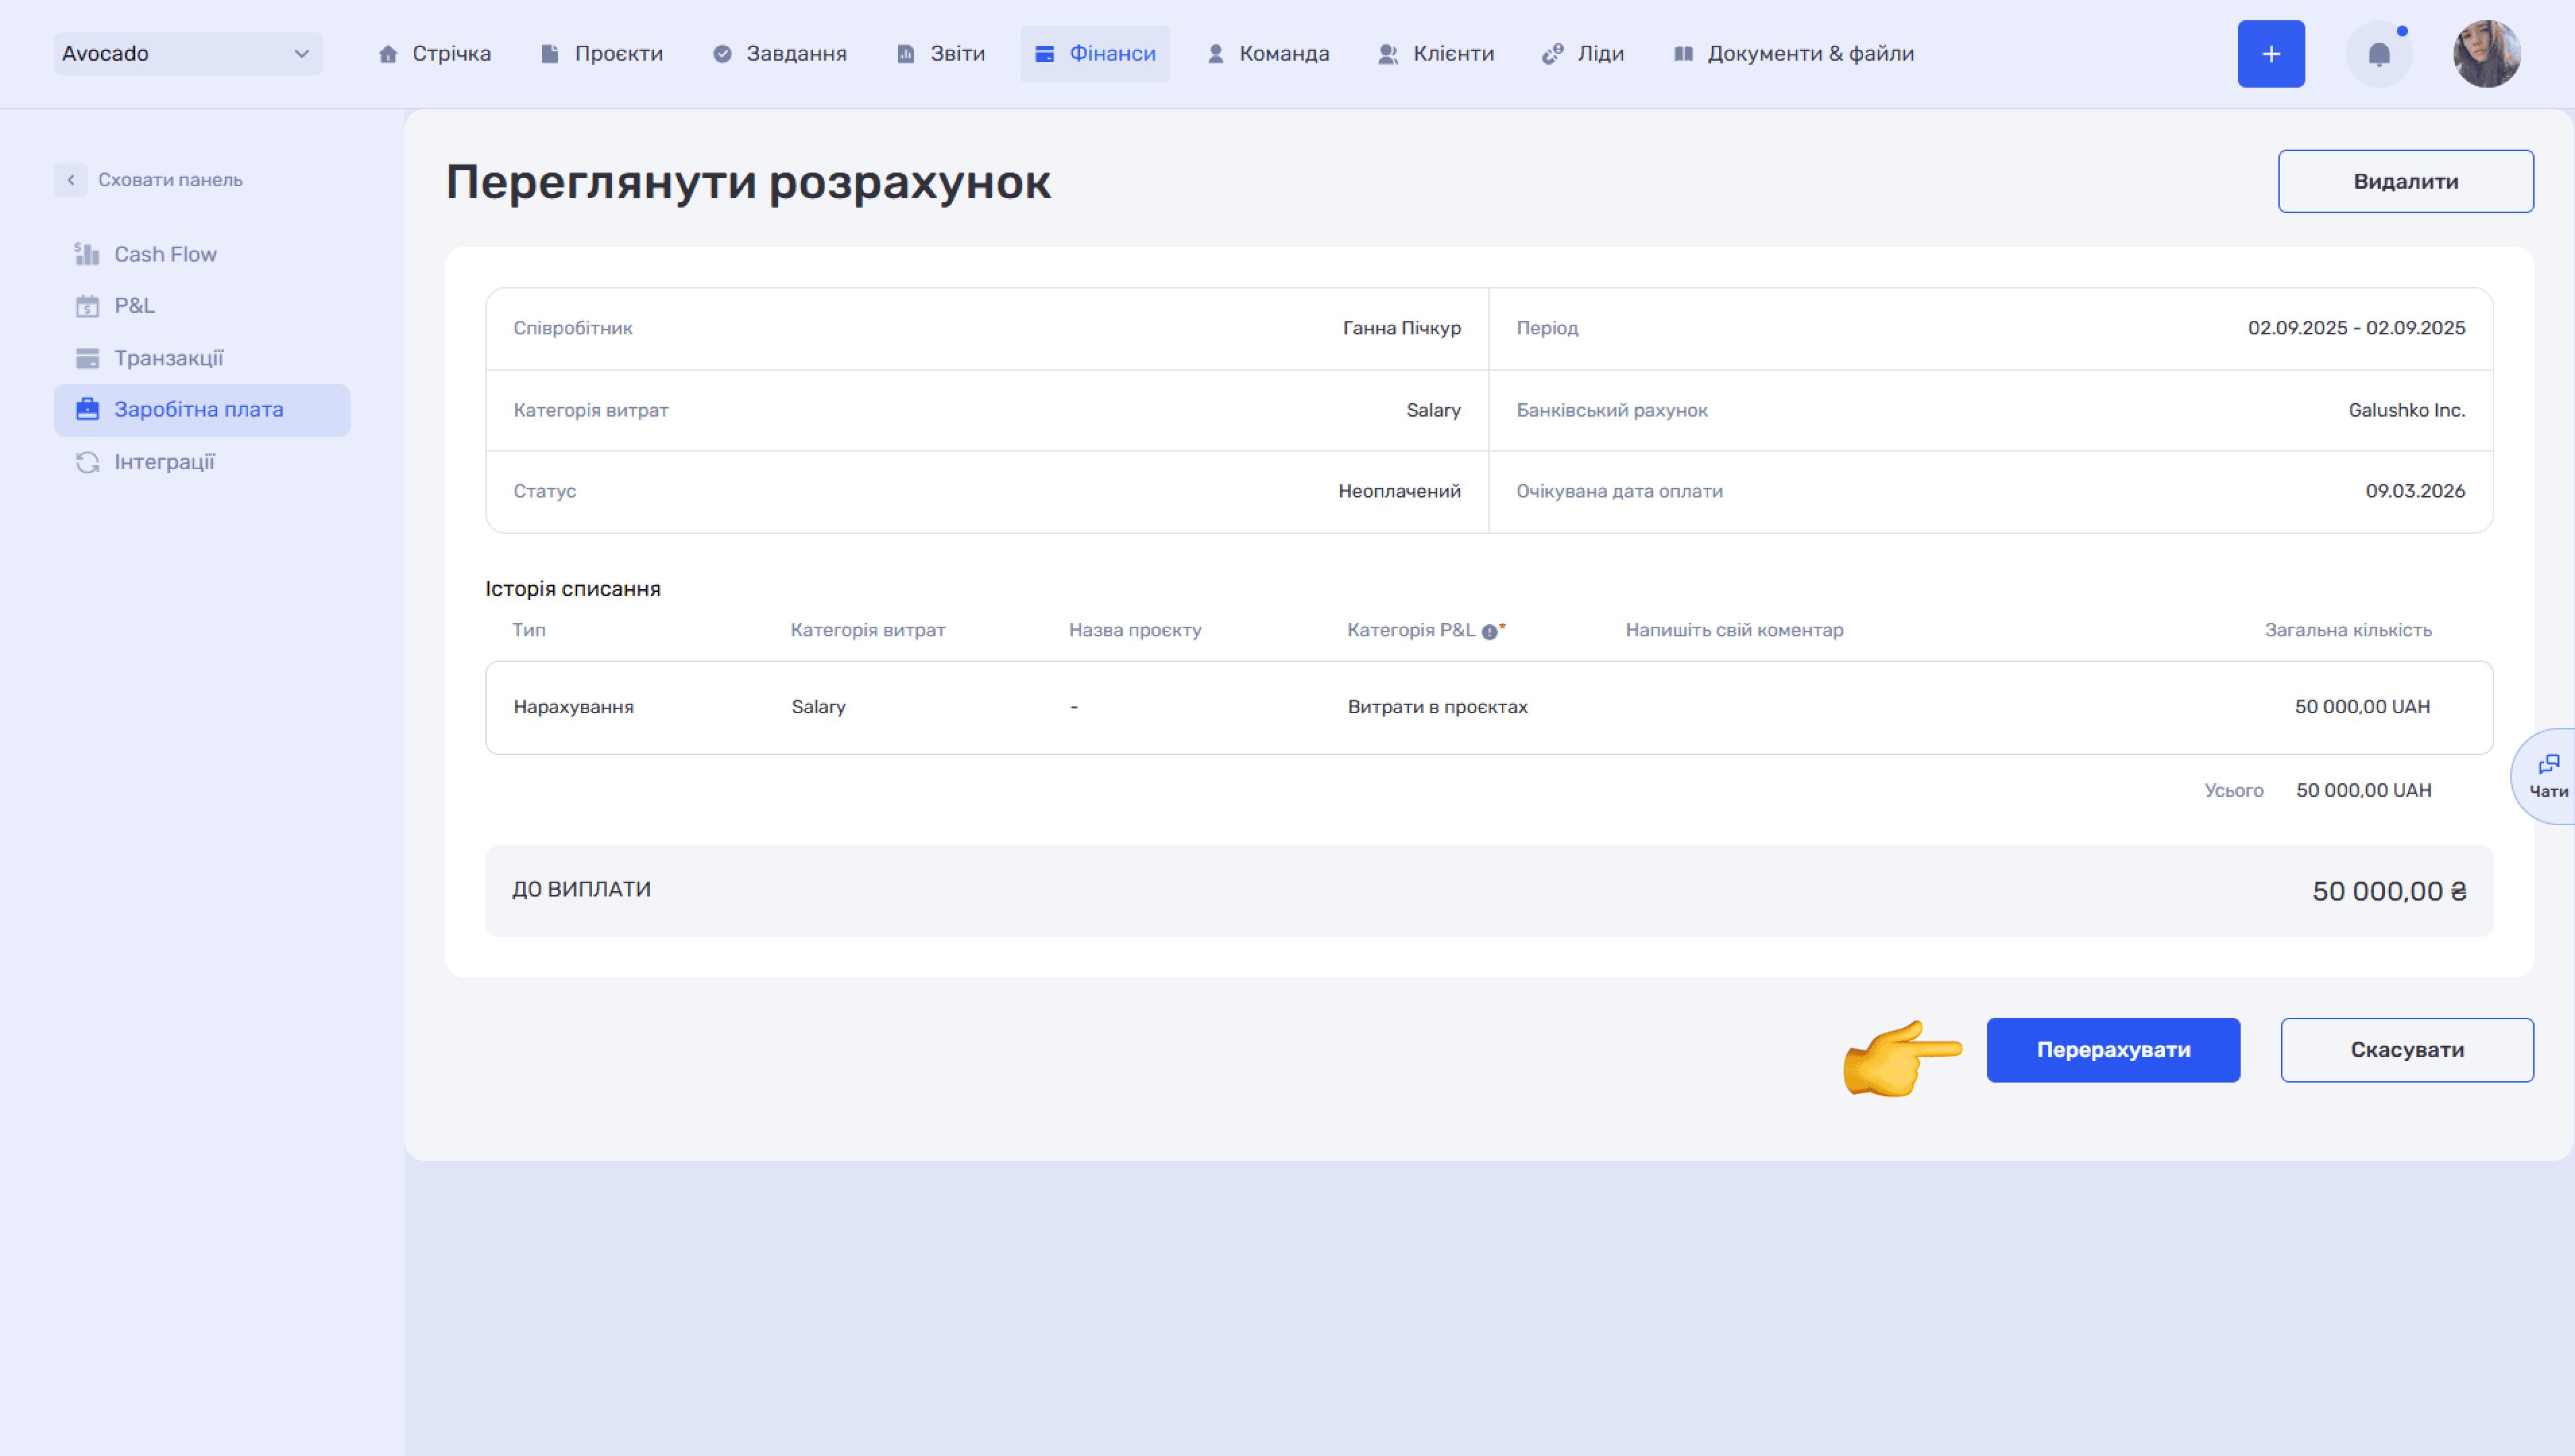
To view a specific employee’s calculation, click the file icon (📄) in the corresponding column. Hours Actually Worked shows a breakdown by rate: hourly cost, hours worked, and the total amount for each rate type, followed by the total accrued amount.
Projects details how much time and money is assigned to each project and iteration. This shows how the employee’s work time is distributed between projects.
Deduction History records all deductions, including advances and taxes. Each entry has an expense and P&L category.
Please note
The P&L category determines which part of the profit and loss report a transaction belongs to, such as Income, Operating Expenses, or Non-operating Profit. Salaries, for example, are automatically assigned to the corresponding expense category, while dividend withdrawals or company recapitalization can be separated so they do not distort the company’s actual net income. For most transactions, the P&L category is set by default and requires no additional action.
The final Amount Payable appears at the bottom of the page after all accruals and deductions. If the calculation has the Unpaid status, two actions are available: Recalculate, which updates the amount using current data, and Cancel, which cancels the calculation. If the calculation has the Paid status, it cannot be recalculated; only Cancel and Delete are available.
- Calendar is a visual view that displays payroll calculations for all employees as a grid by day of the month. Each employee’s rate, if an hourly rate is set, and accrued amounts appear in the corresponding cells. The Total row summarizes accruals for the entire team by day and for the month overall. The Month / Period tabs let you select a specific month or a custom date range.
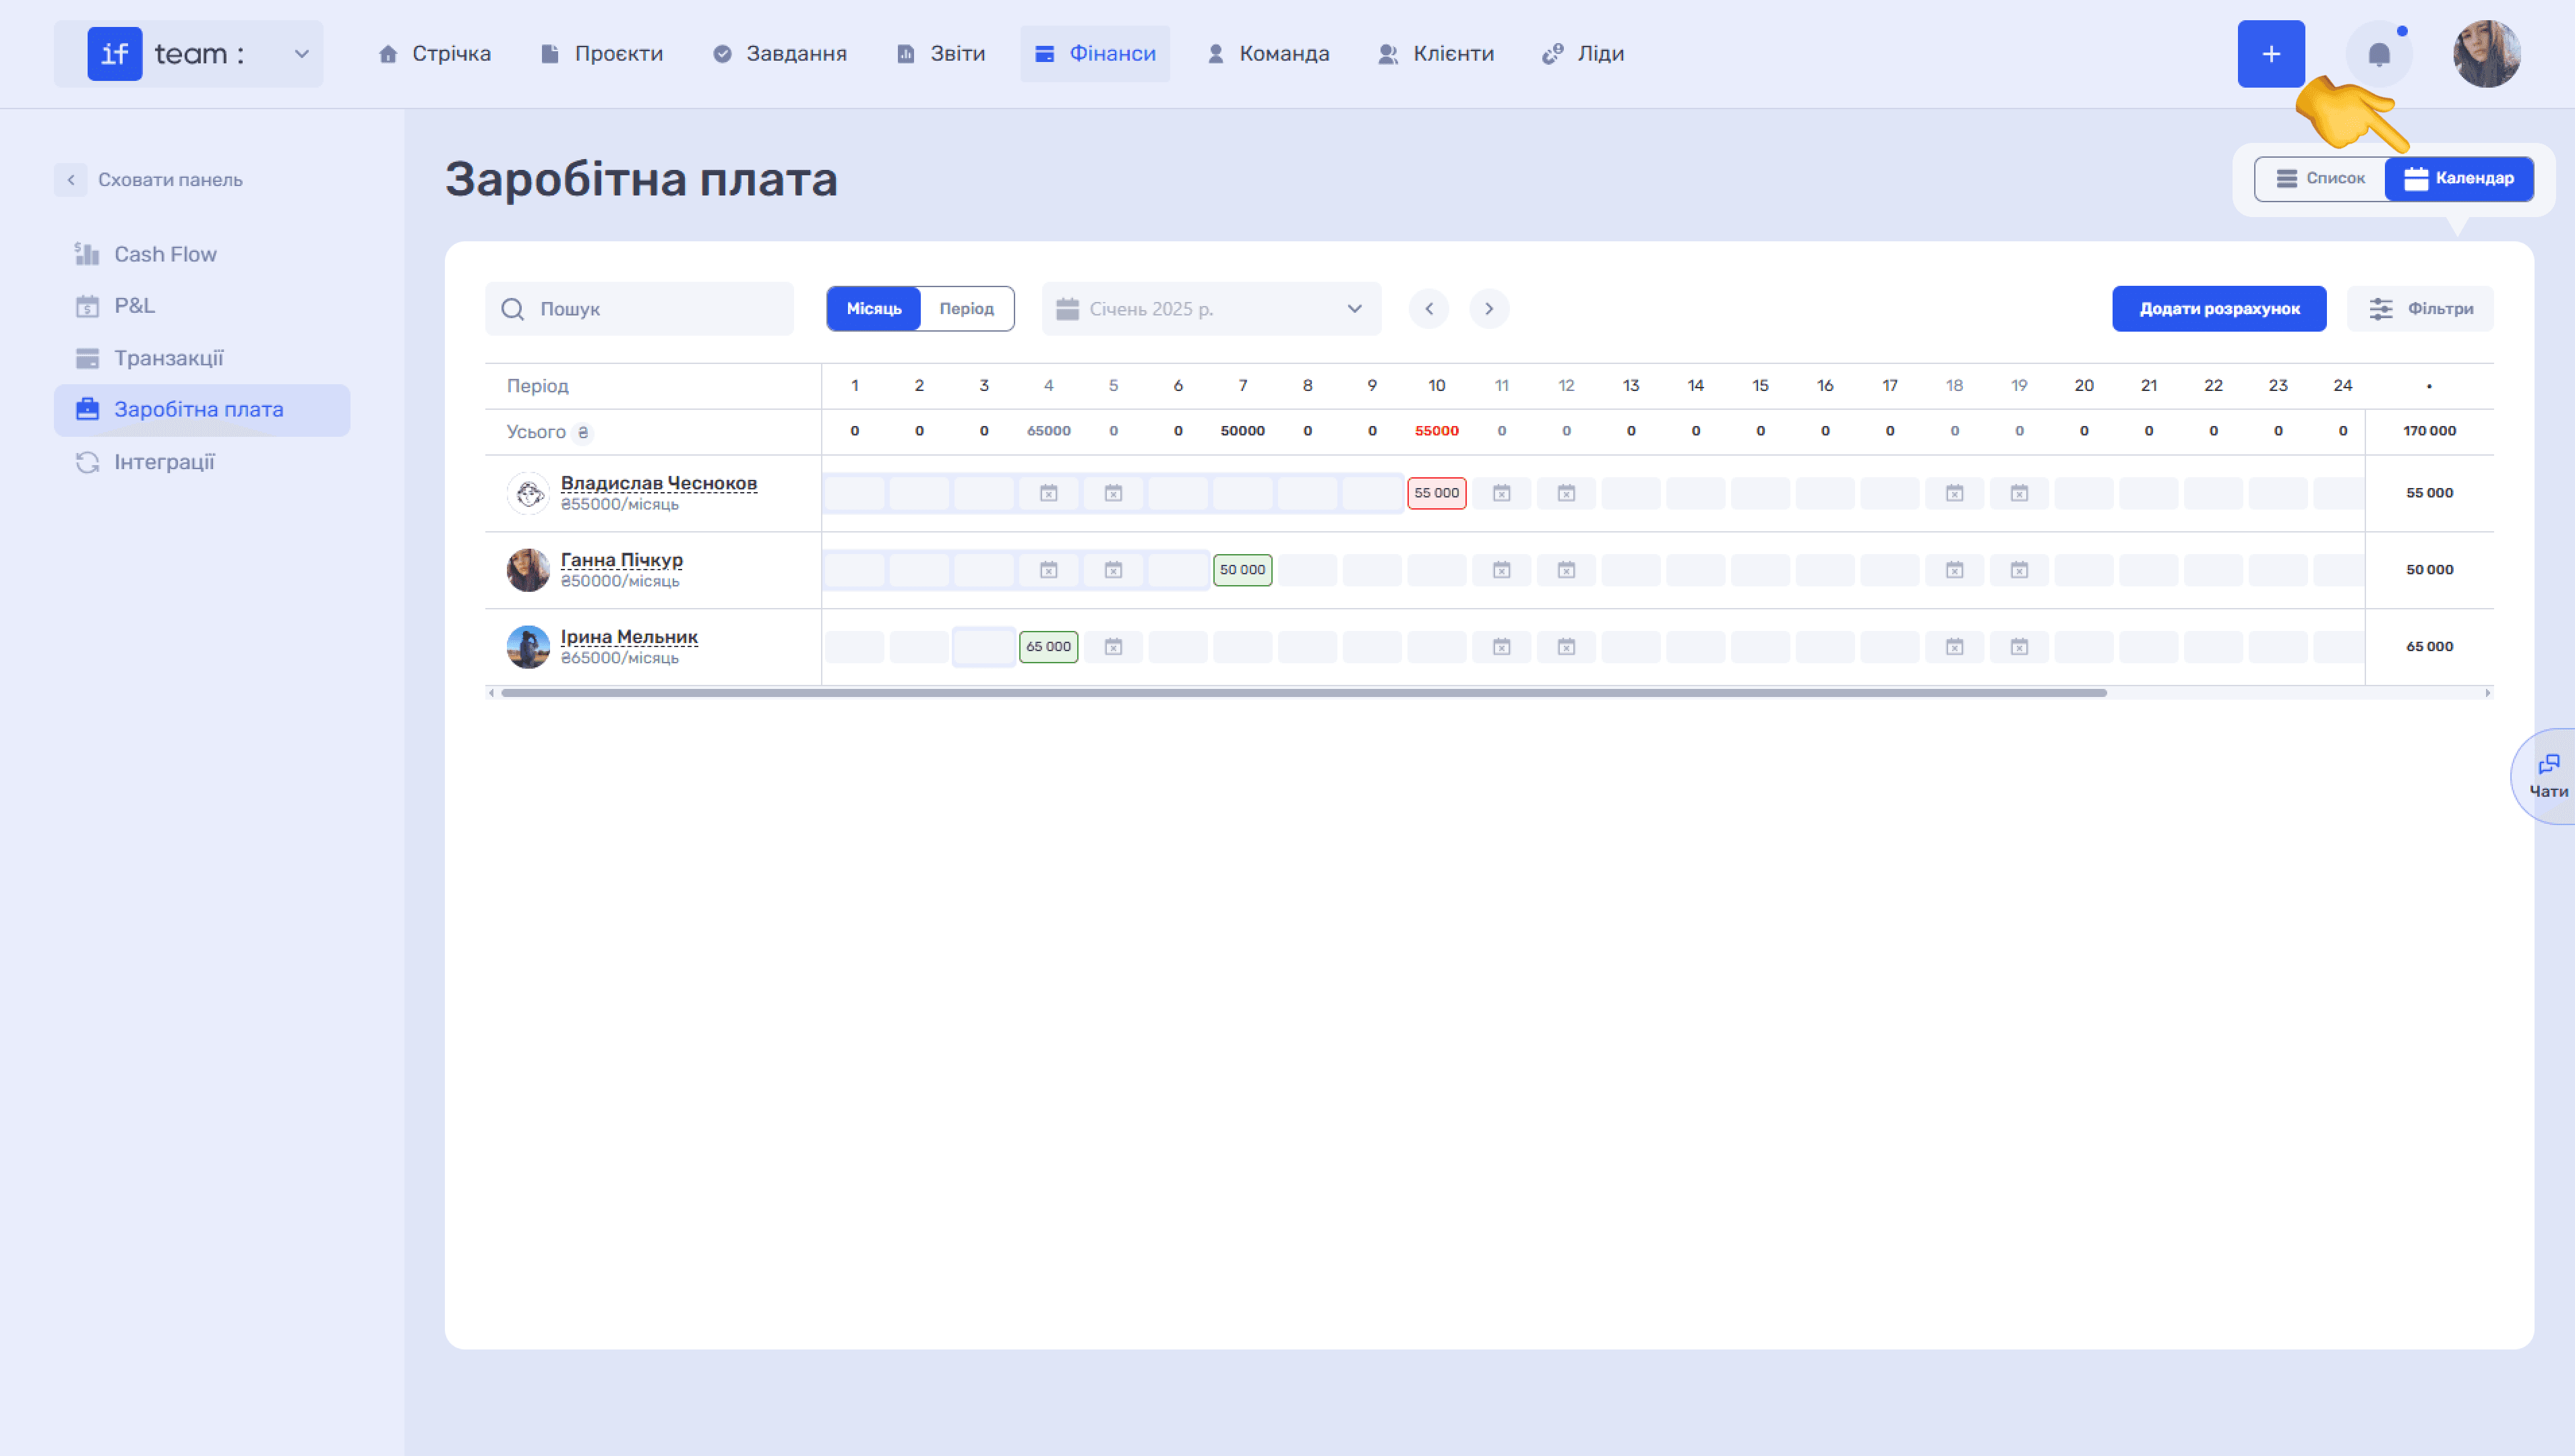
Click a cell containing an amount to display a tooltip with calculation details: calculation type and status, expected payment date, and the period for which salary was accrued.
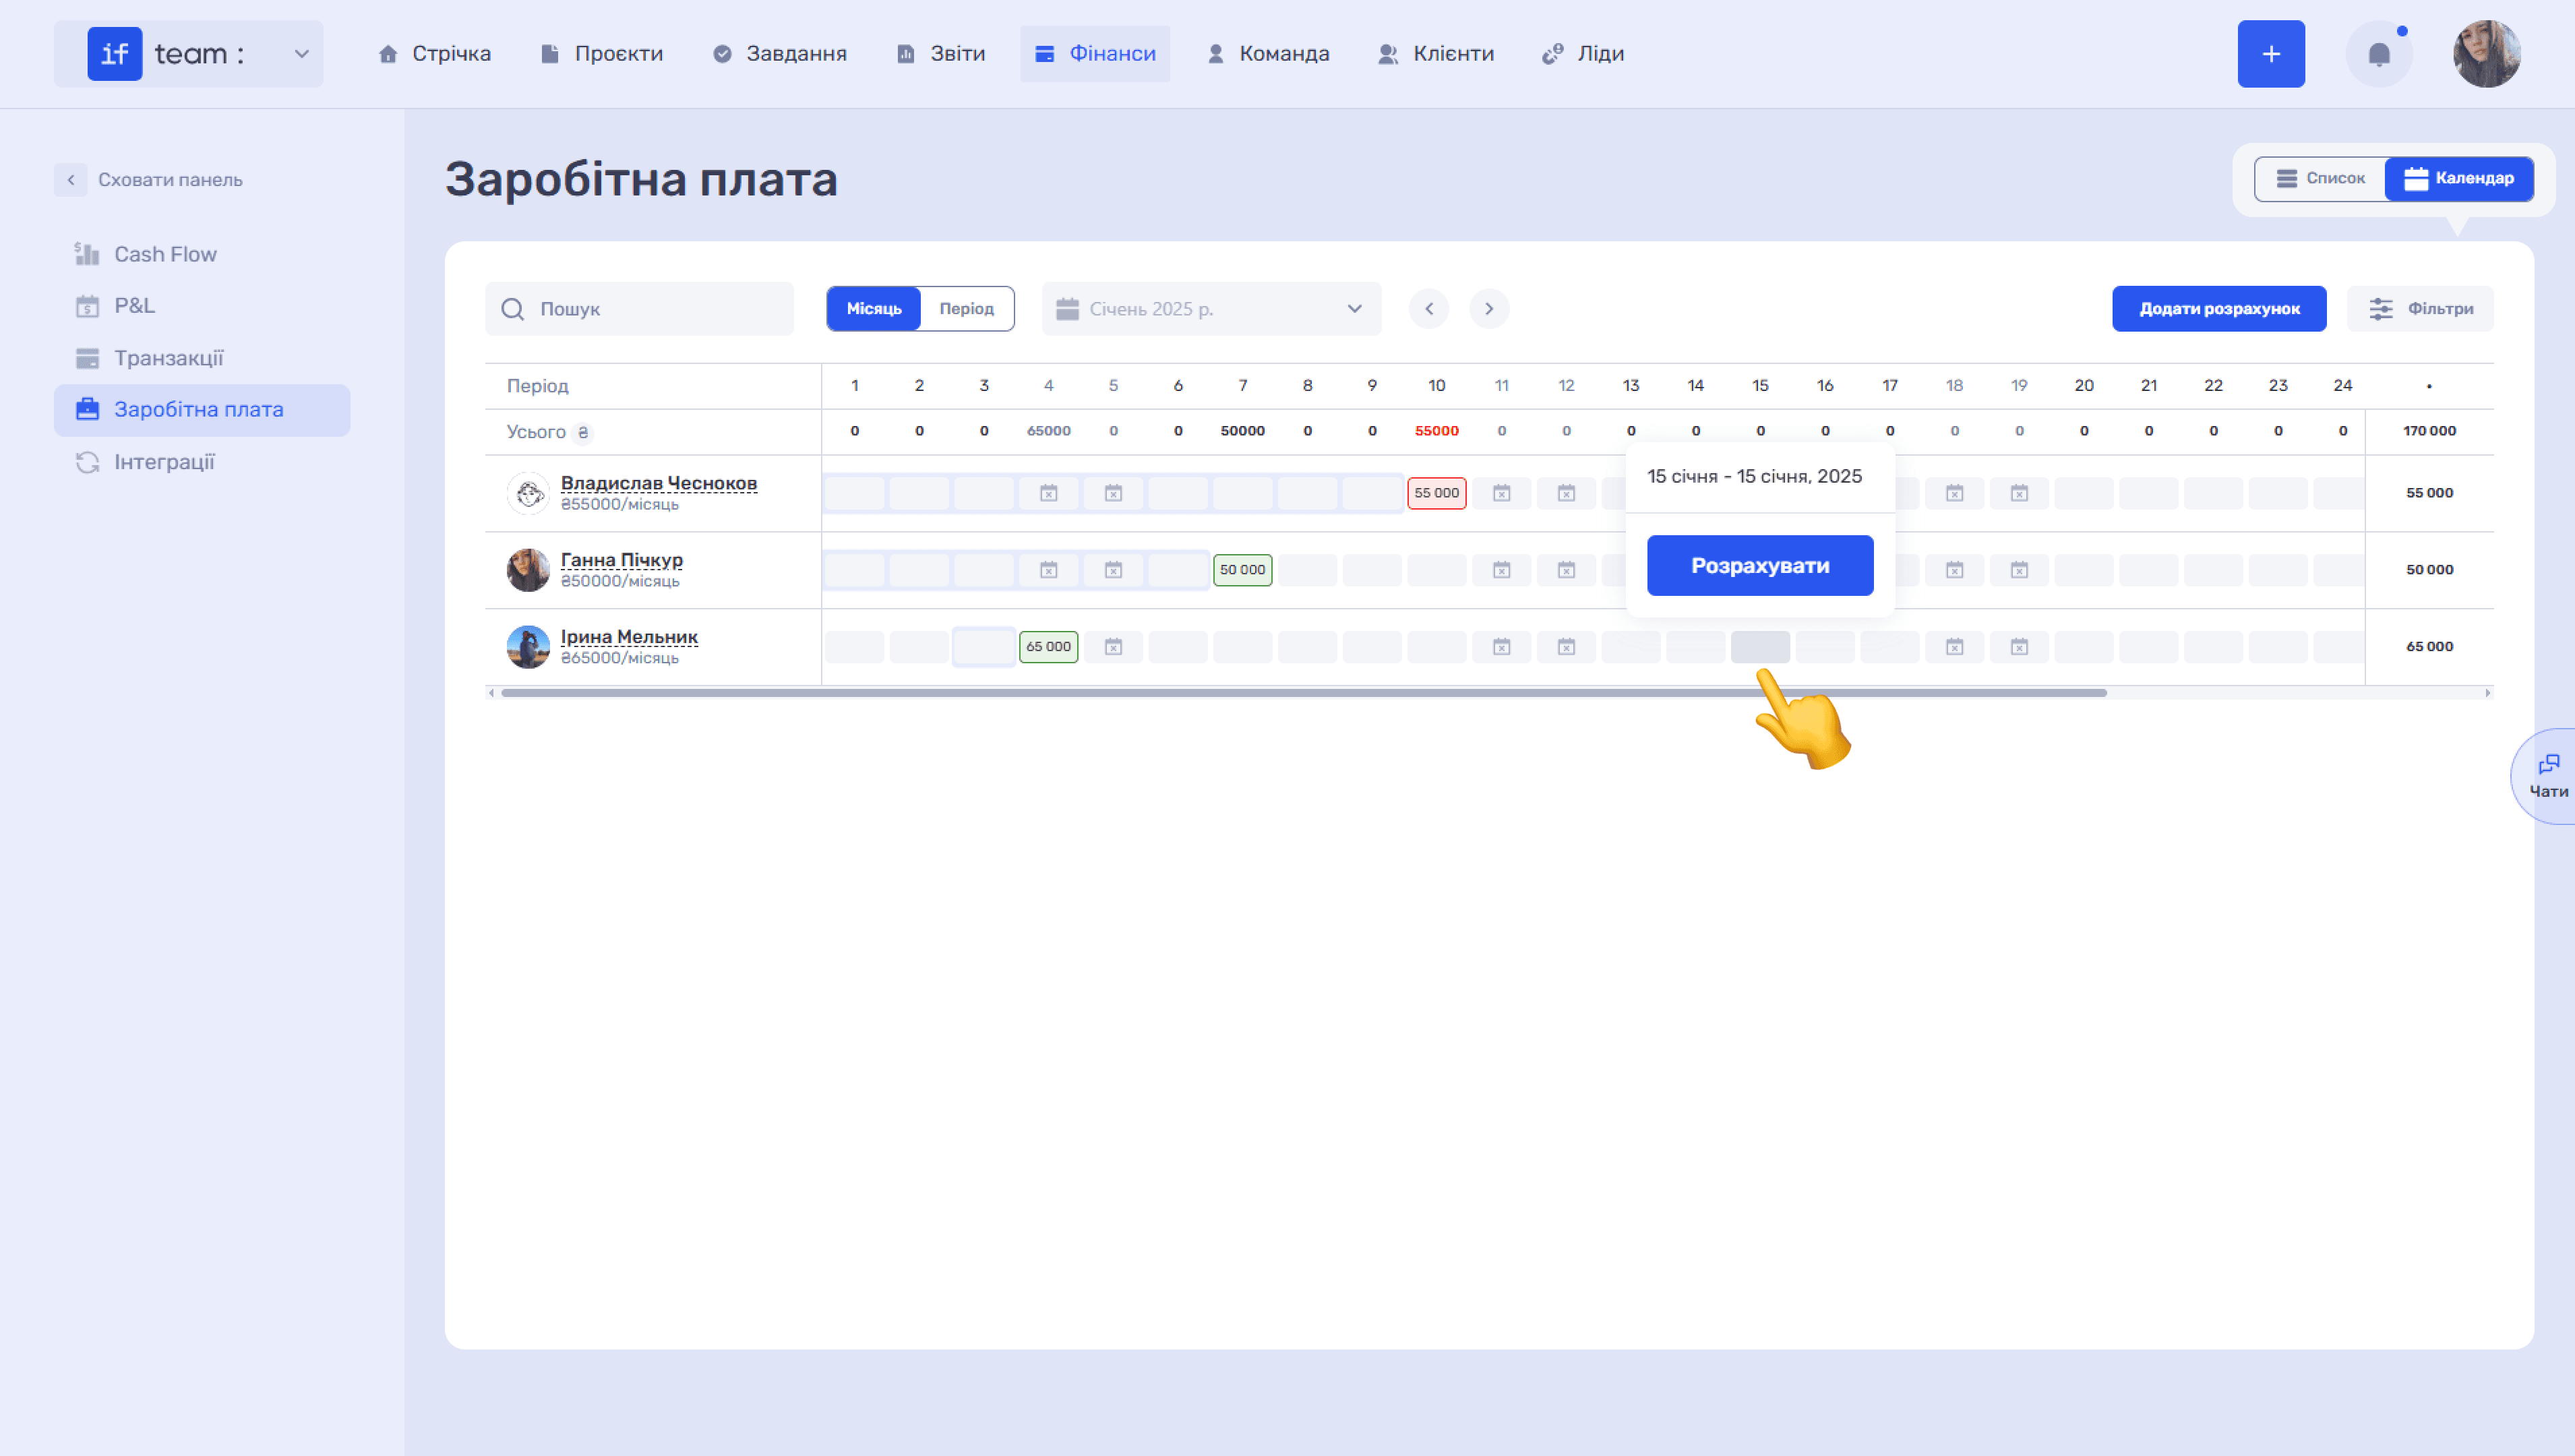
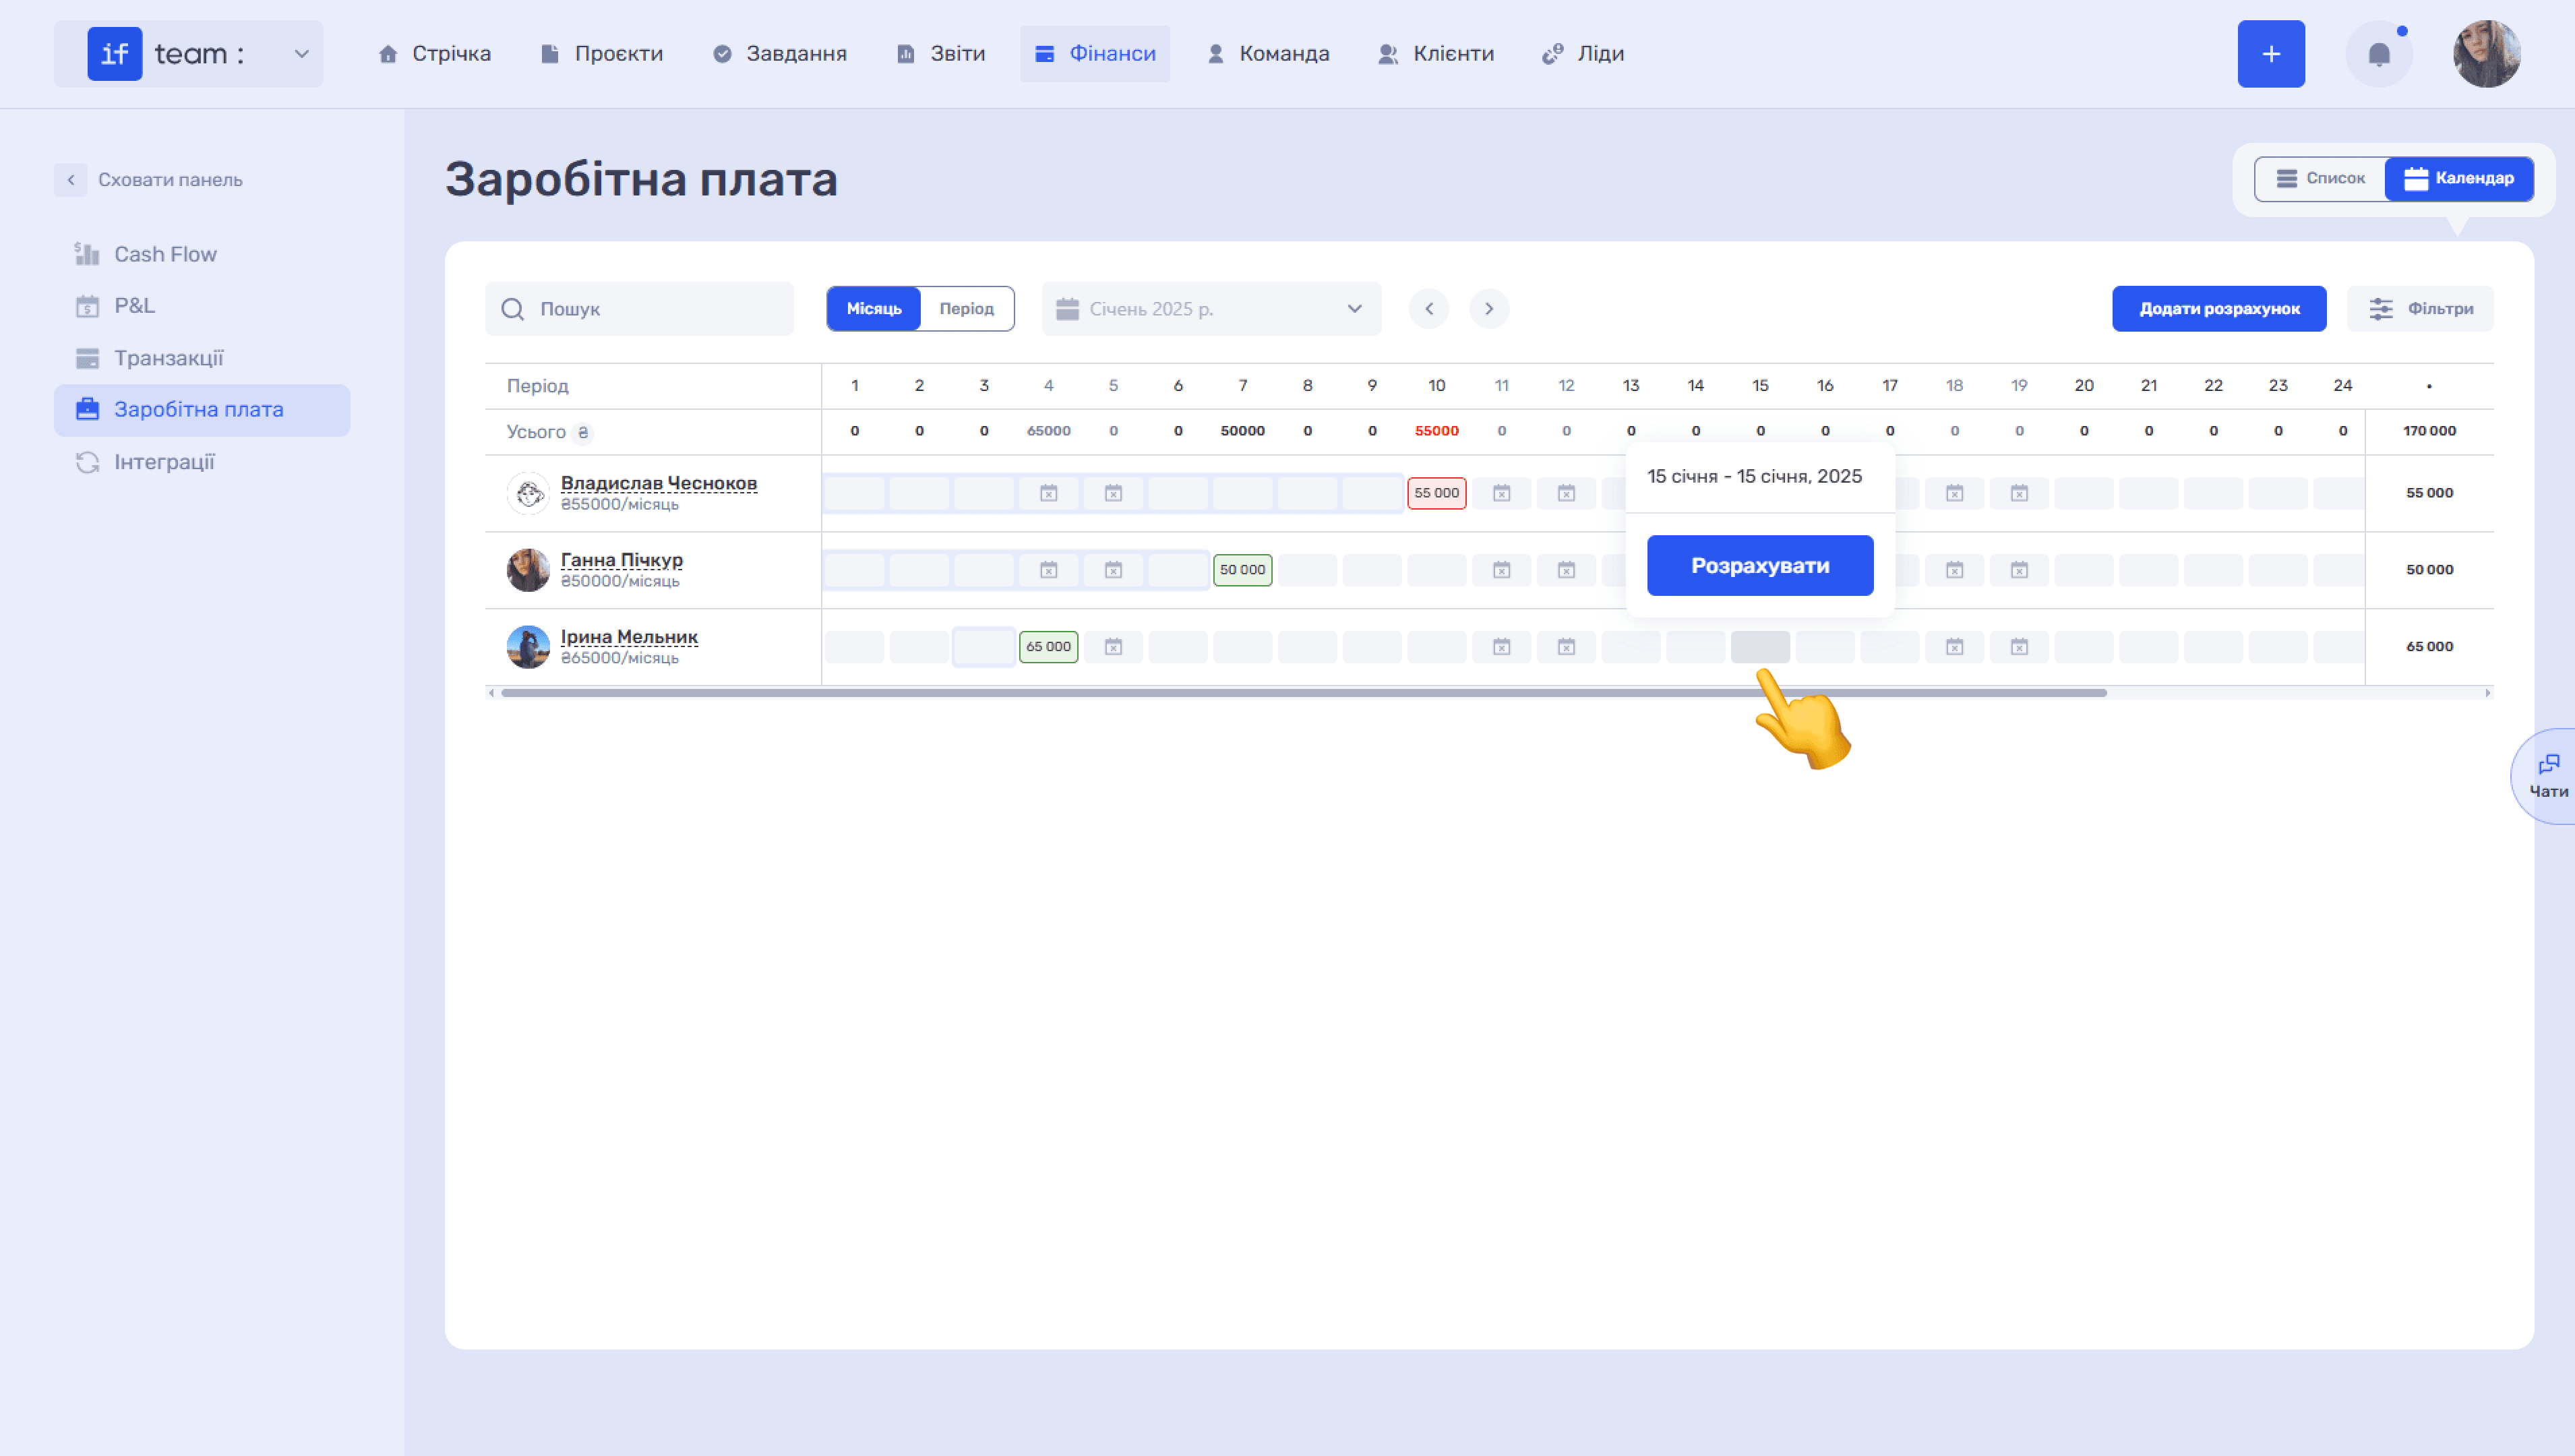
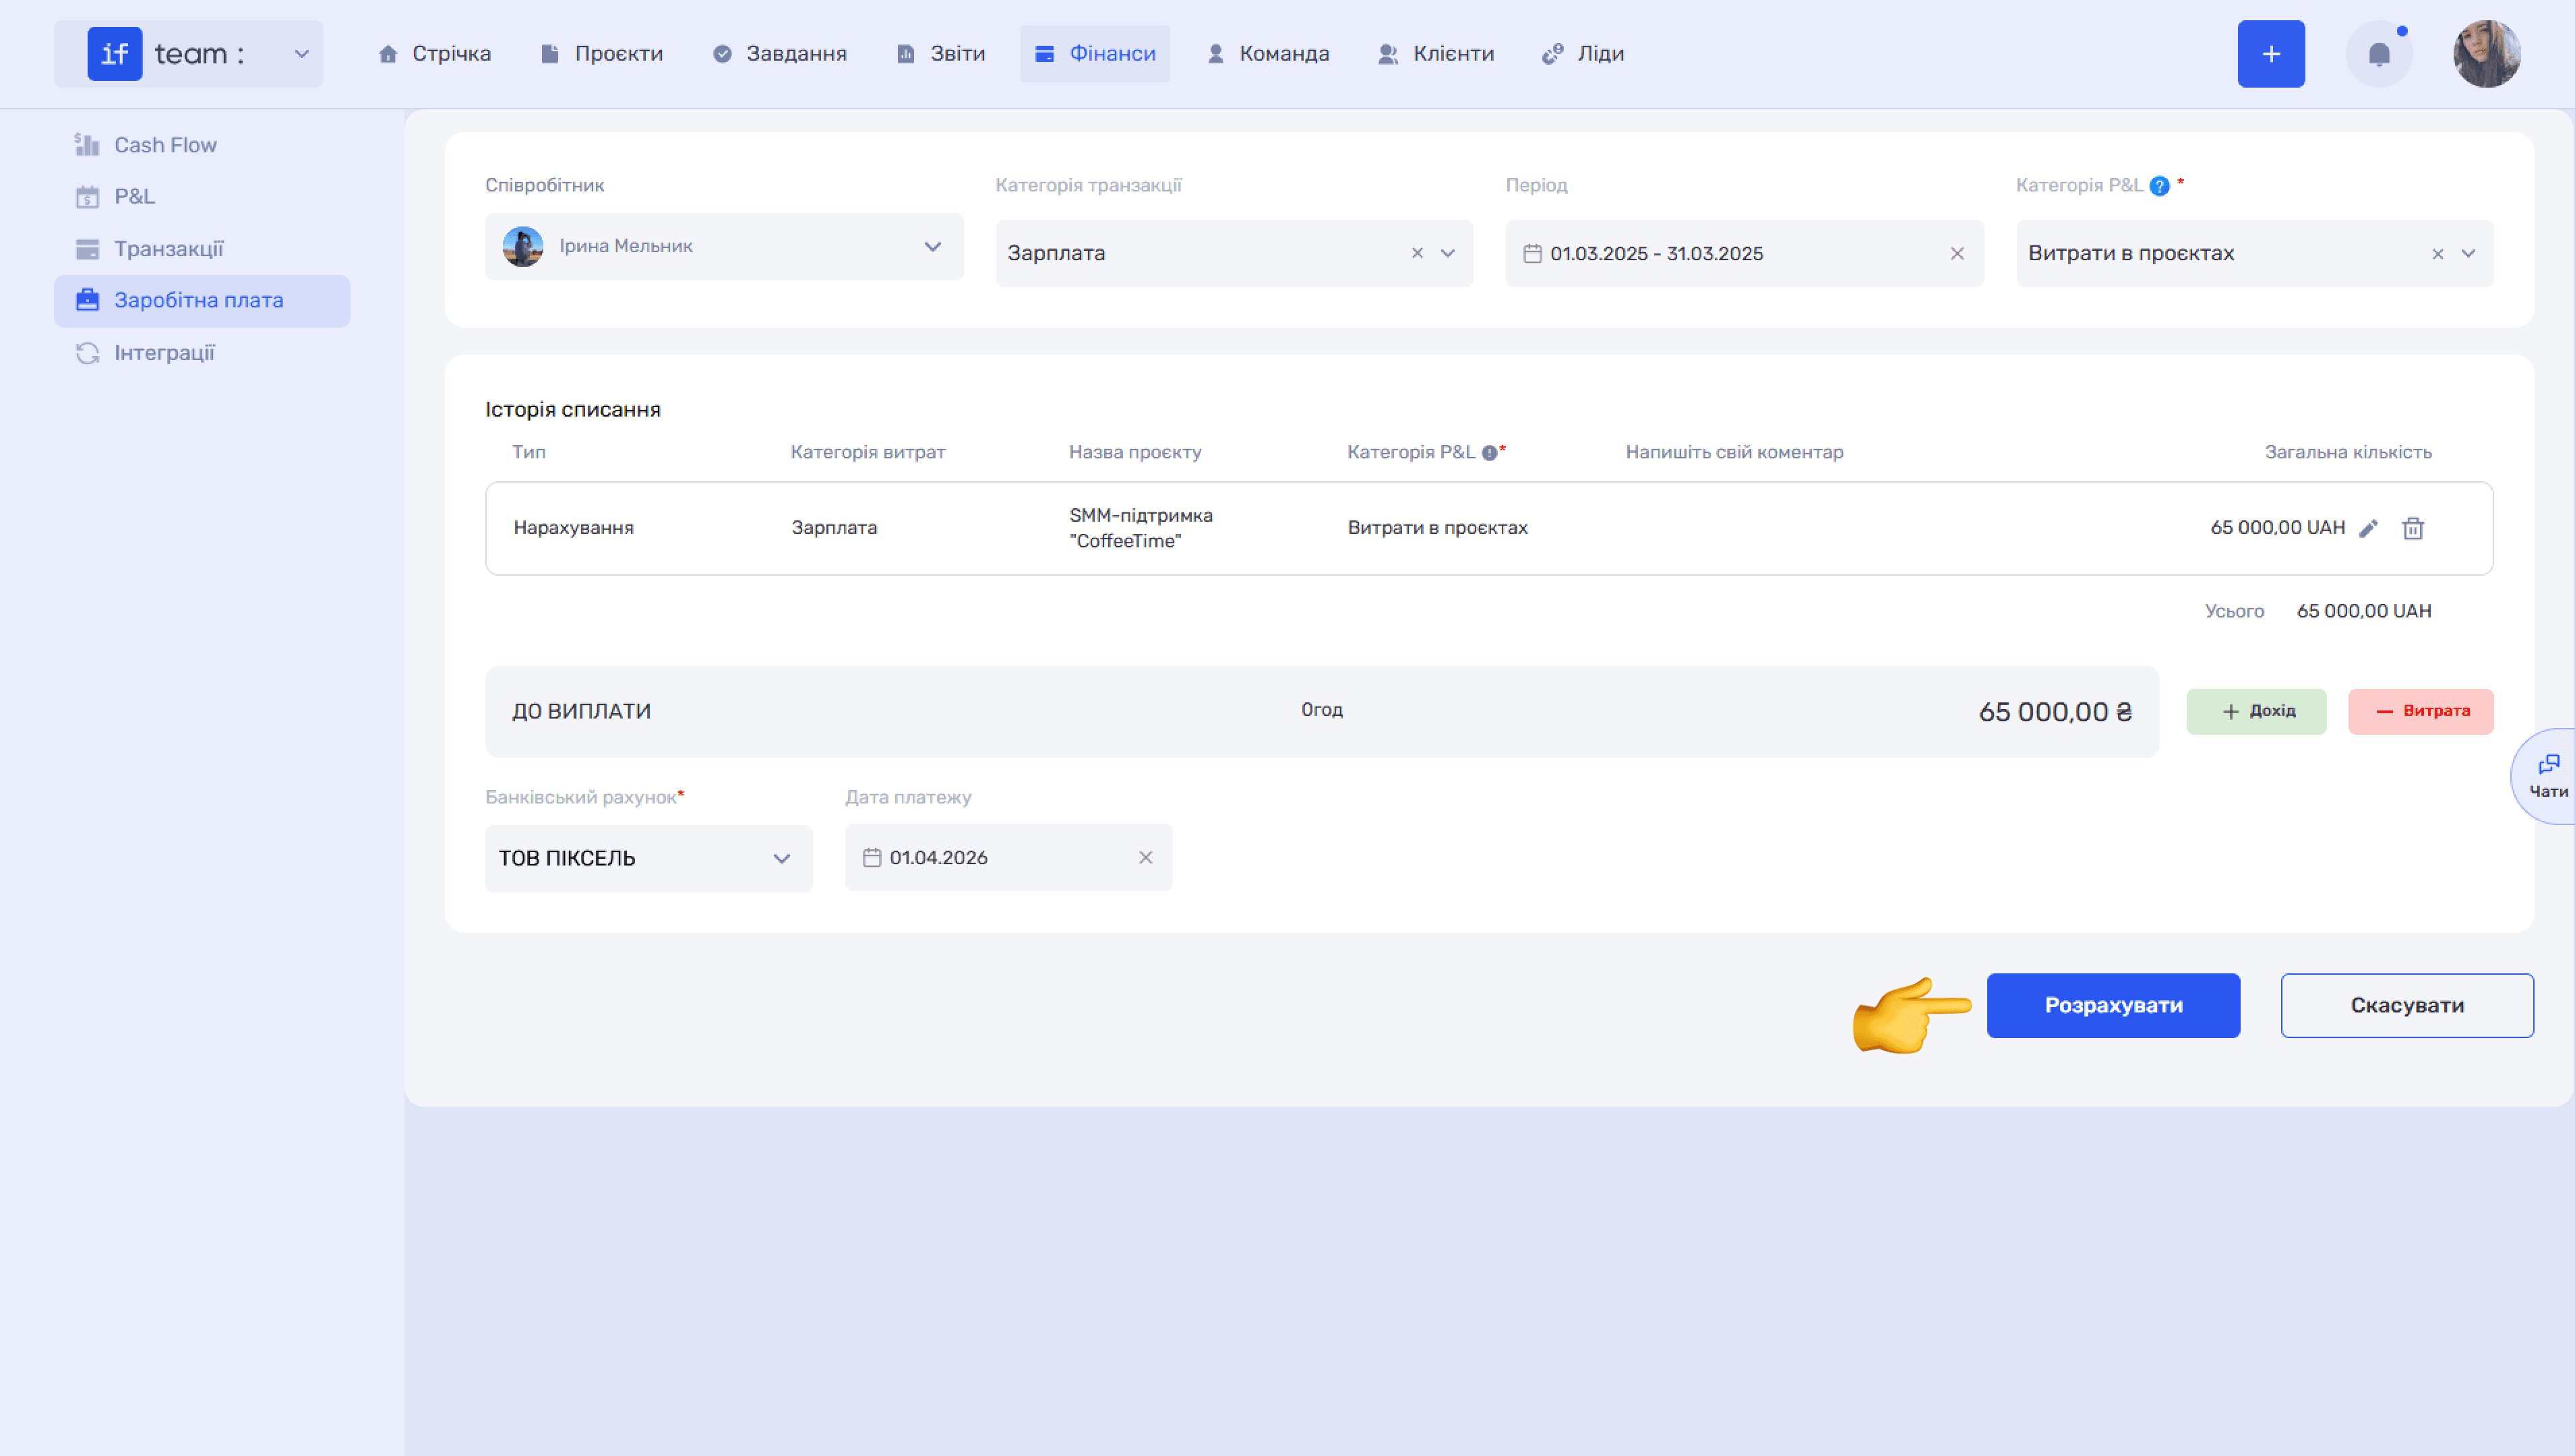
The calendar also lets you create calculations directly from the grid. Select the required day for an employee to display a tooltip with the selected period and the Calculate button. The system automatically accounts for the employee’s rate, sick leave, and vacation.
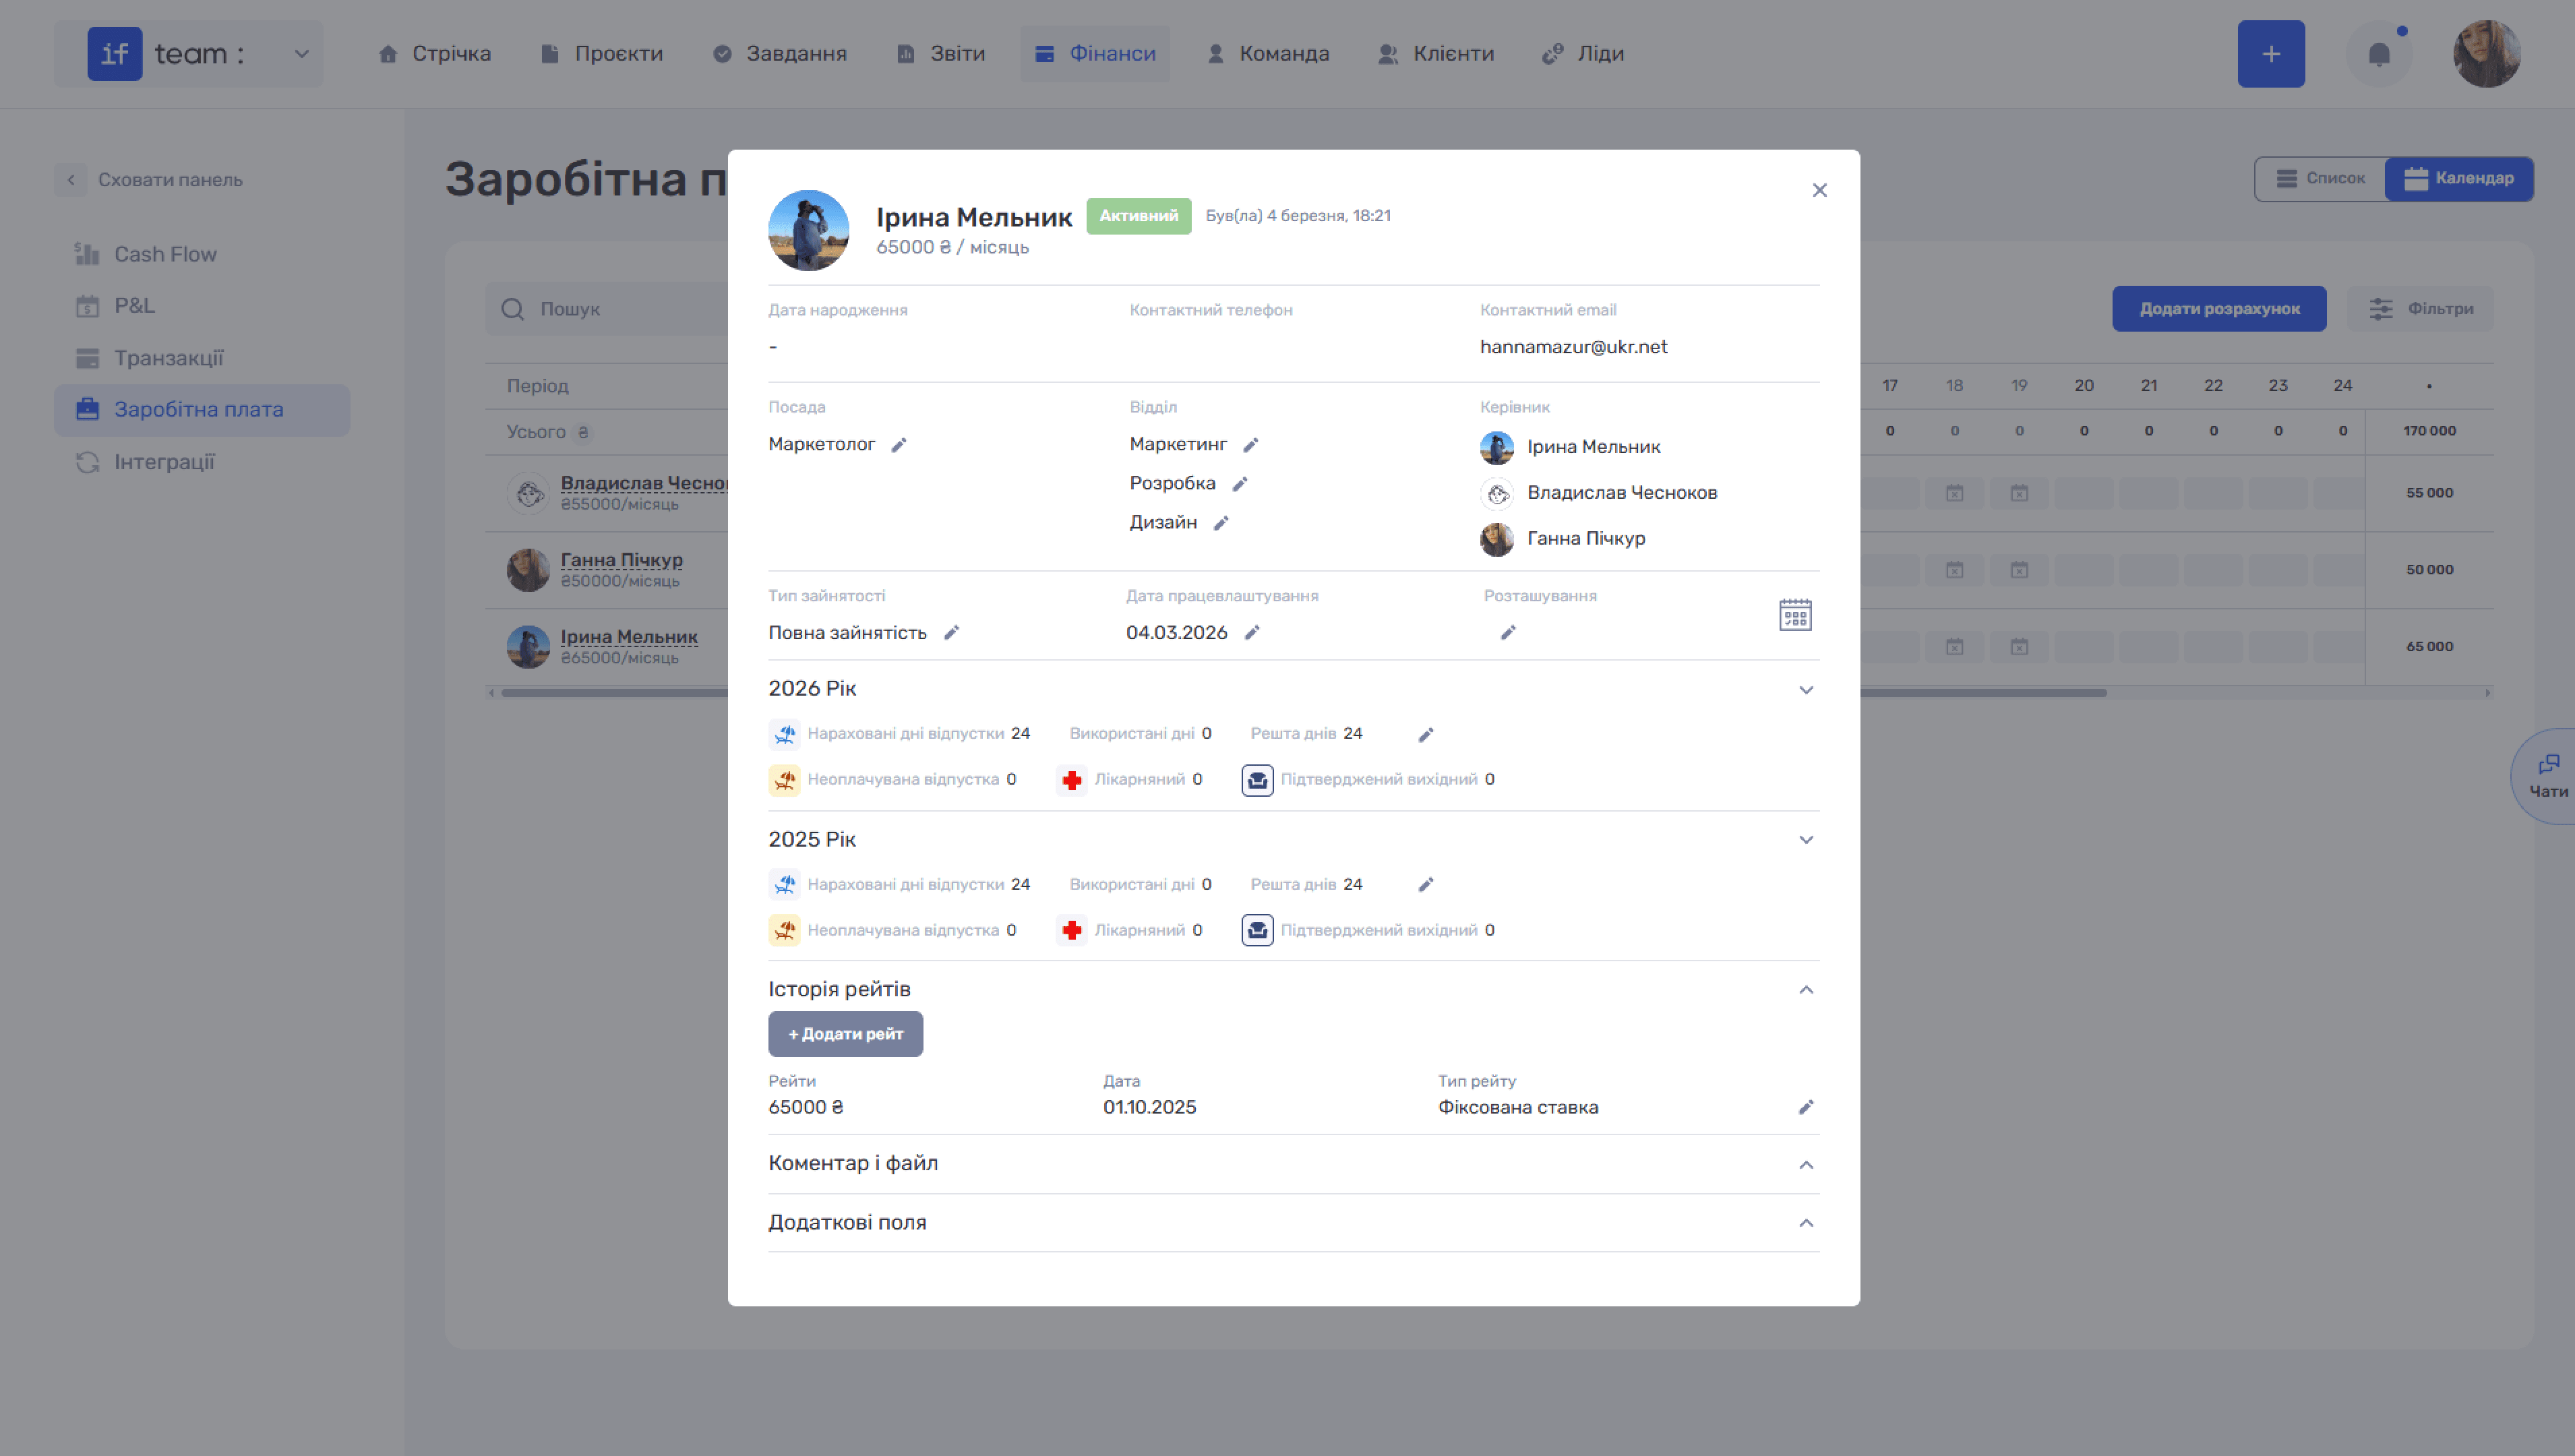
Employee Card. Click an employee’s name to open a pop-up with detailed information: photo, contact details, position, department, manager, employment type, employment date, accrued vacation and sick days, and rate history with dates and types—hourly or fixed.
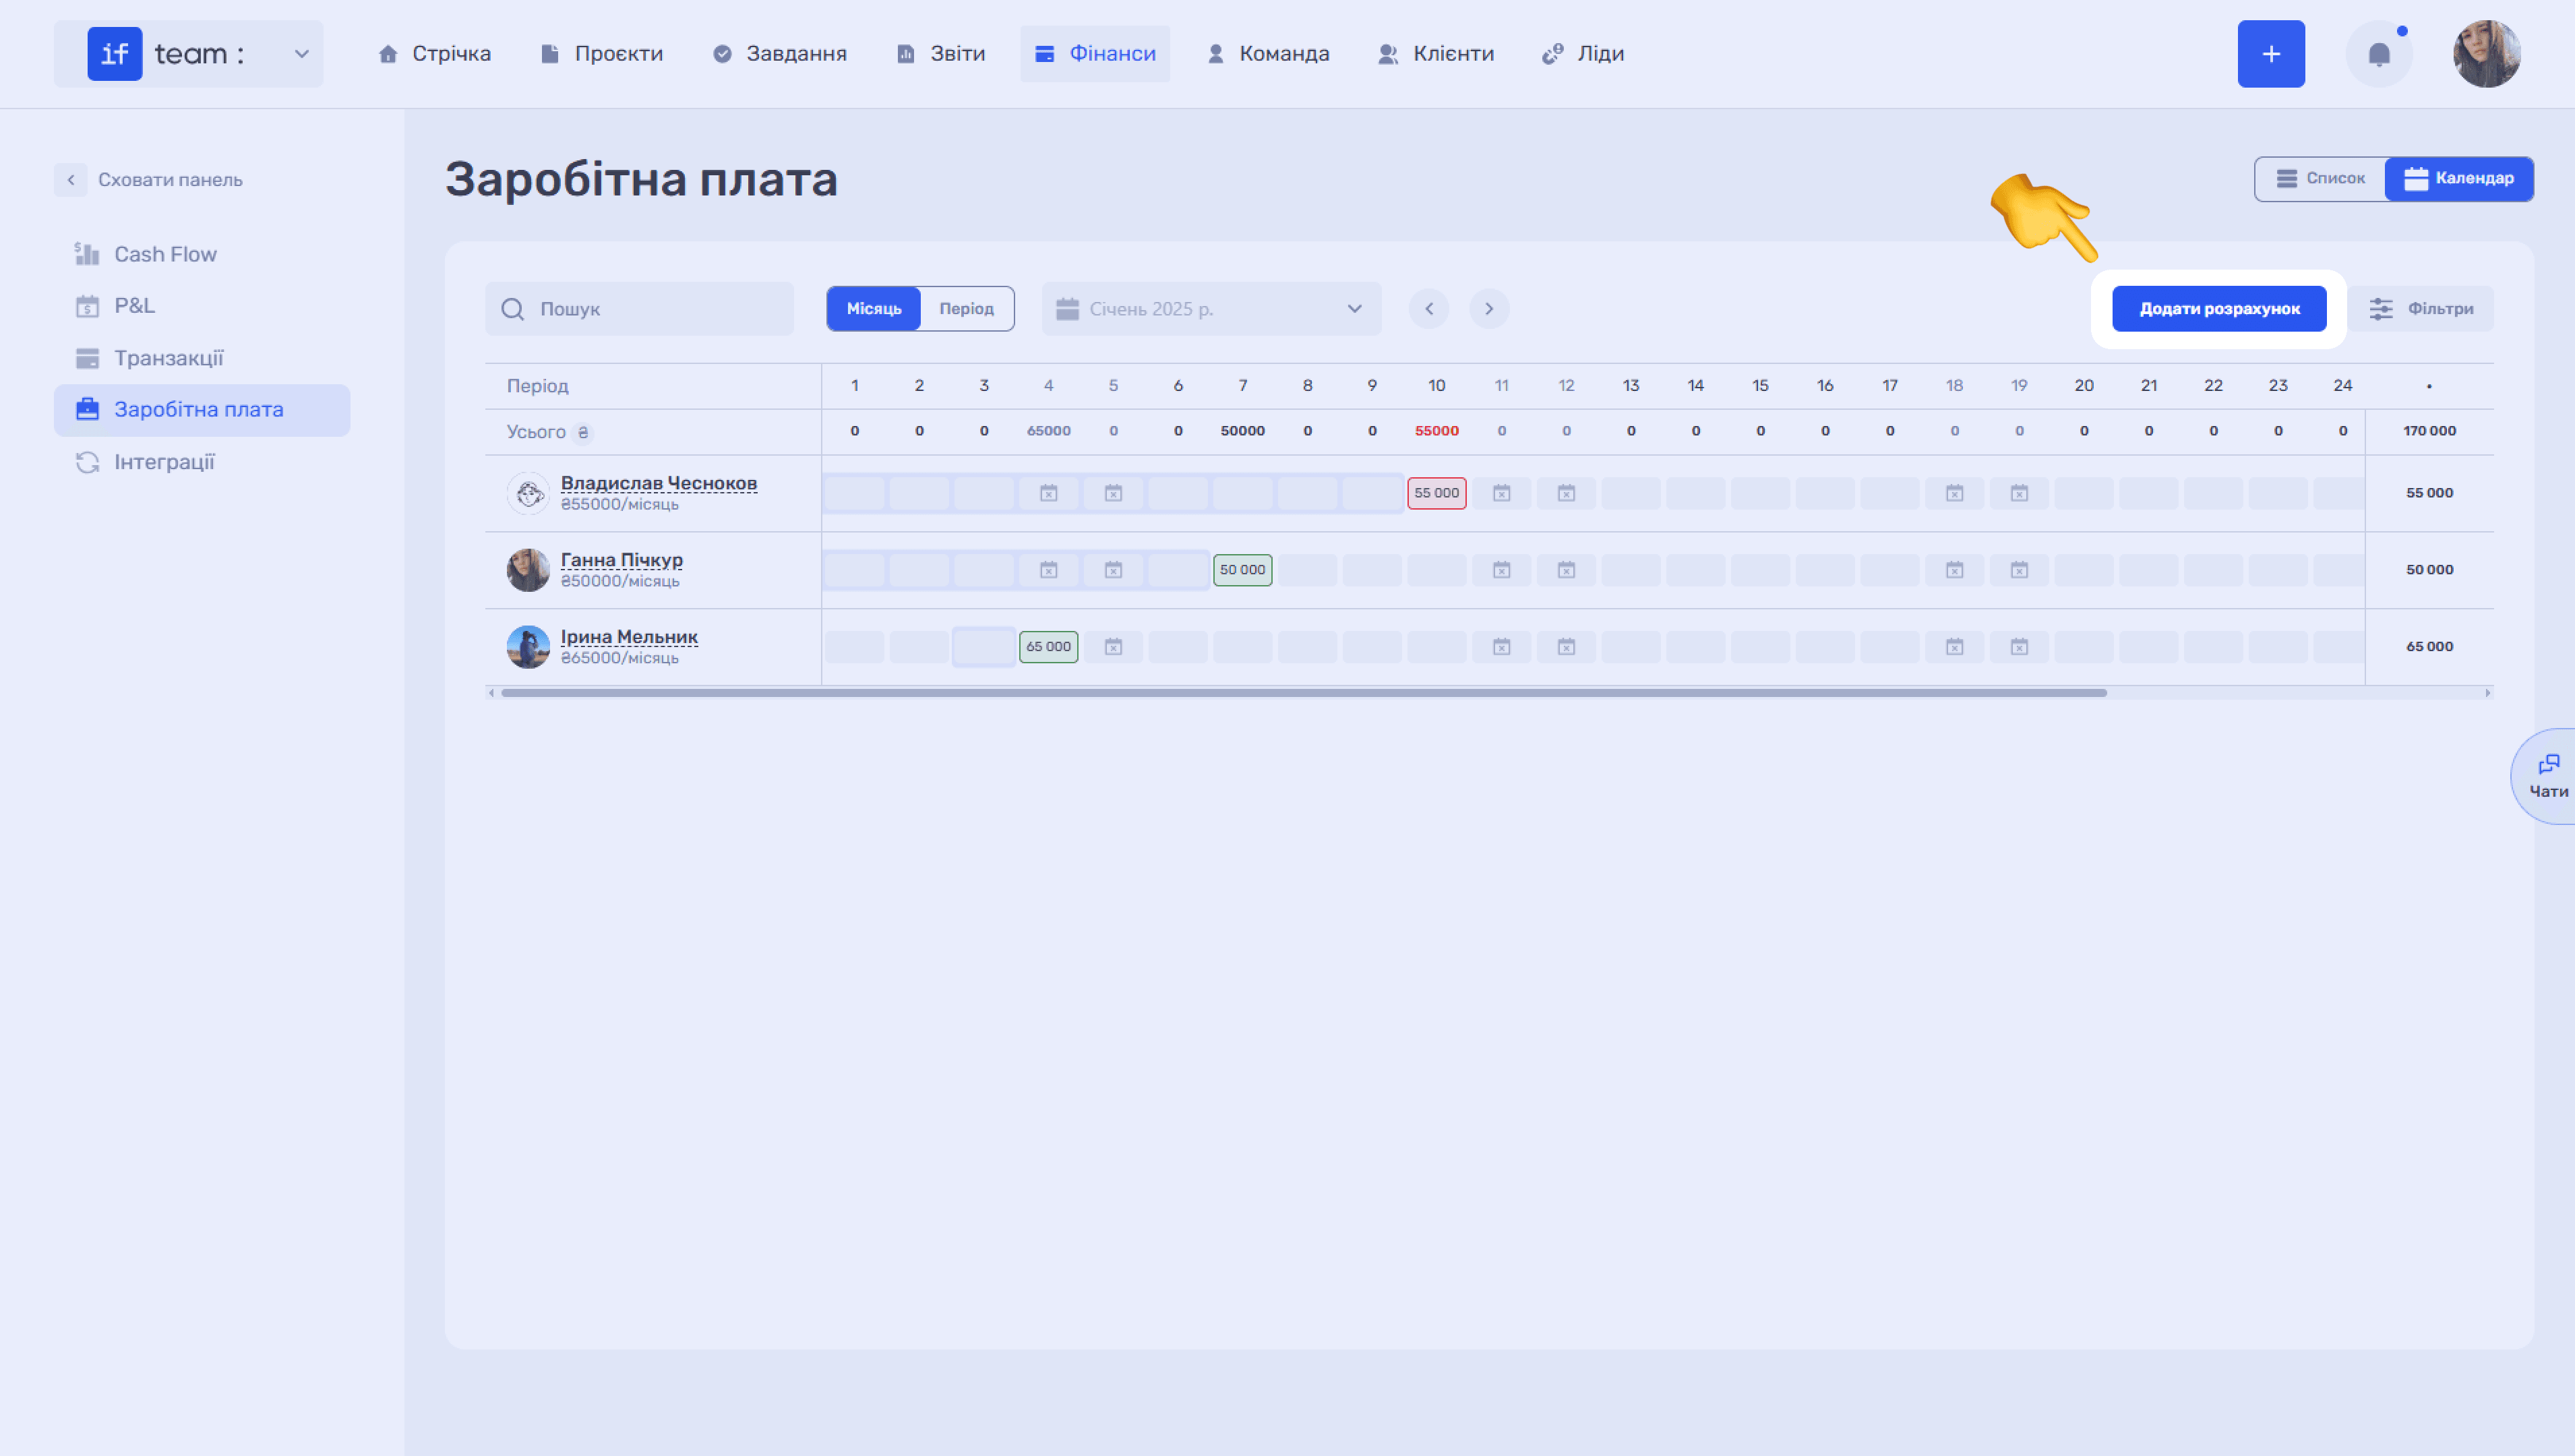
Add Calculation. Click Add Calculation in the upper-right corner to create a new payroll calculation.
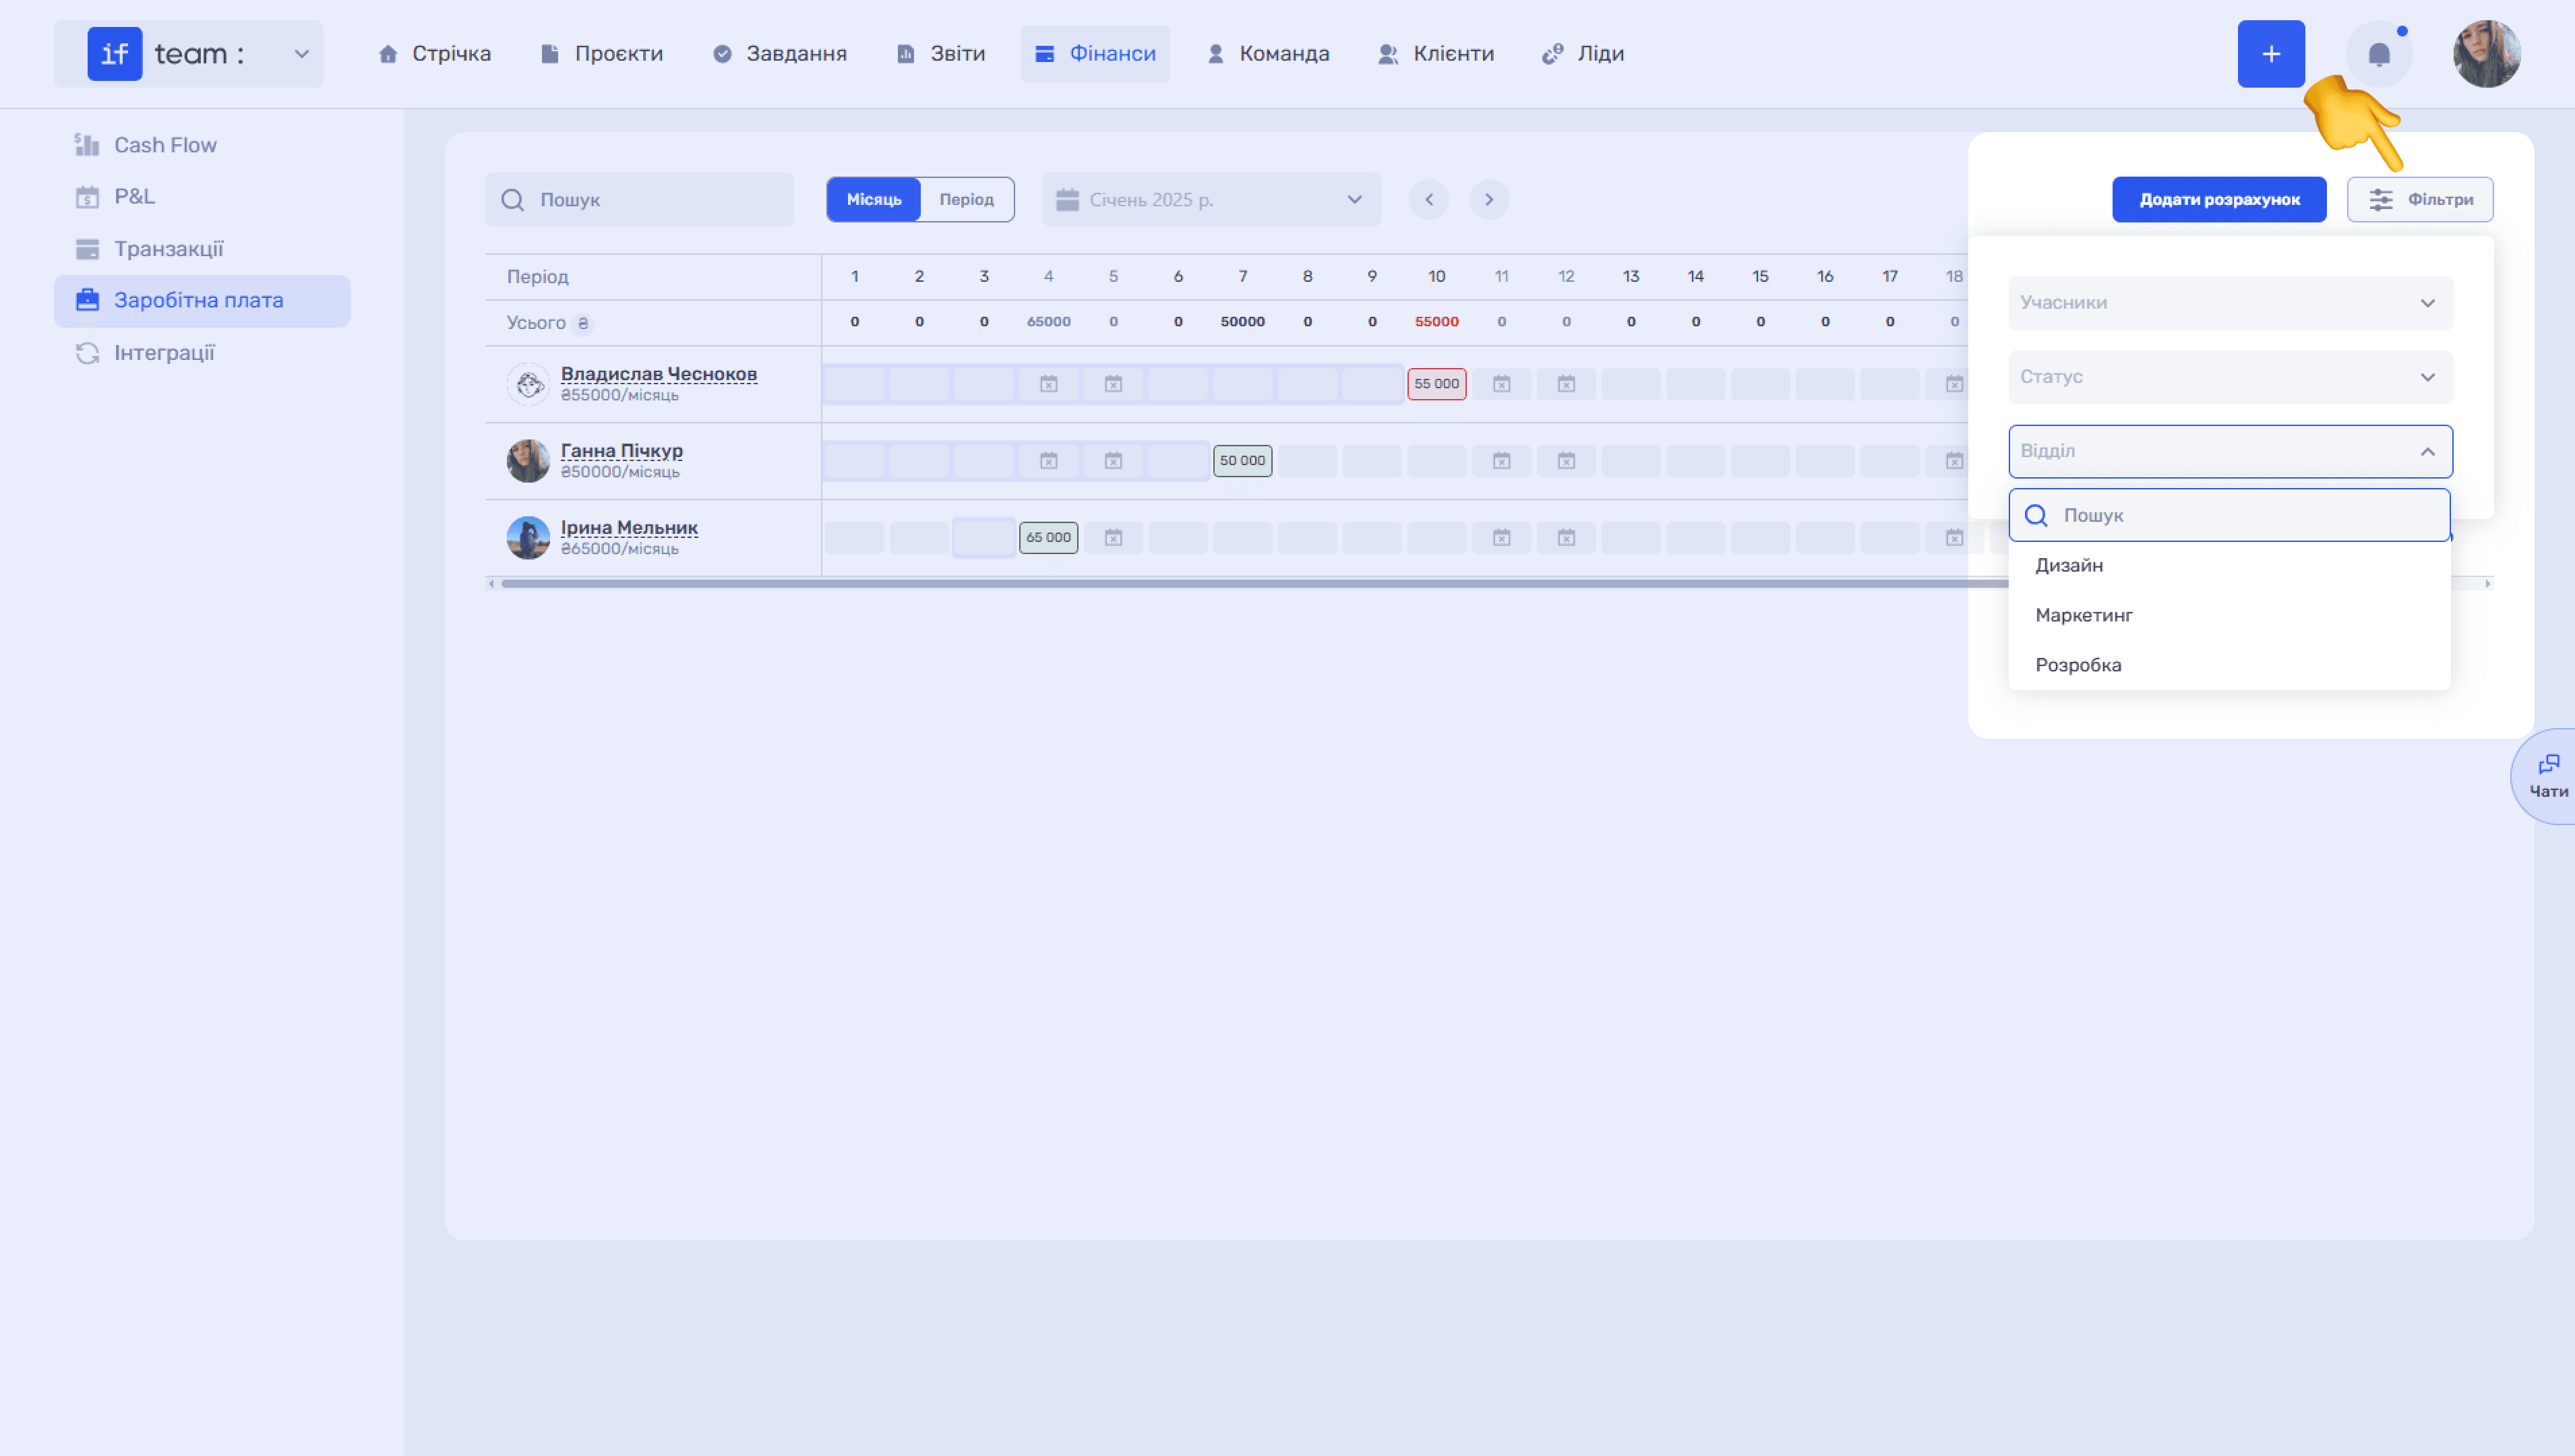
Filters. Click Filters to select calculations by date, participants, status, and department.
Payment Integrations
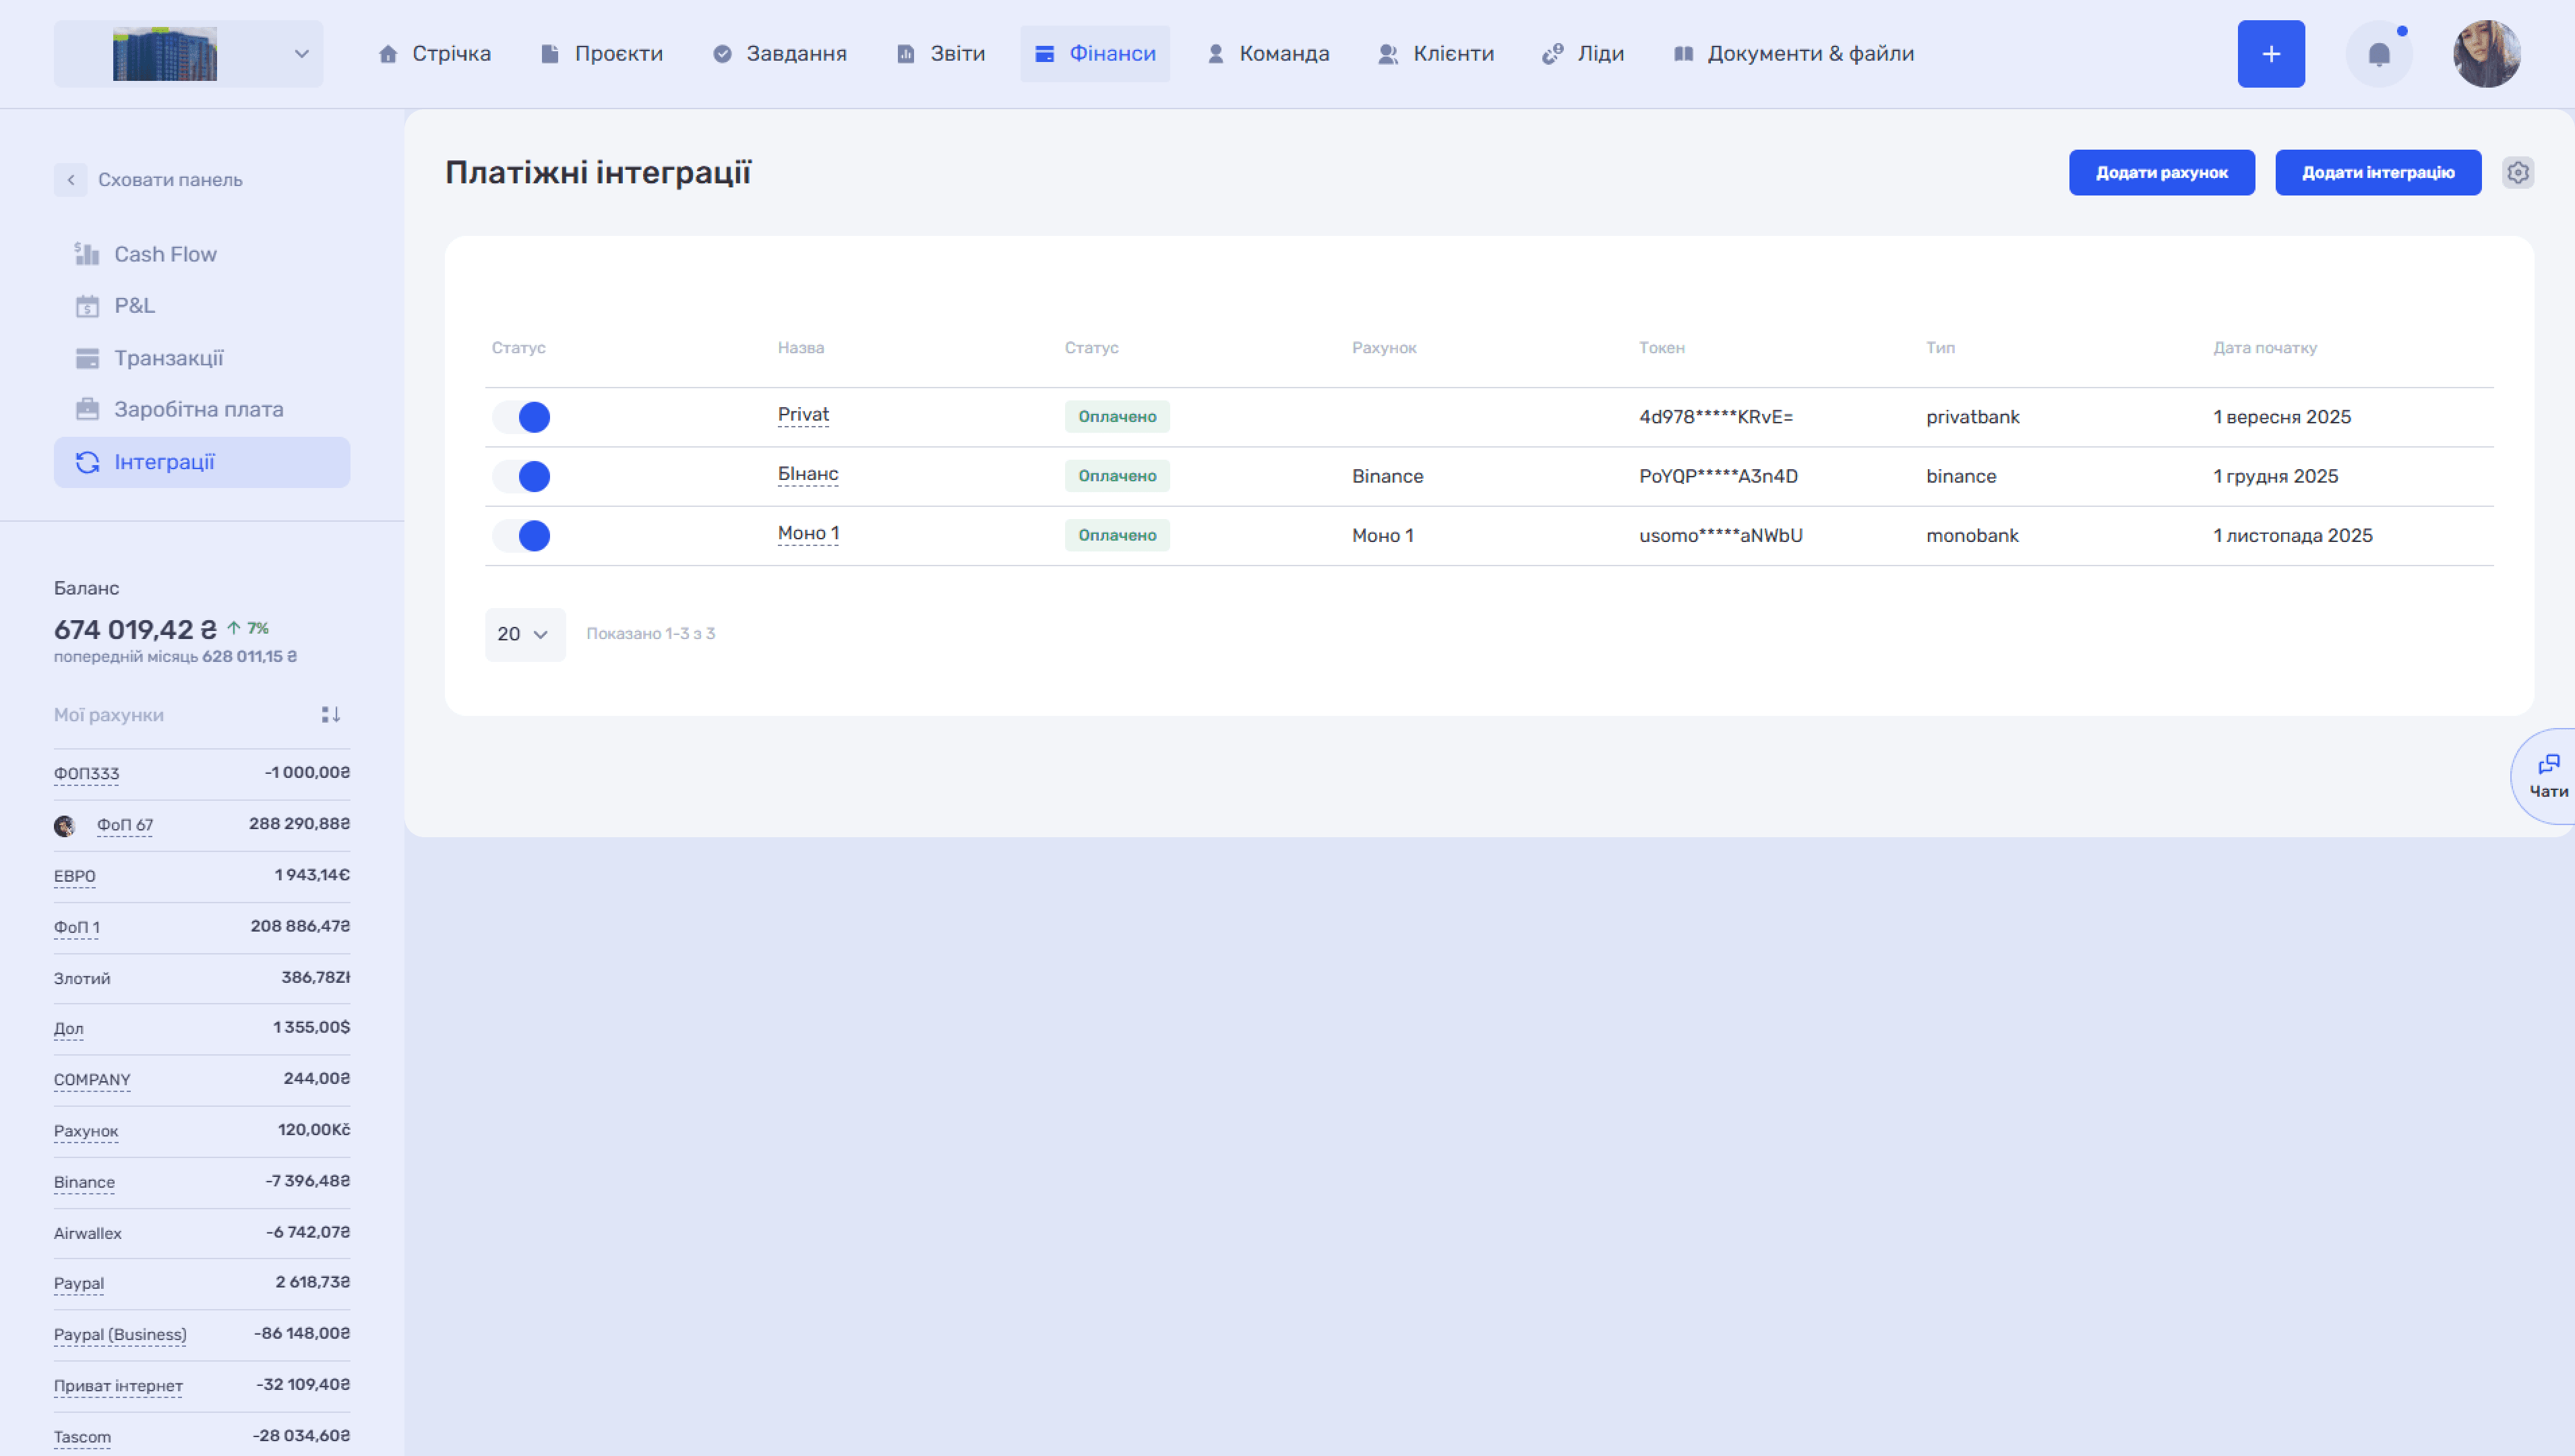
The Integrations subsection lets you connect company bank accounts to if.team, either manually or through an automatic bank integration.
Add an Account
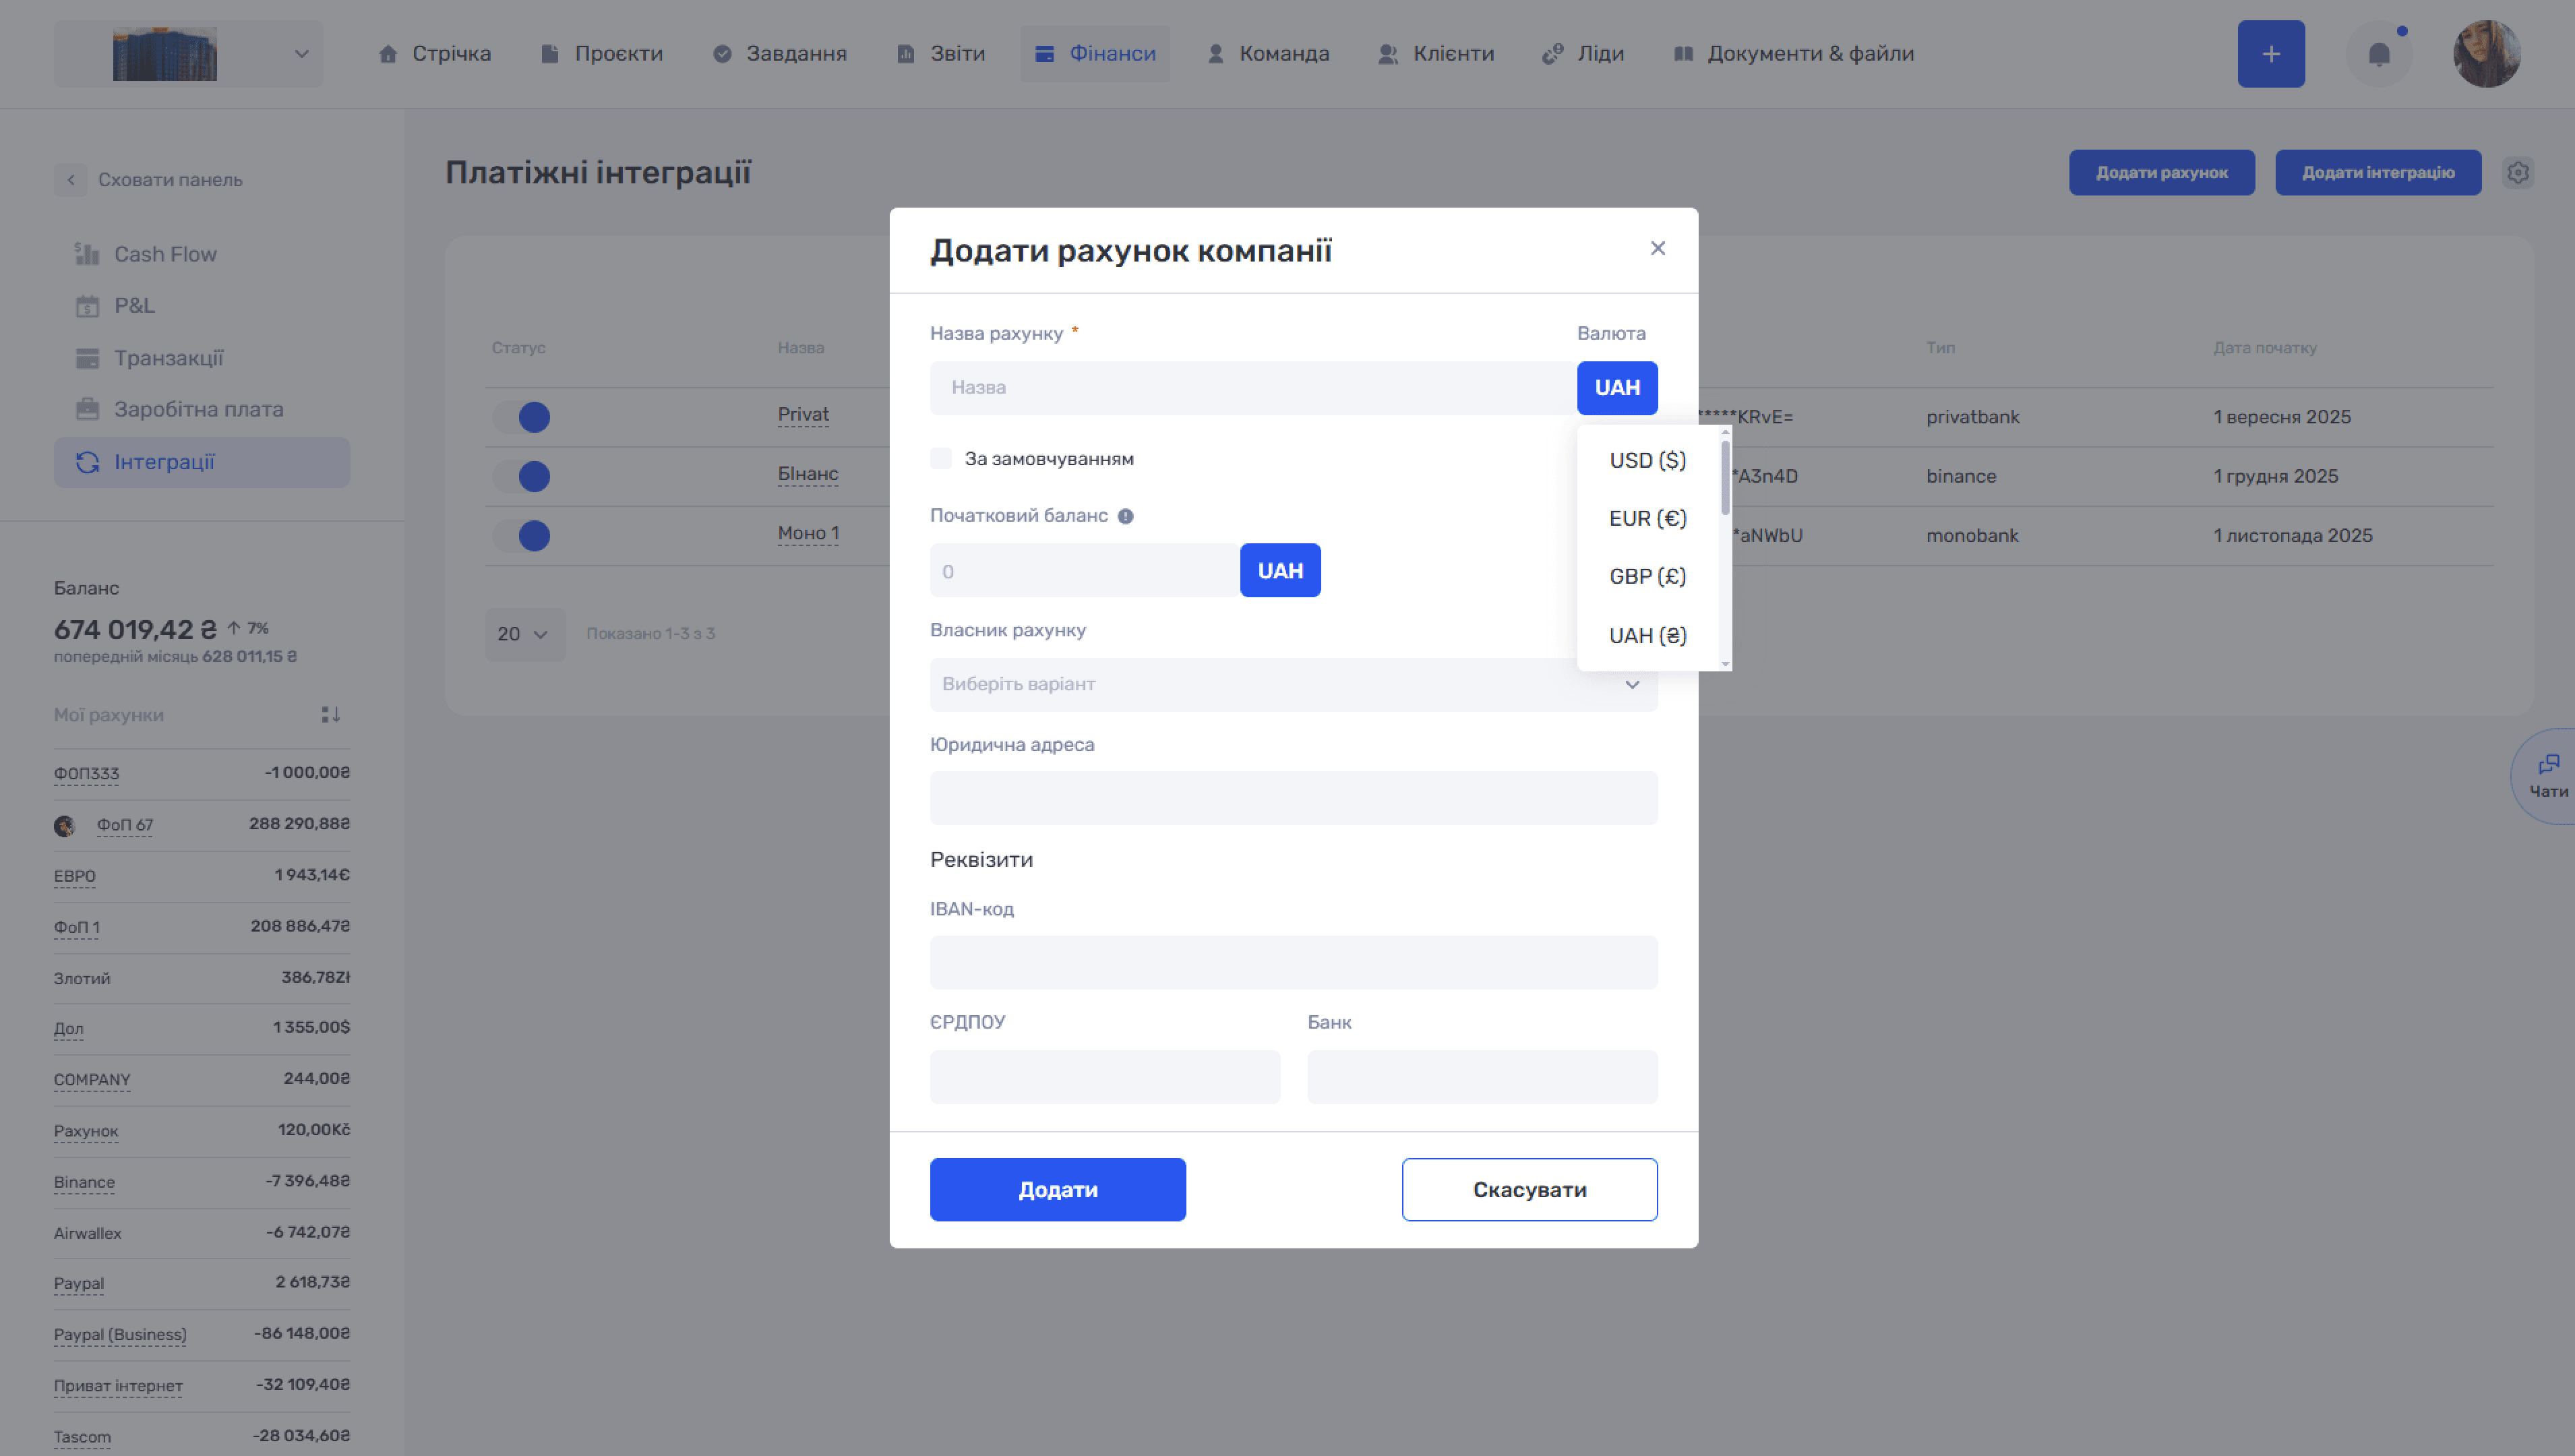
Click Add Account to create a company bank account manually. Complete the following fields in the modal:
- Account Name is required for convenient identification.
- Currency is UAH by default.
- Default makes this the primary account.
- Opening Balance is the current account balance when it is added.
- Account Owner is selected from the company’s employees or counterparties.
- Registered Address is the account owner’s address.
- Bank Details are the IBAN, company registration number, and bank name.
When everything is complete, click Add. The account appears on the integrations page and becomes available in financial transactions, payroll calculations, and other operations.
Add an Integration
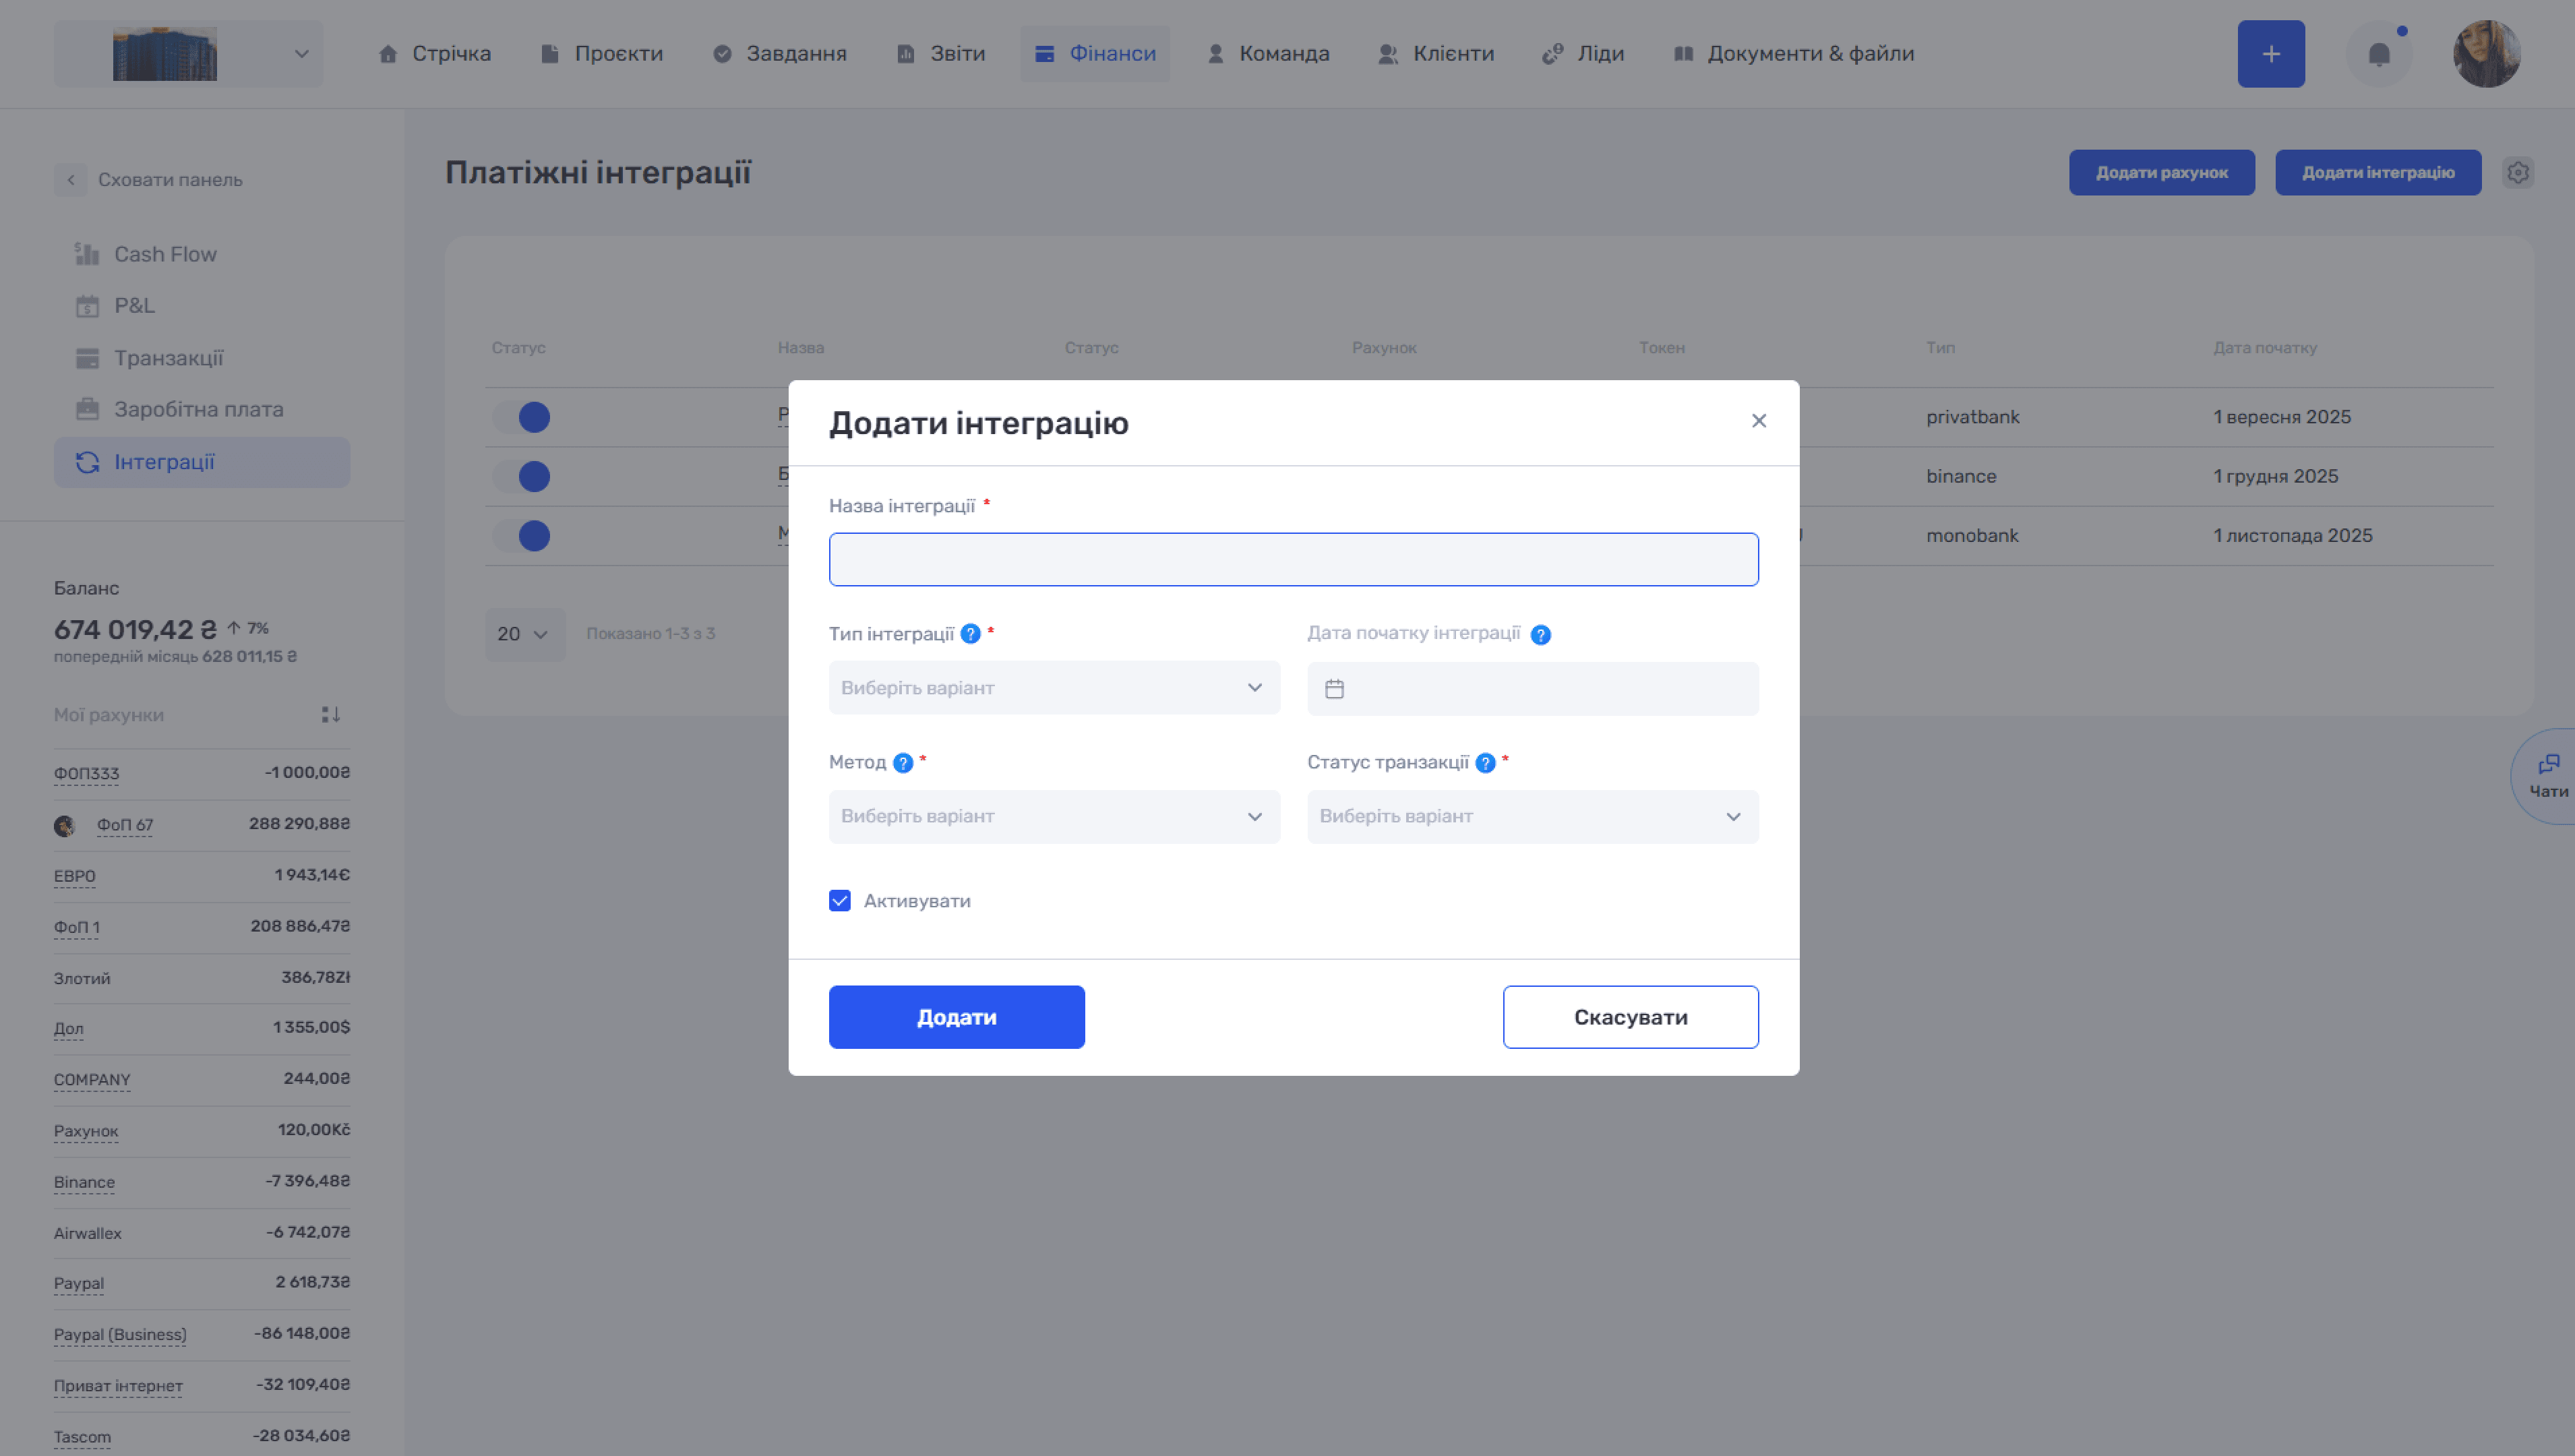
Click Add Integration to connect automatic transaction imports from a bank or payment system. Complete the form fields:
- Payment Integration Name is a custom name used to identify the connection.
- Type is the bank or payment system.
- Start Date is the date from which transactions are imported and cannot be more than 6 months before the current date.
- Integration Method is the payment method automatically assigned to imported transactions.
- Transaction Status is the default status assigned to new transactions.
- Activate enables the integration immediately after creation.
Once connected, all integrations appear in a table with the following columns: status (active or inactive), name, payment status, linked account, token, type such as PrivatBank, Monobank, or Binance, and start date. Enable or disable each integration using the switch in the first Status column.
Still have questions?
Maybe we haven't added this information yet. But you can always reach out:
Request a demo
Submit a request and we'll show you how the service works and its capabilities.
Book a demo