Viewing Reports
The Reports section brings key statistics on projects, tasks, and work time together in one place. It helps you control expenses, assess team performance, and track how much time and money is allocated to each project.
The section contains three tabs: Projects, Tasks, and Time. Use the tab panel in the upper-right corner of the page to switch between them.
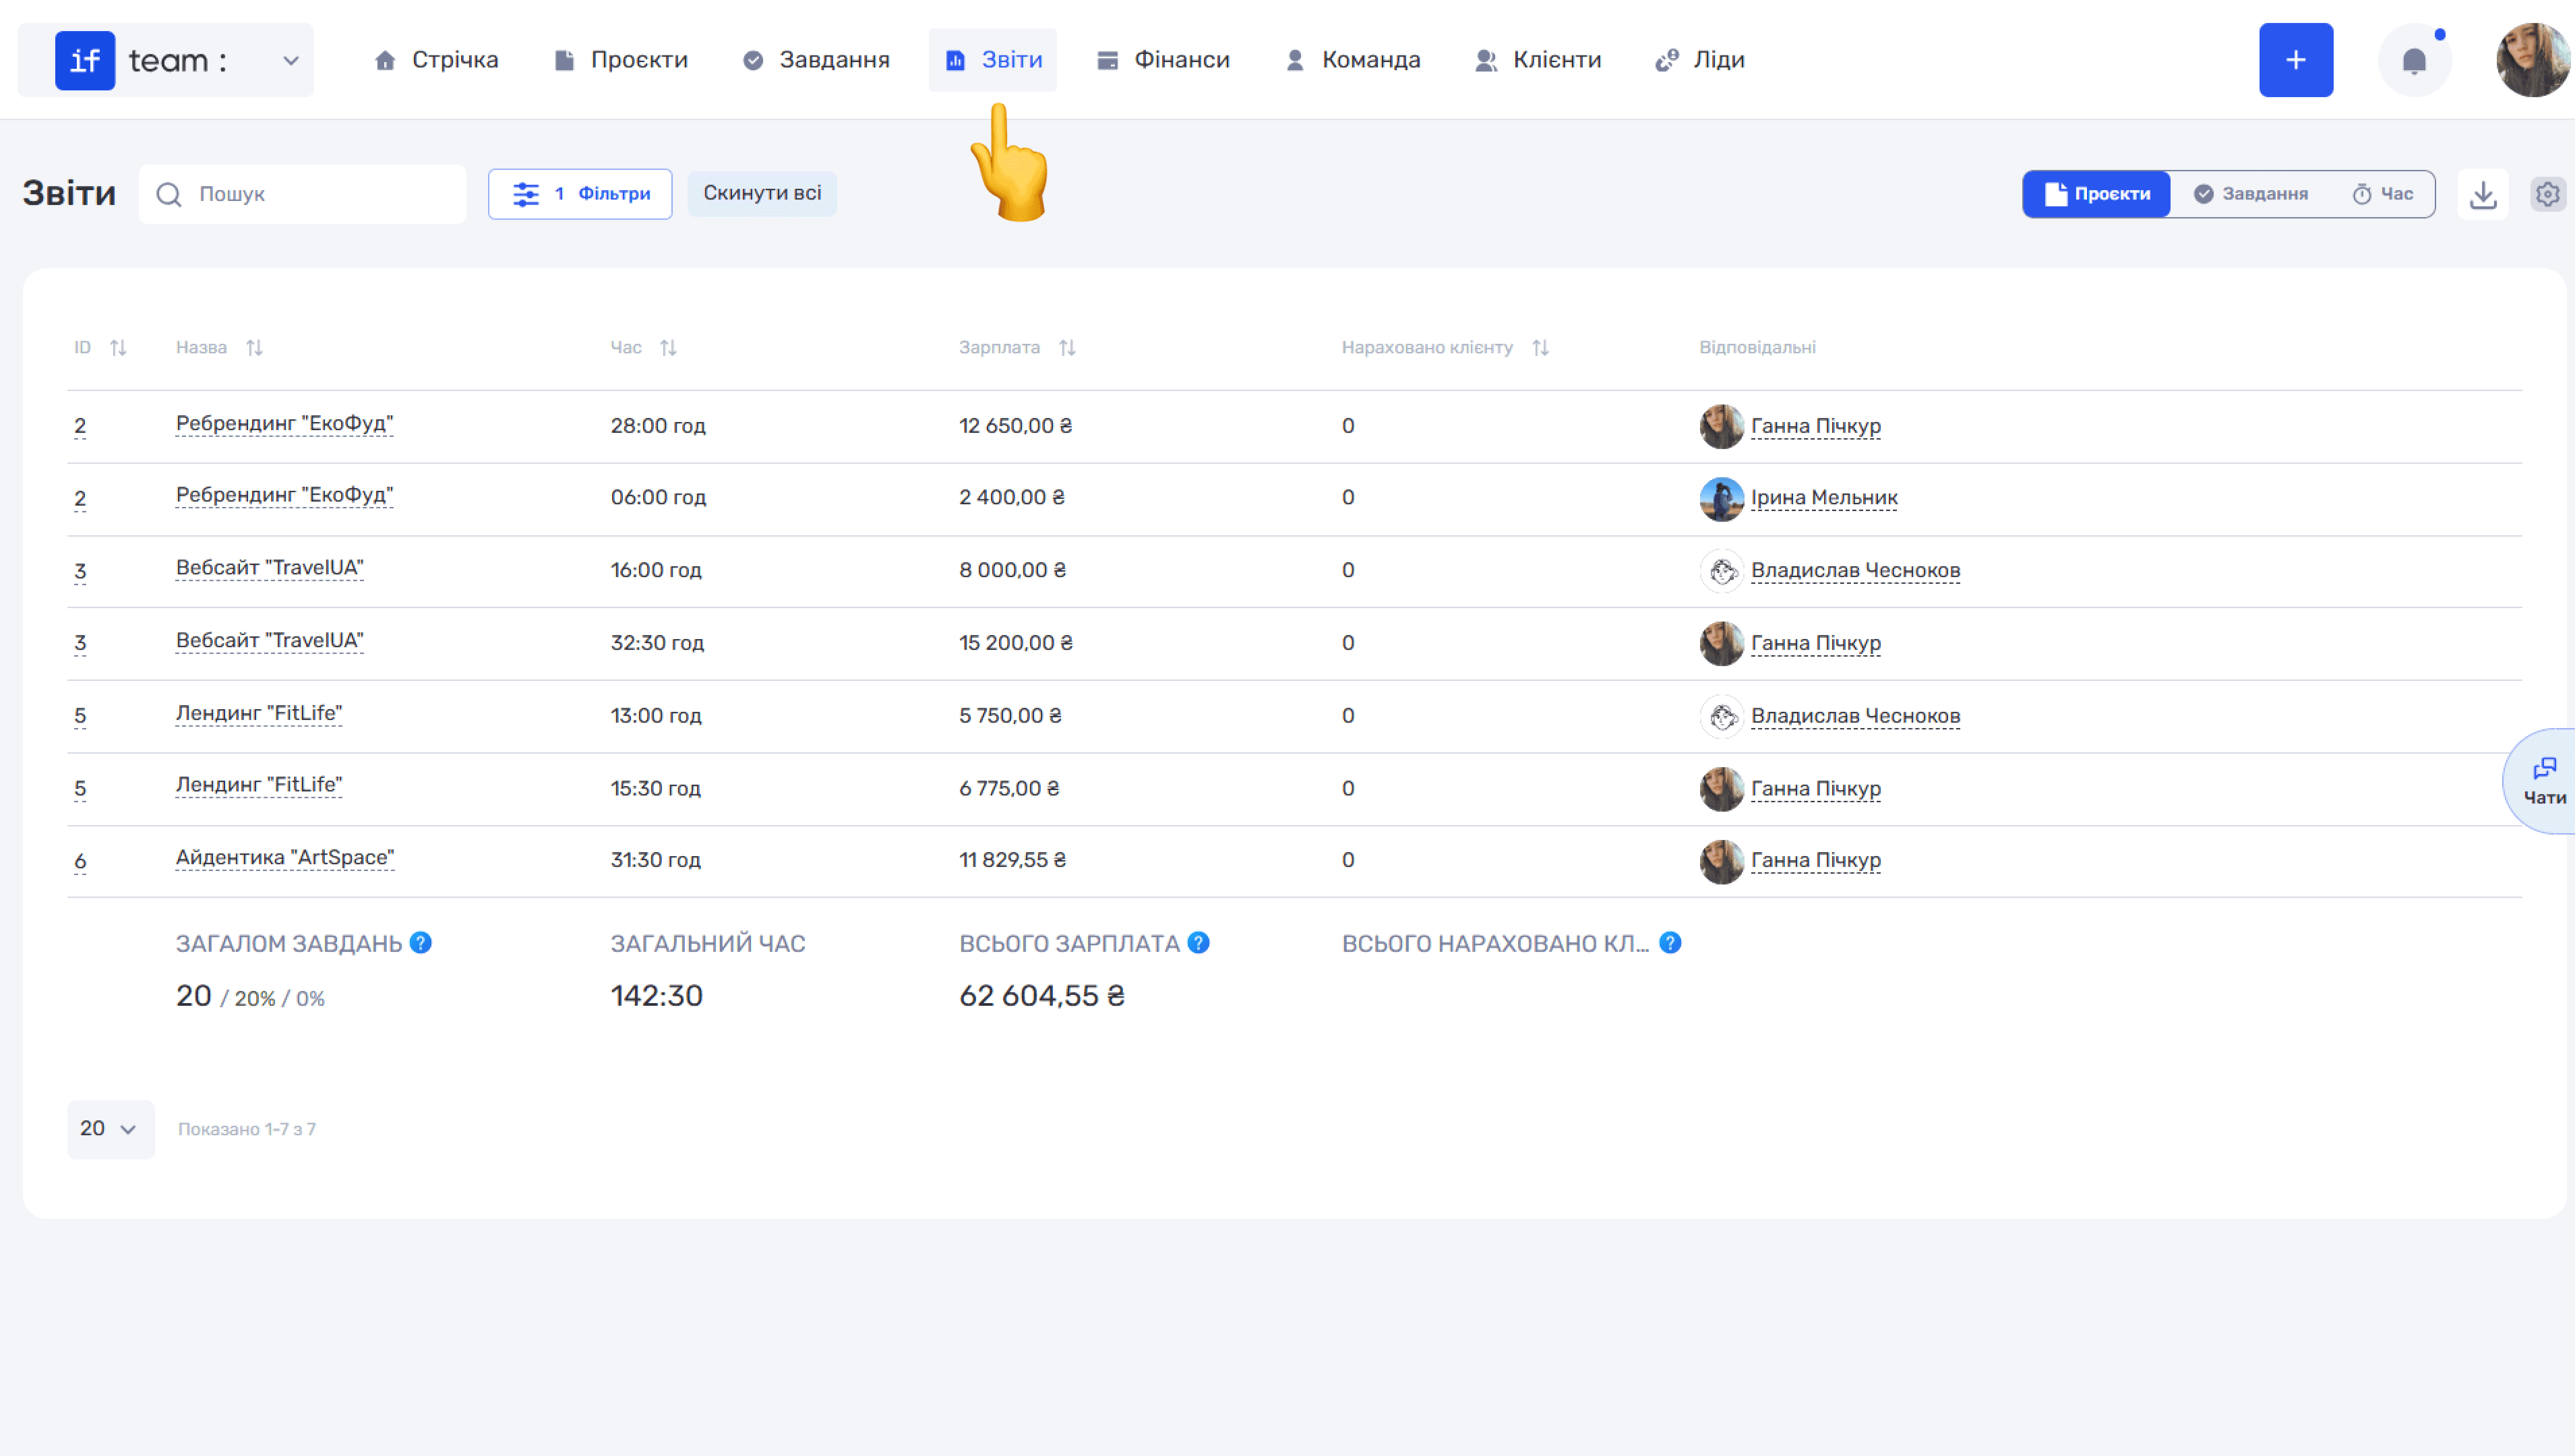
Report by Project
The Projects tab is a summary table in which each row corresponds to a specific project and responsible employee. The table shows the project name, time worked, accrued salary, amount billed to the client, and the responsible employee.
The bottom of the table shows summary metrics: the total number of tasks, including completion and revision percentages; total time; total salary across all projects; and the total amount billed to clients for Time & Material projects at the commercial rate.
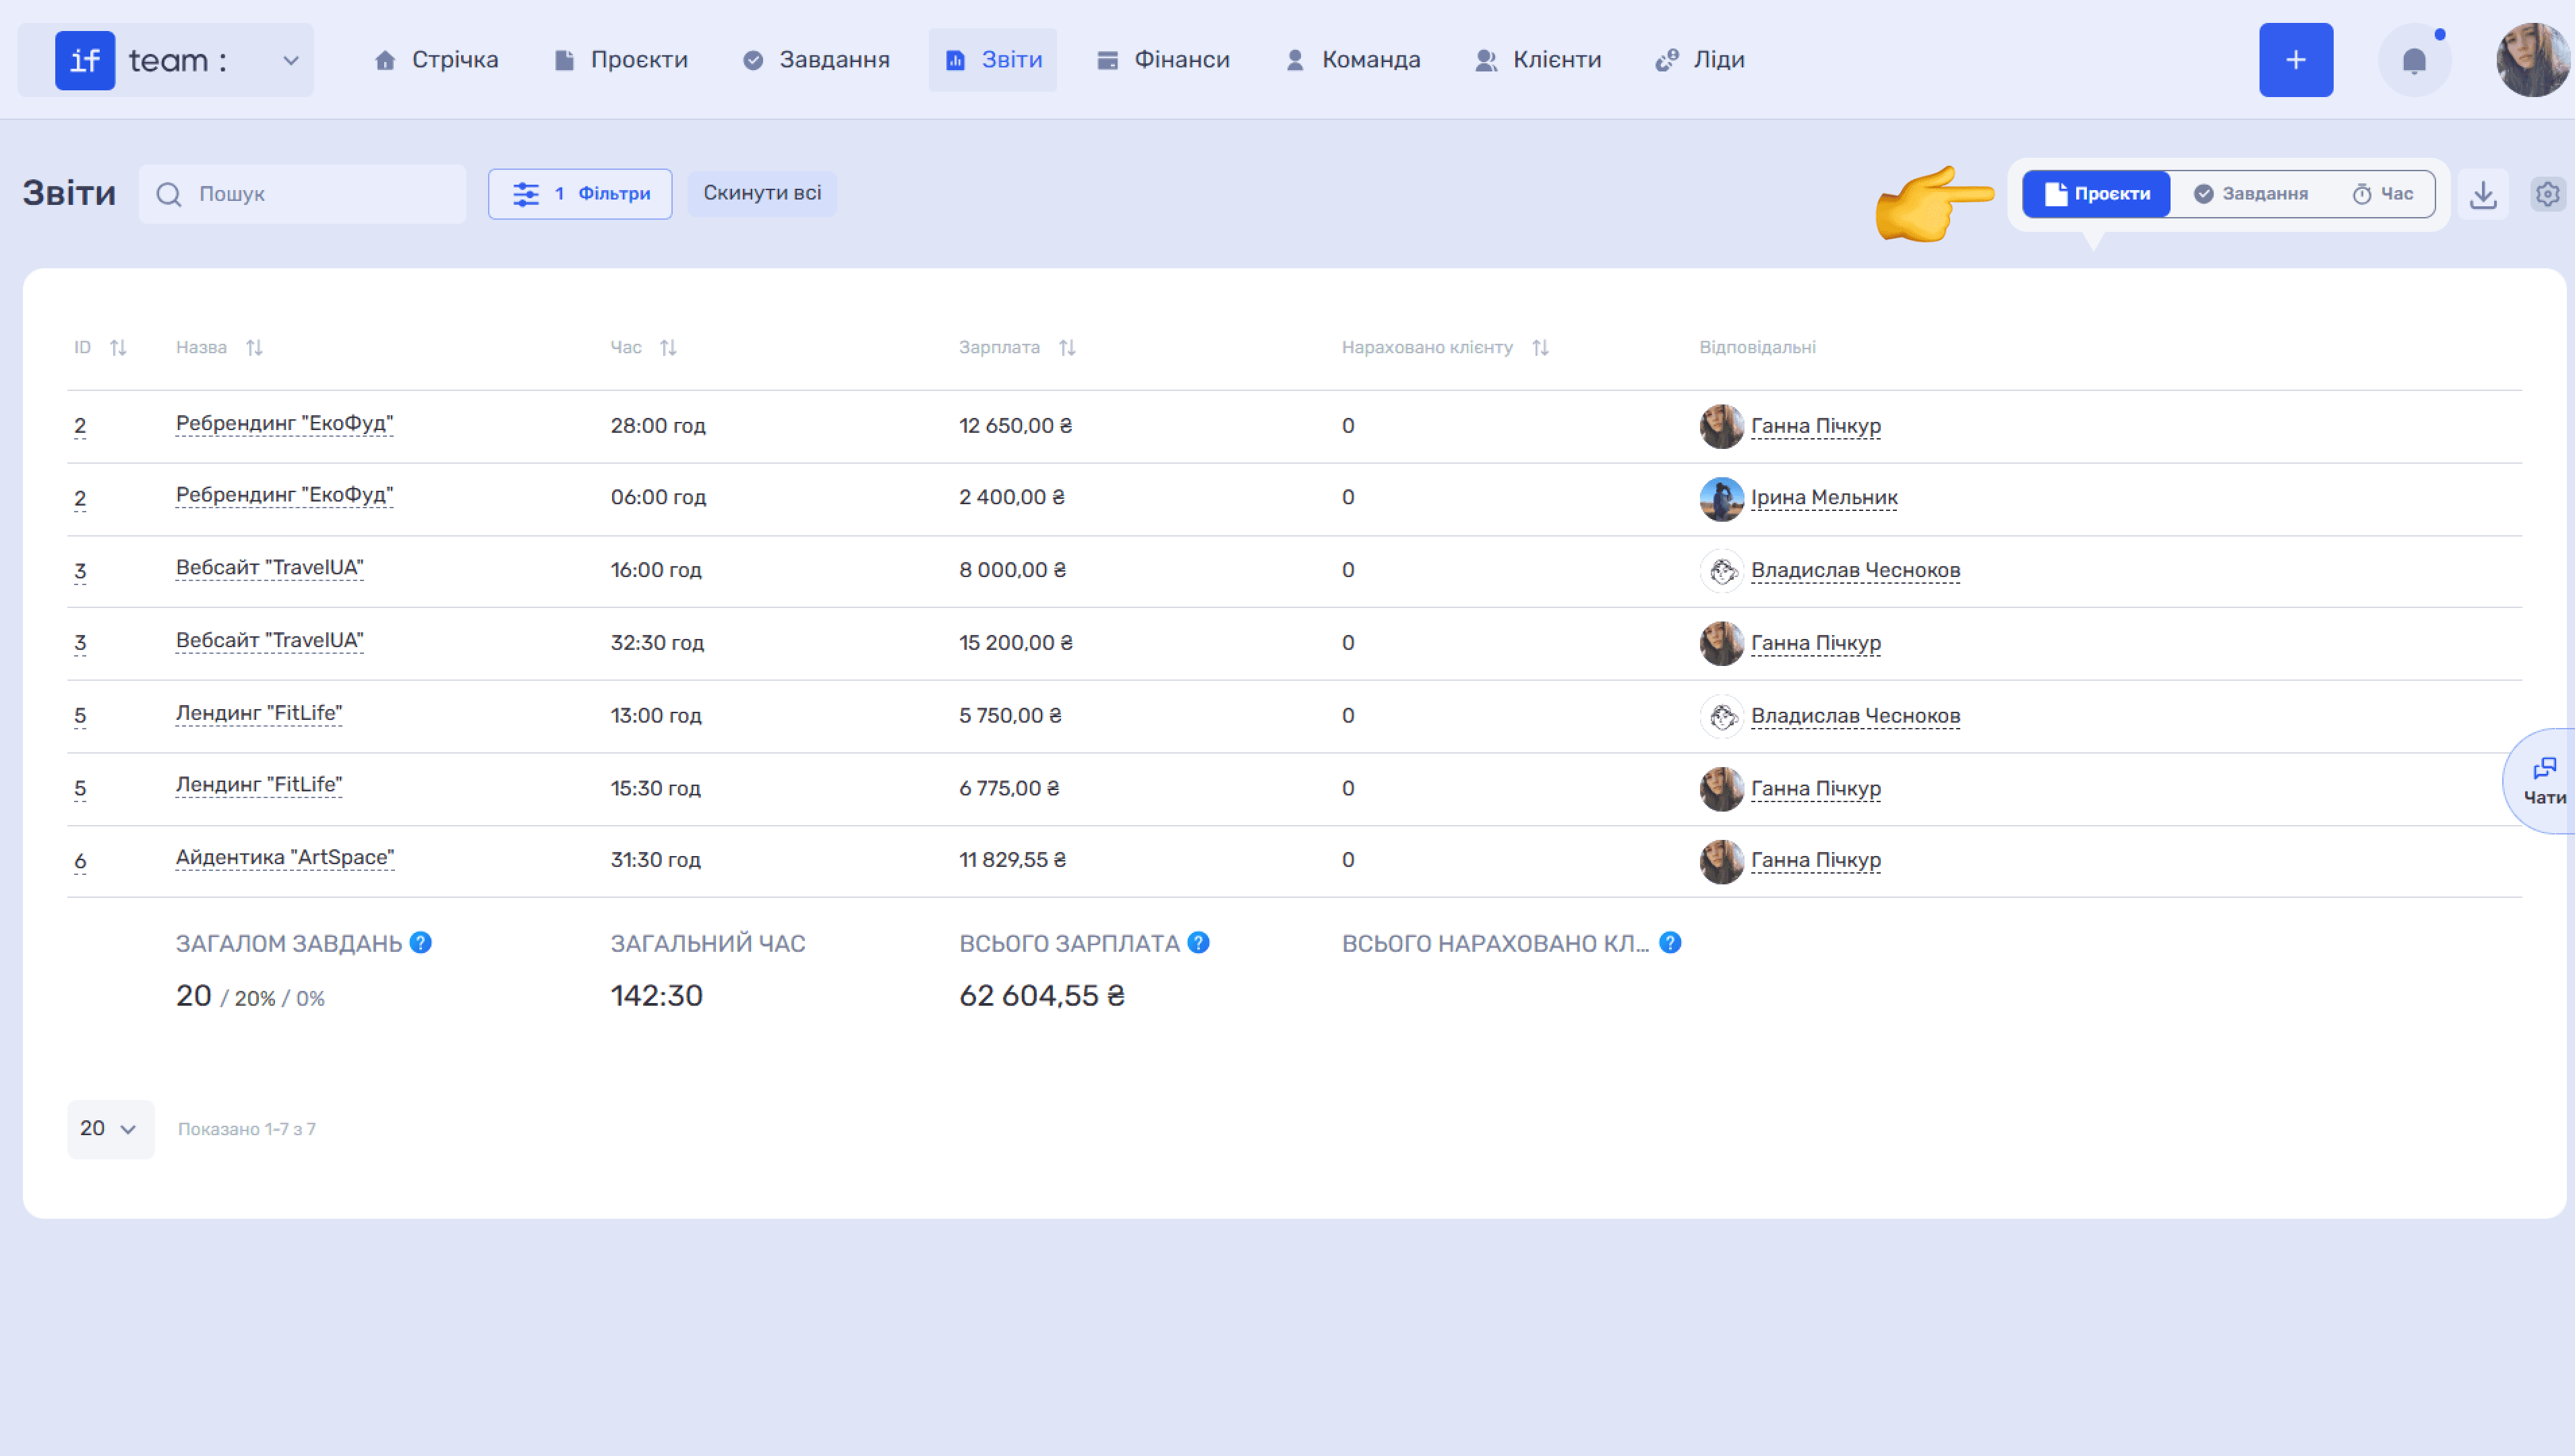
Filters. To narrow the results, click Filters. In the drop-down menu, you can filter data by project, responsible employee, period, internal or commercial rate, and client.
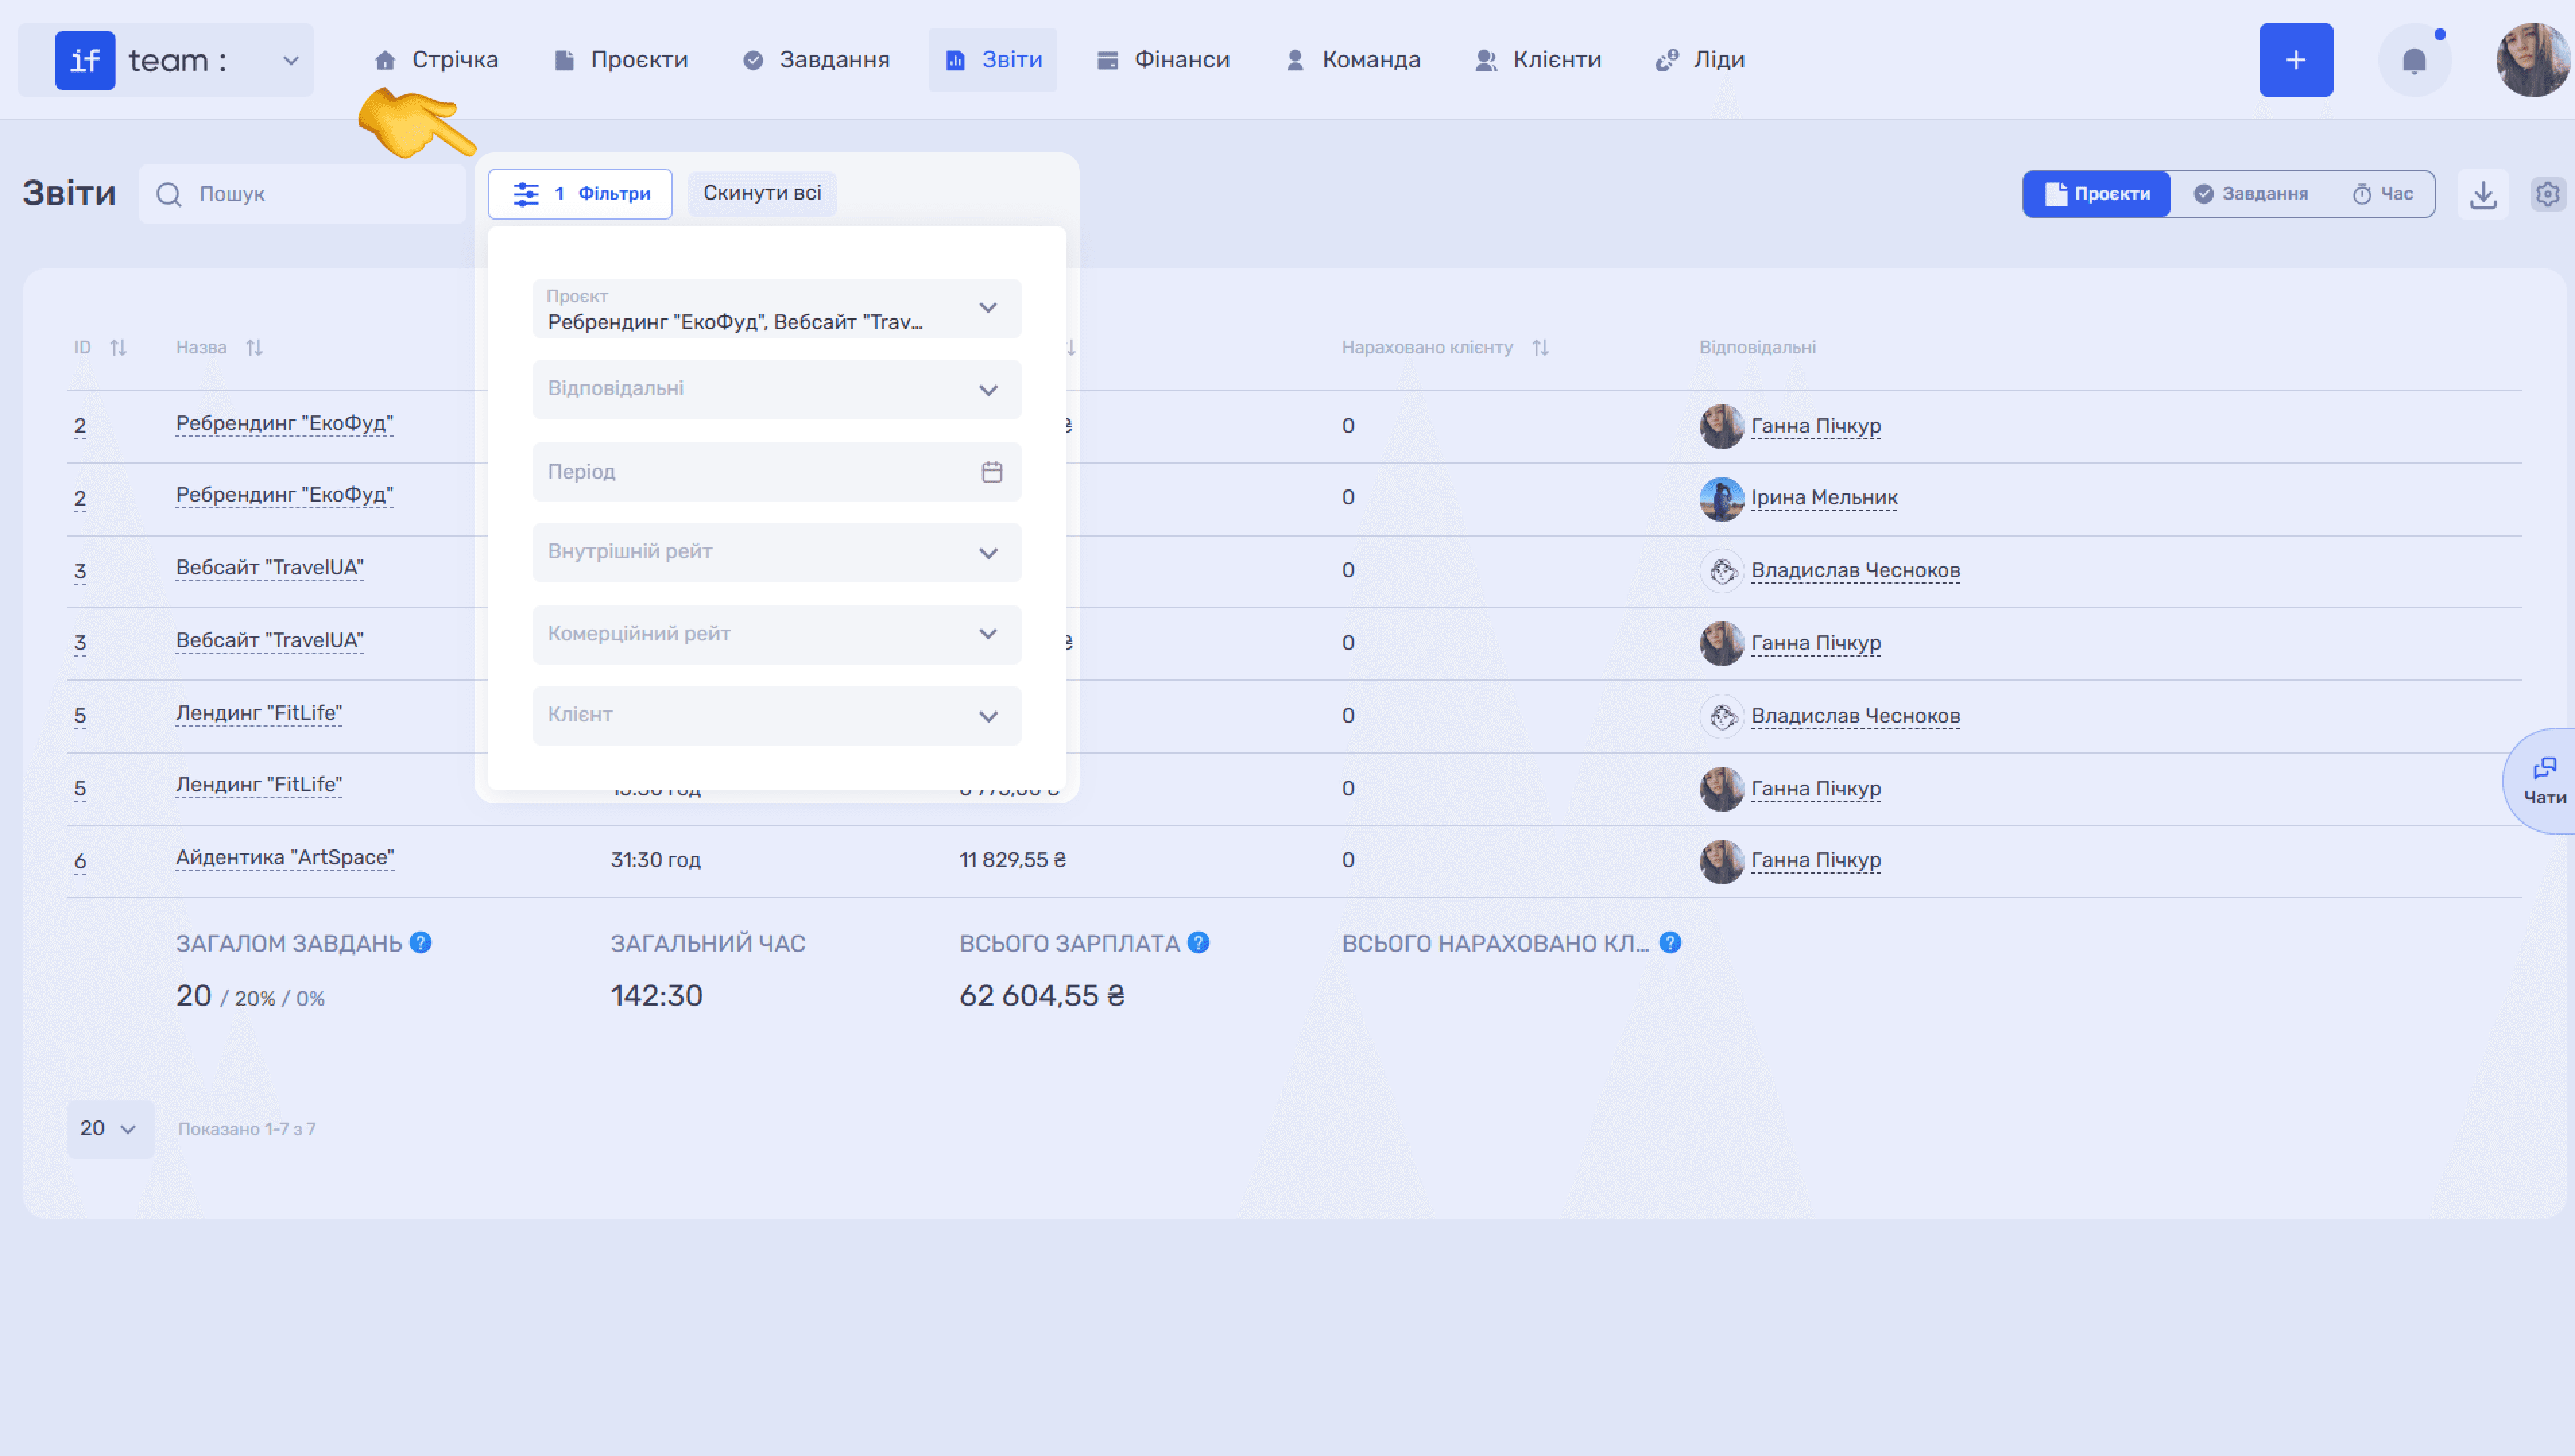
Column Settings. Click the gear icon (⚙) to choose which columns appear in the table: ID, Name, Time, Salary, Billed to Client, and Responsible Employees. Turn off fields you do not need to simplify the view, then click Save.
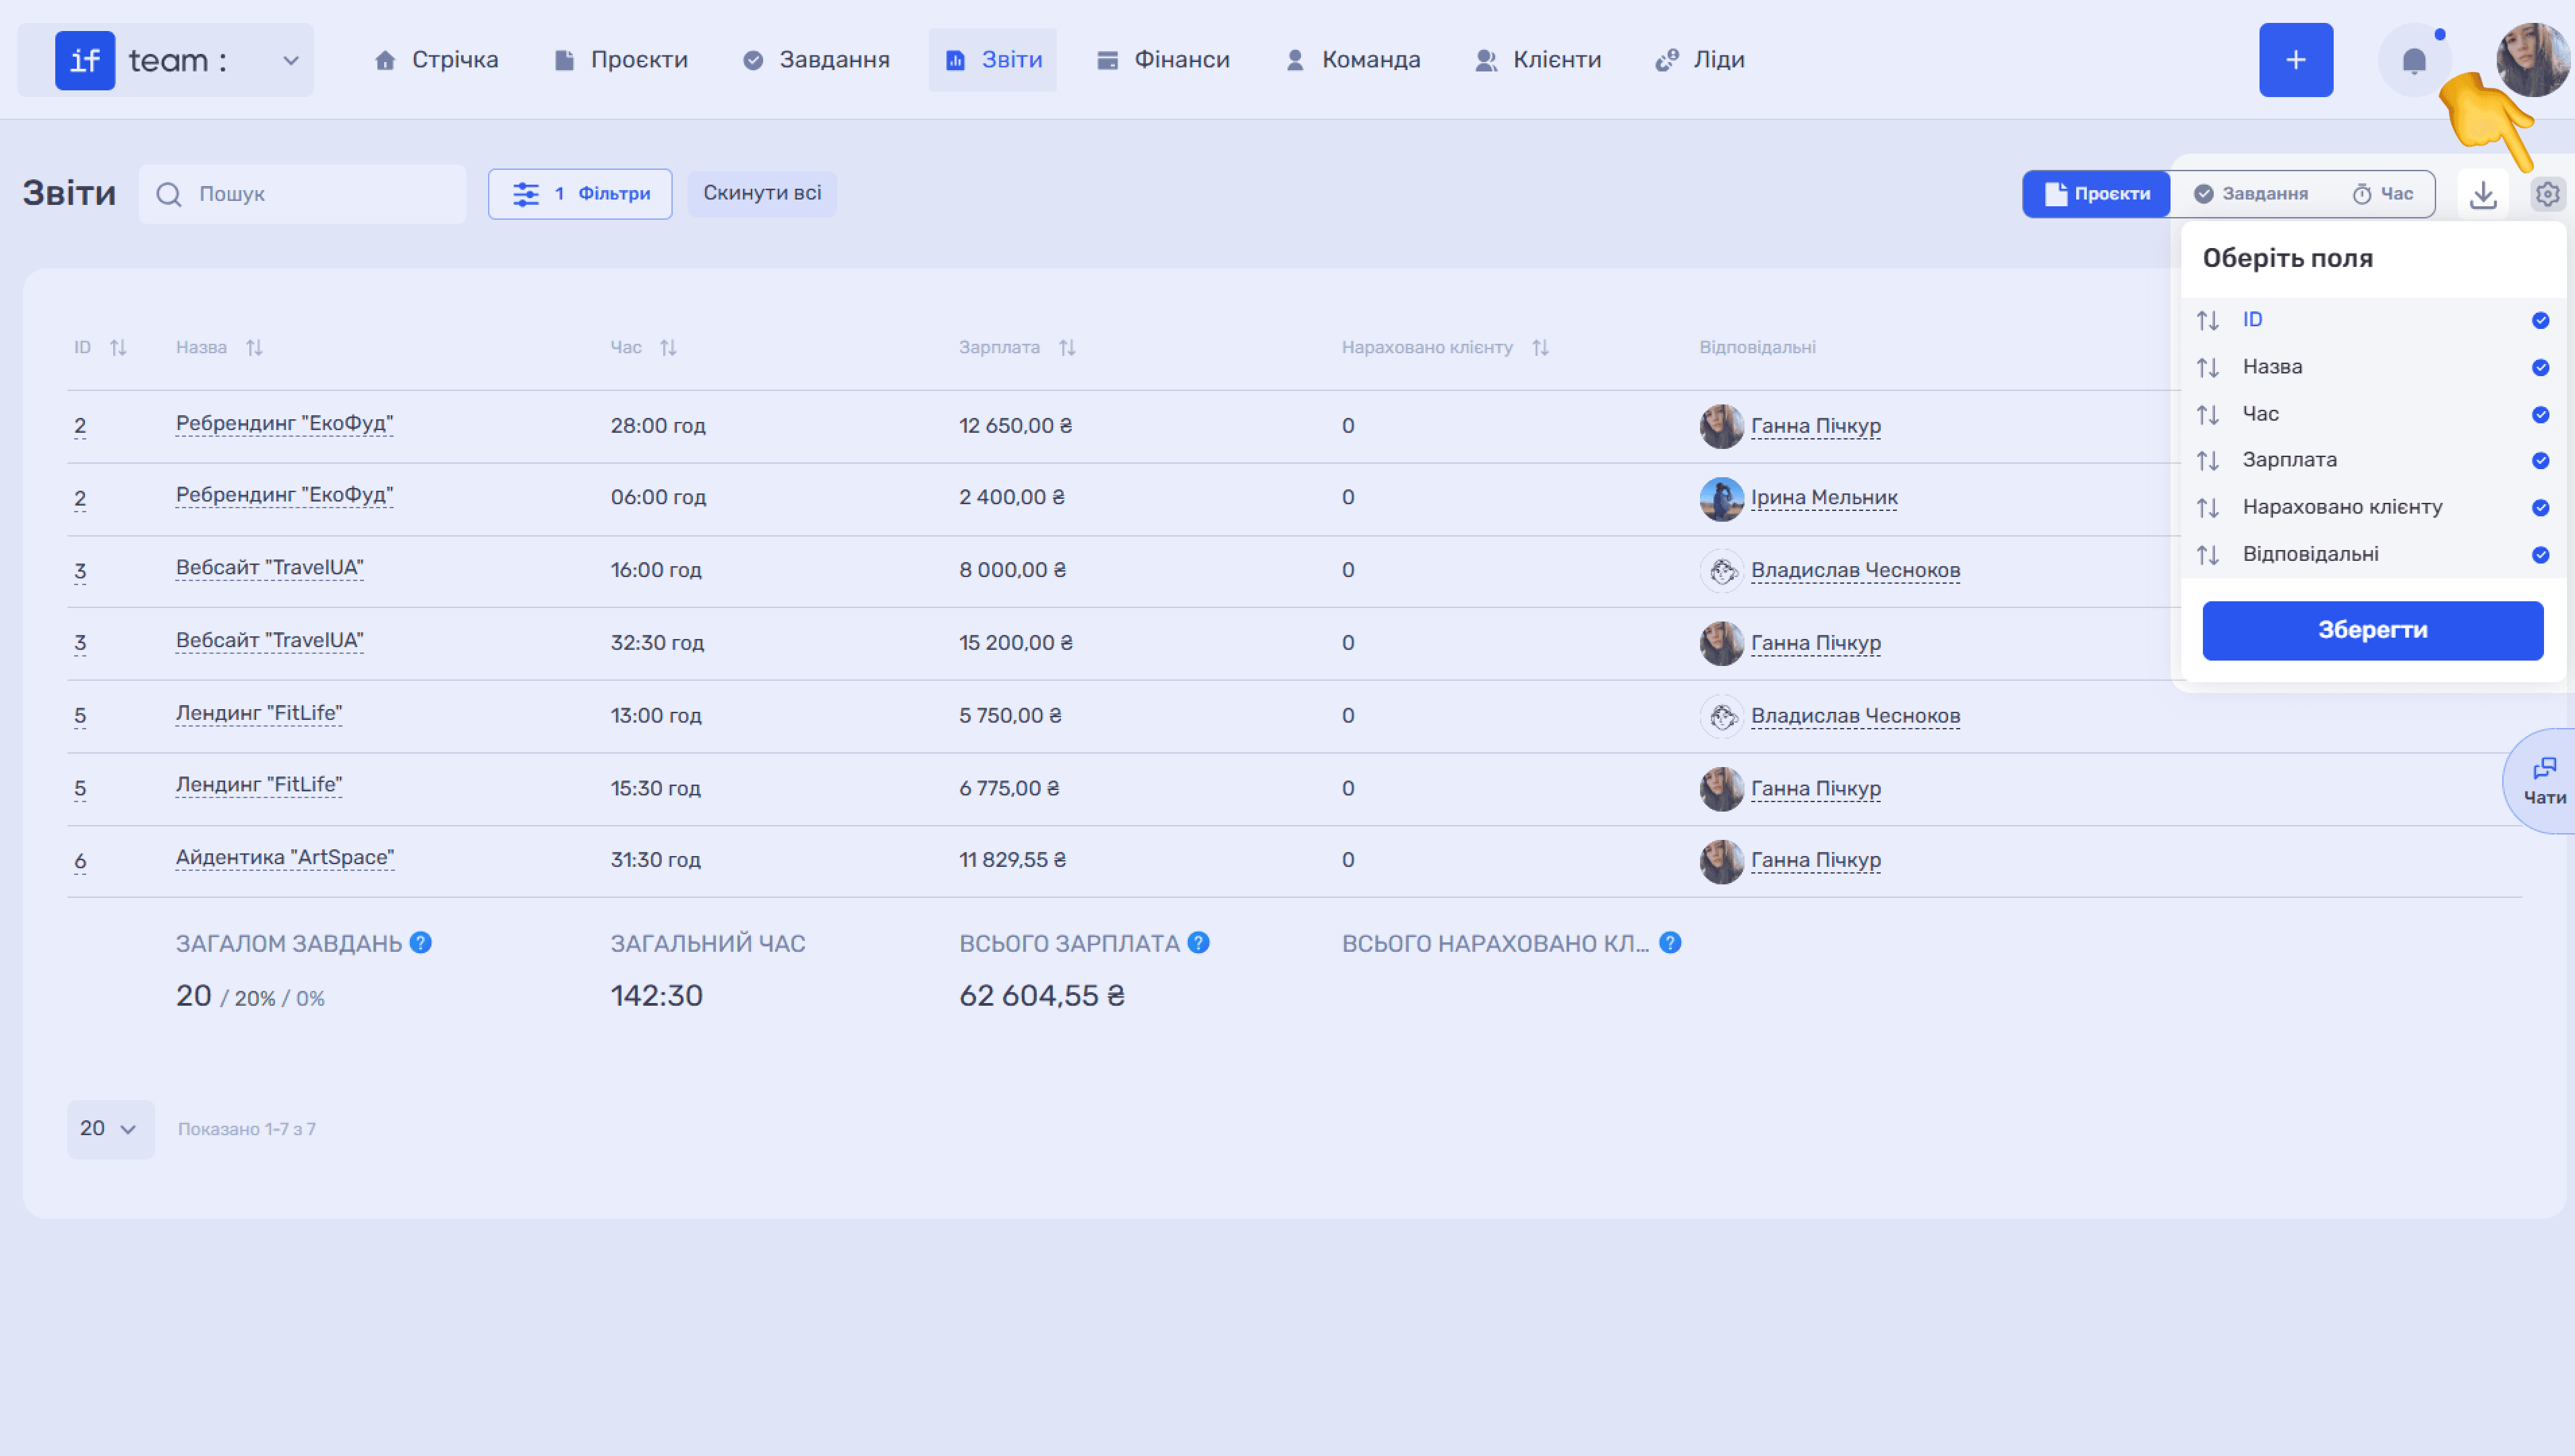
Report by Task
The Tasks tab shows detailed information for each task: name, project and iteration, status, actual and planned time, start date and deadline, rate, payment for work time, related income and expenses, amount billed to the client, as well as the employee, department, client, and counterparty.
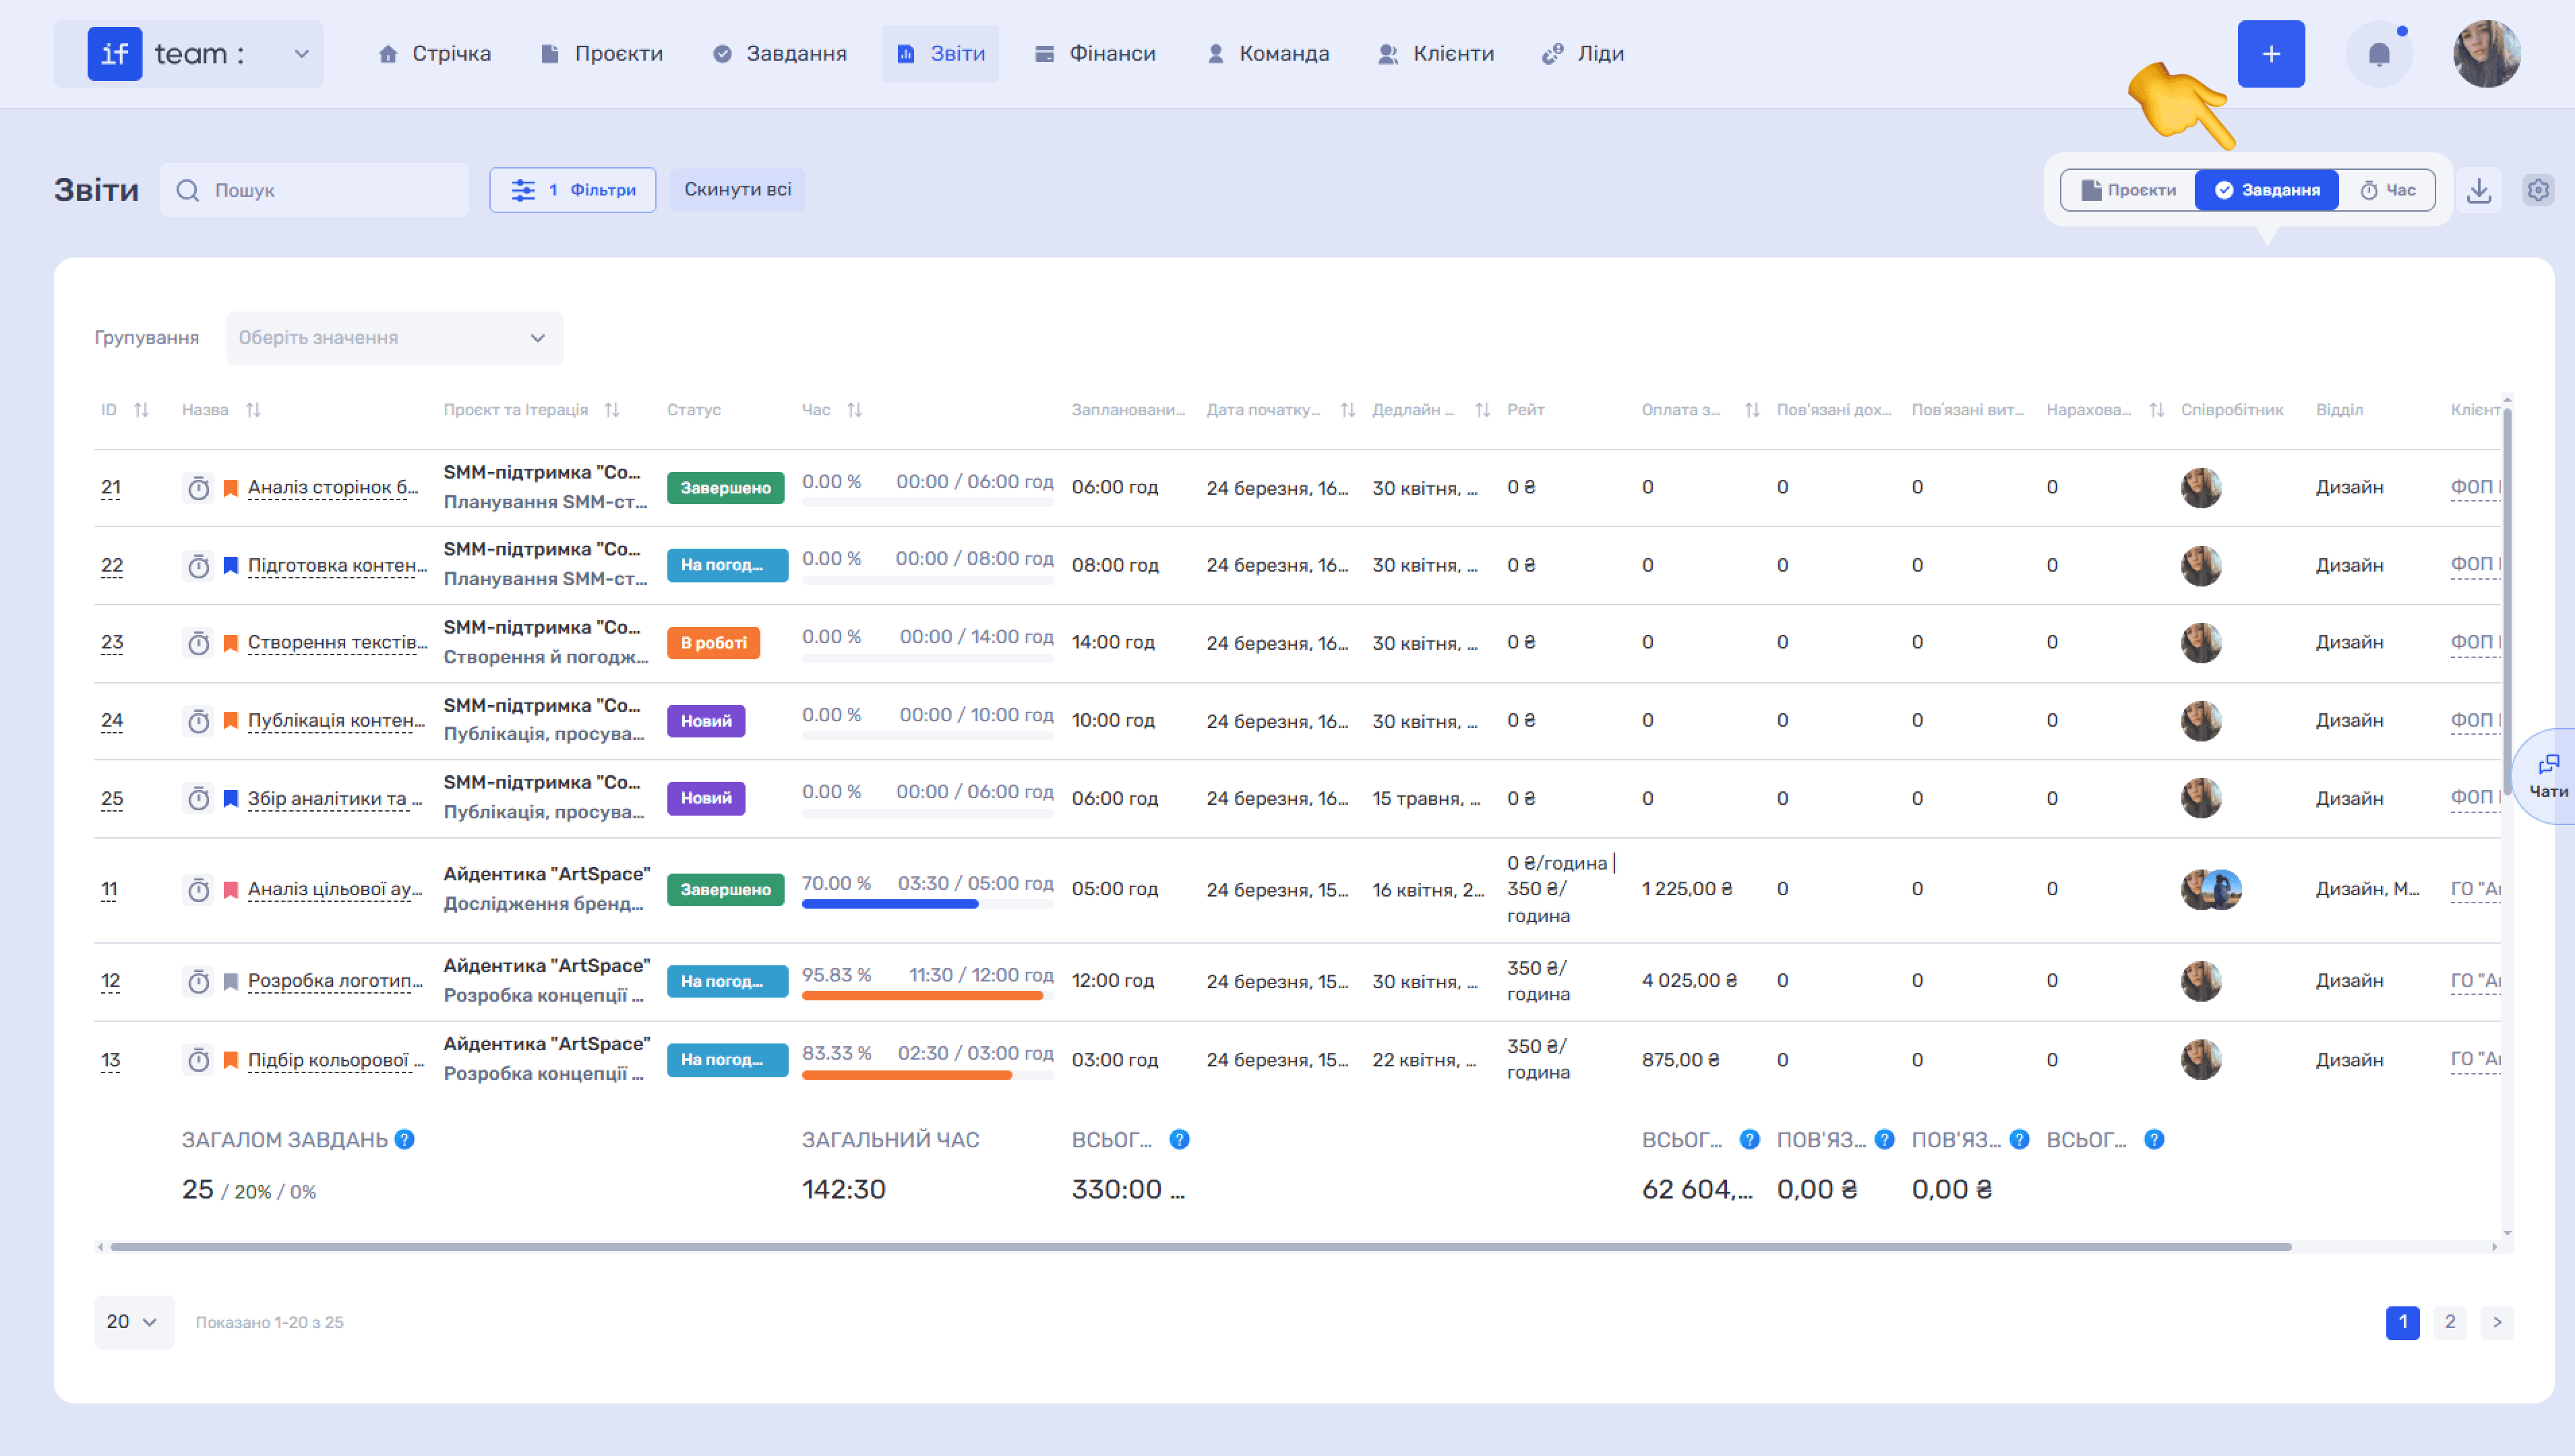
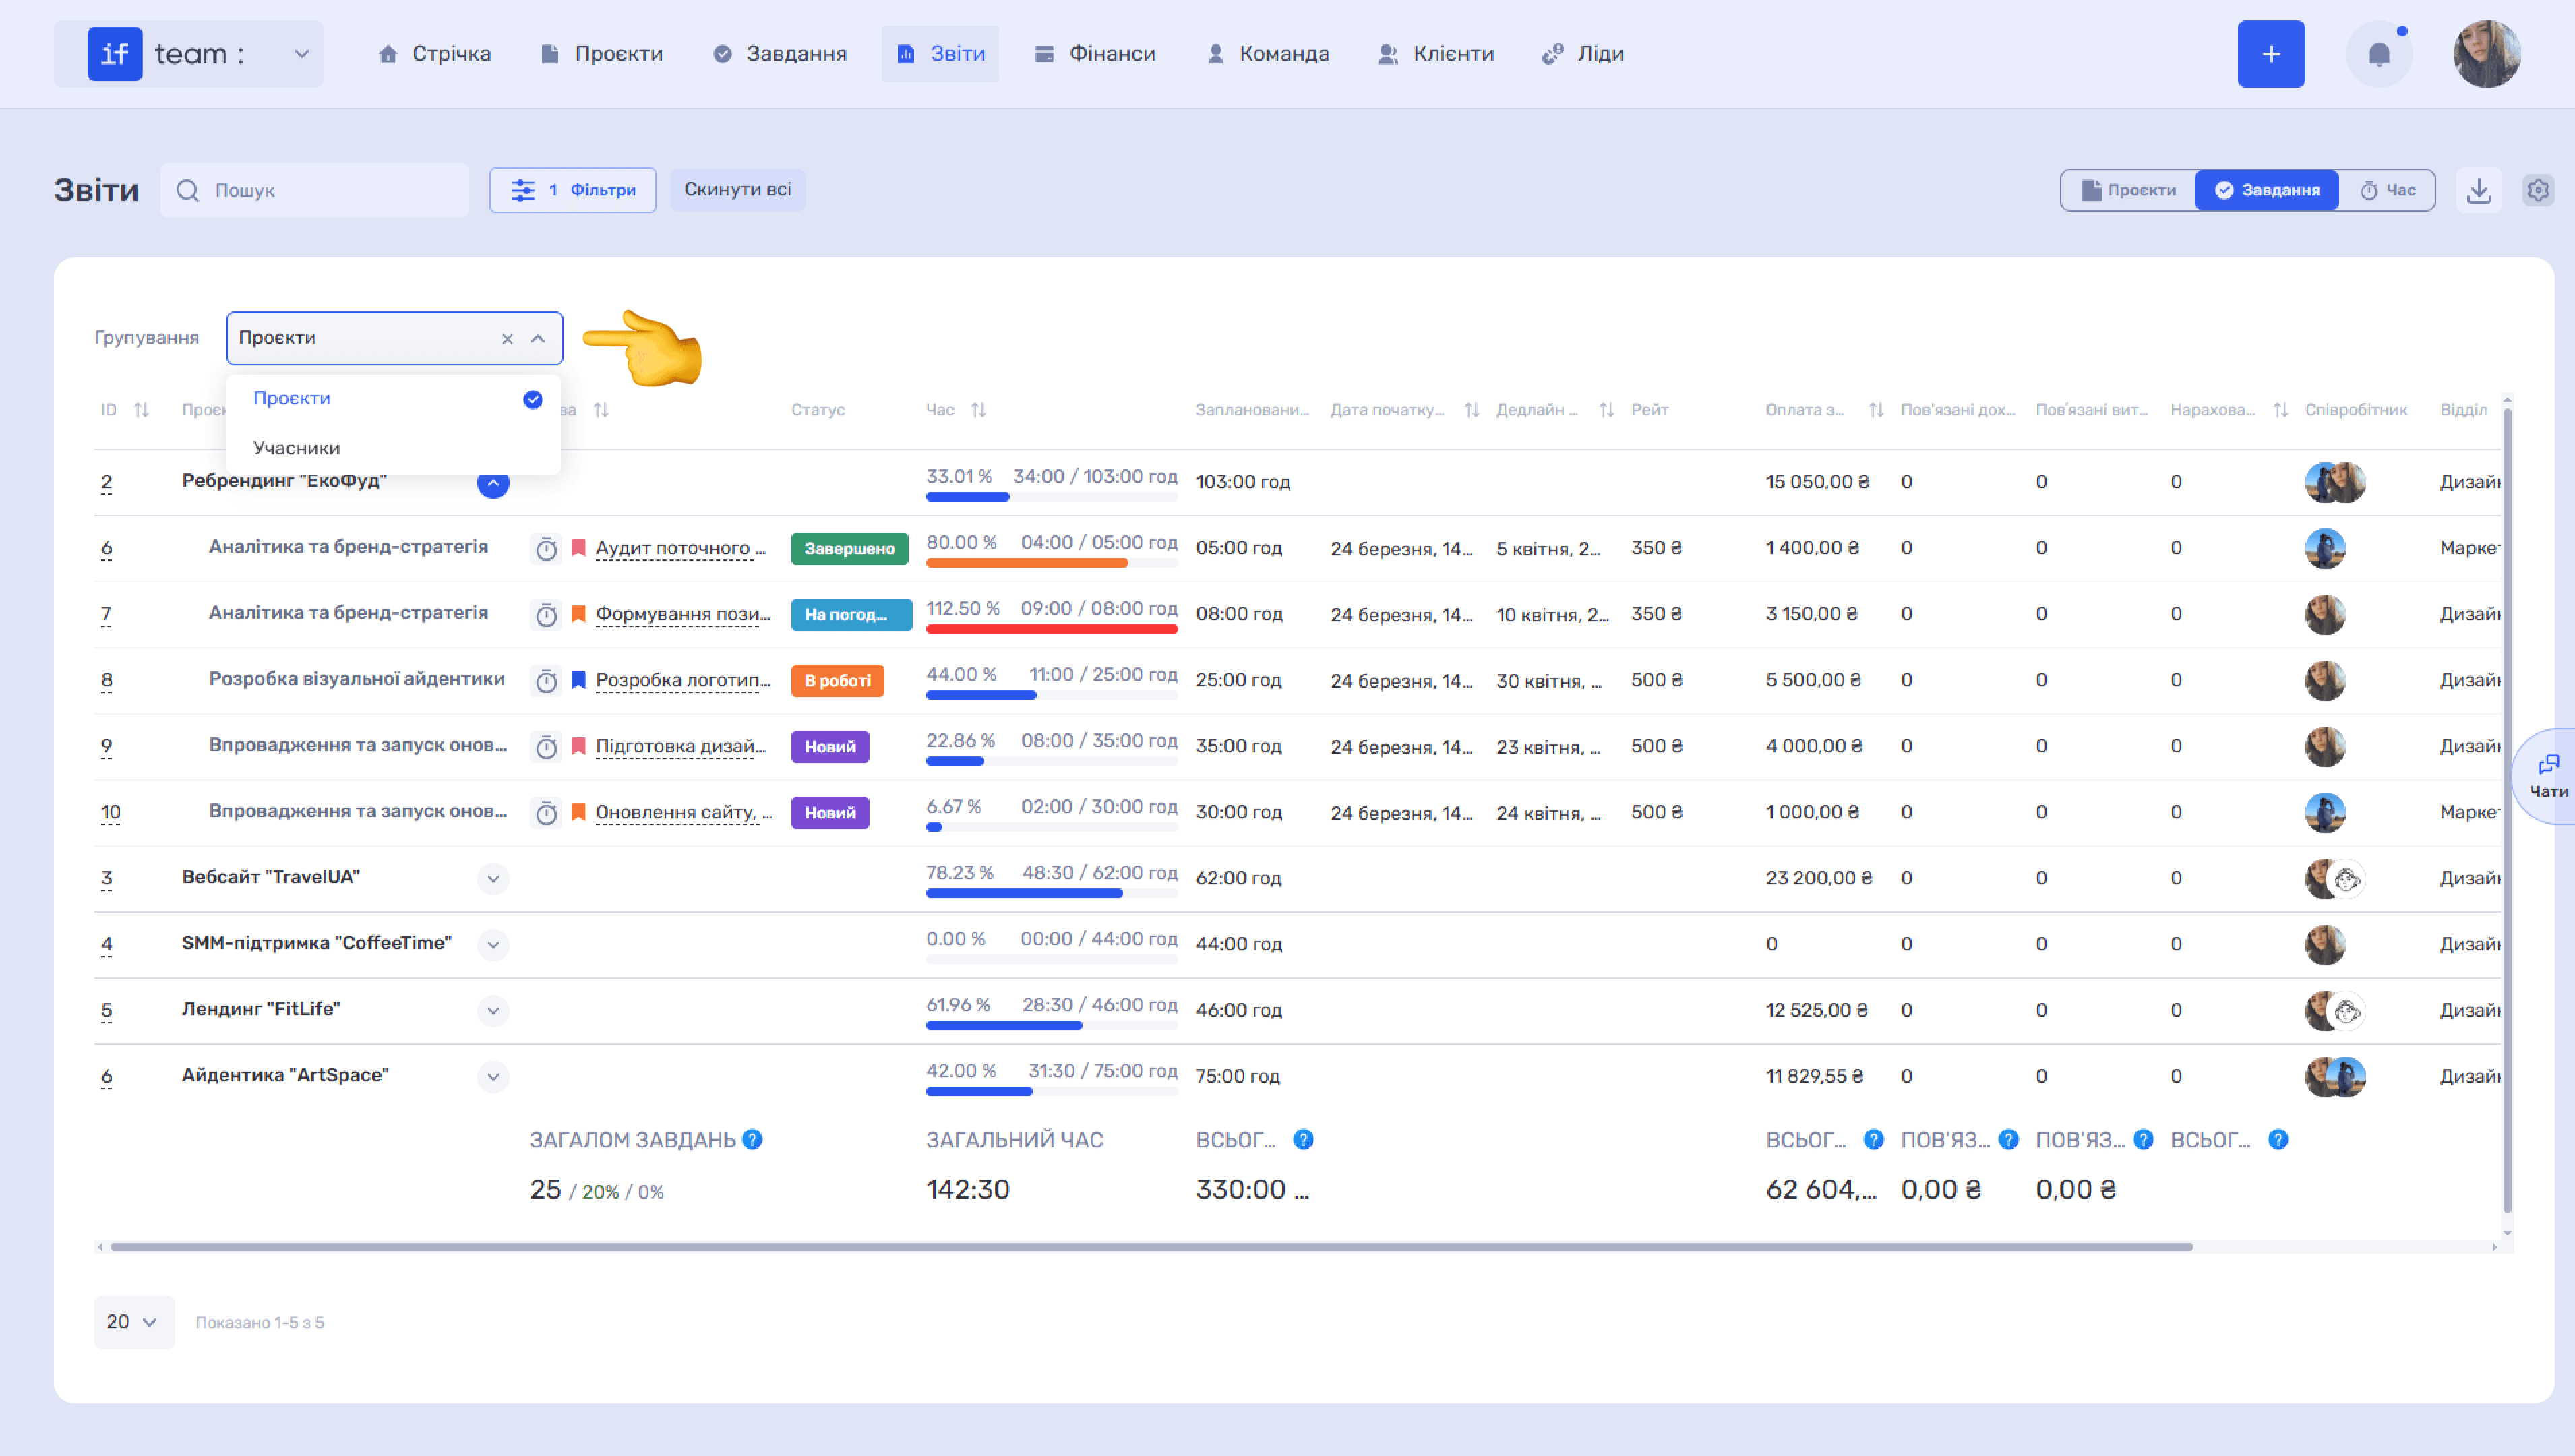
Grouping. The Grouping field above the table lets you group tasks by project or participant. This is useful when you need to quickly see the scope of work for a project or the workload of a specific employee.
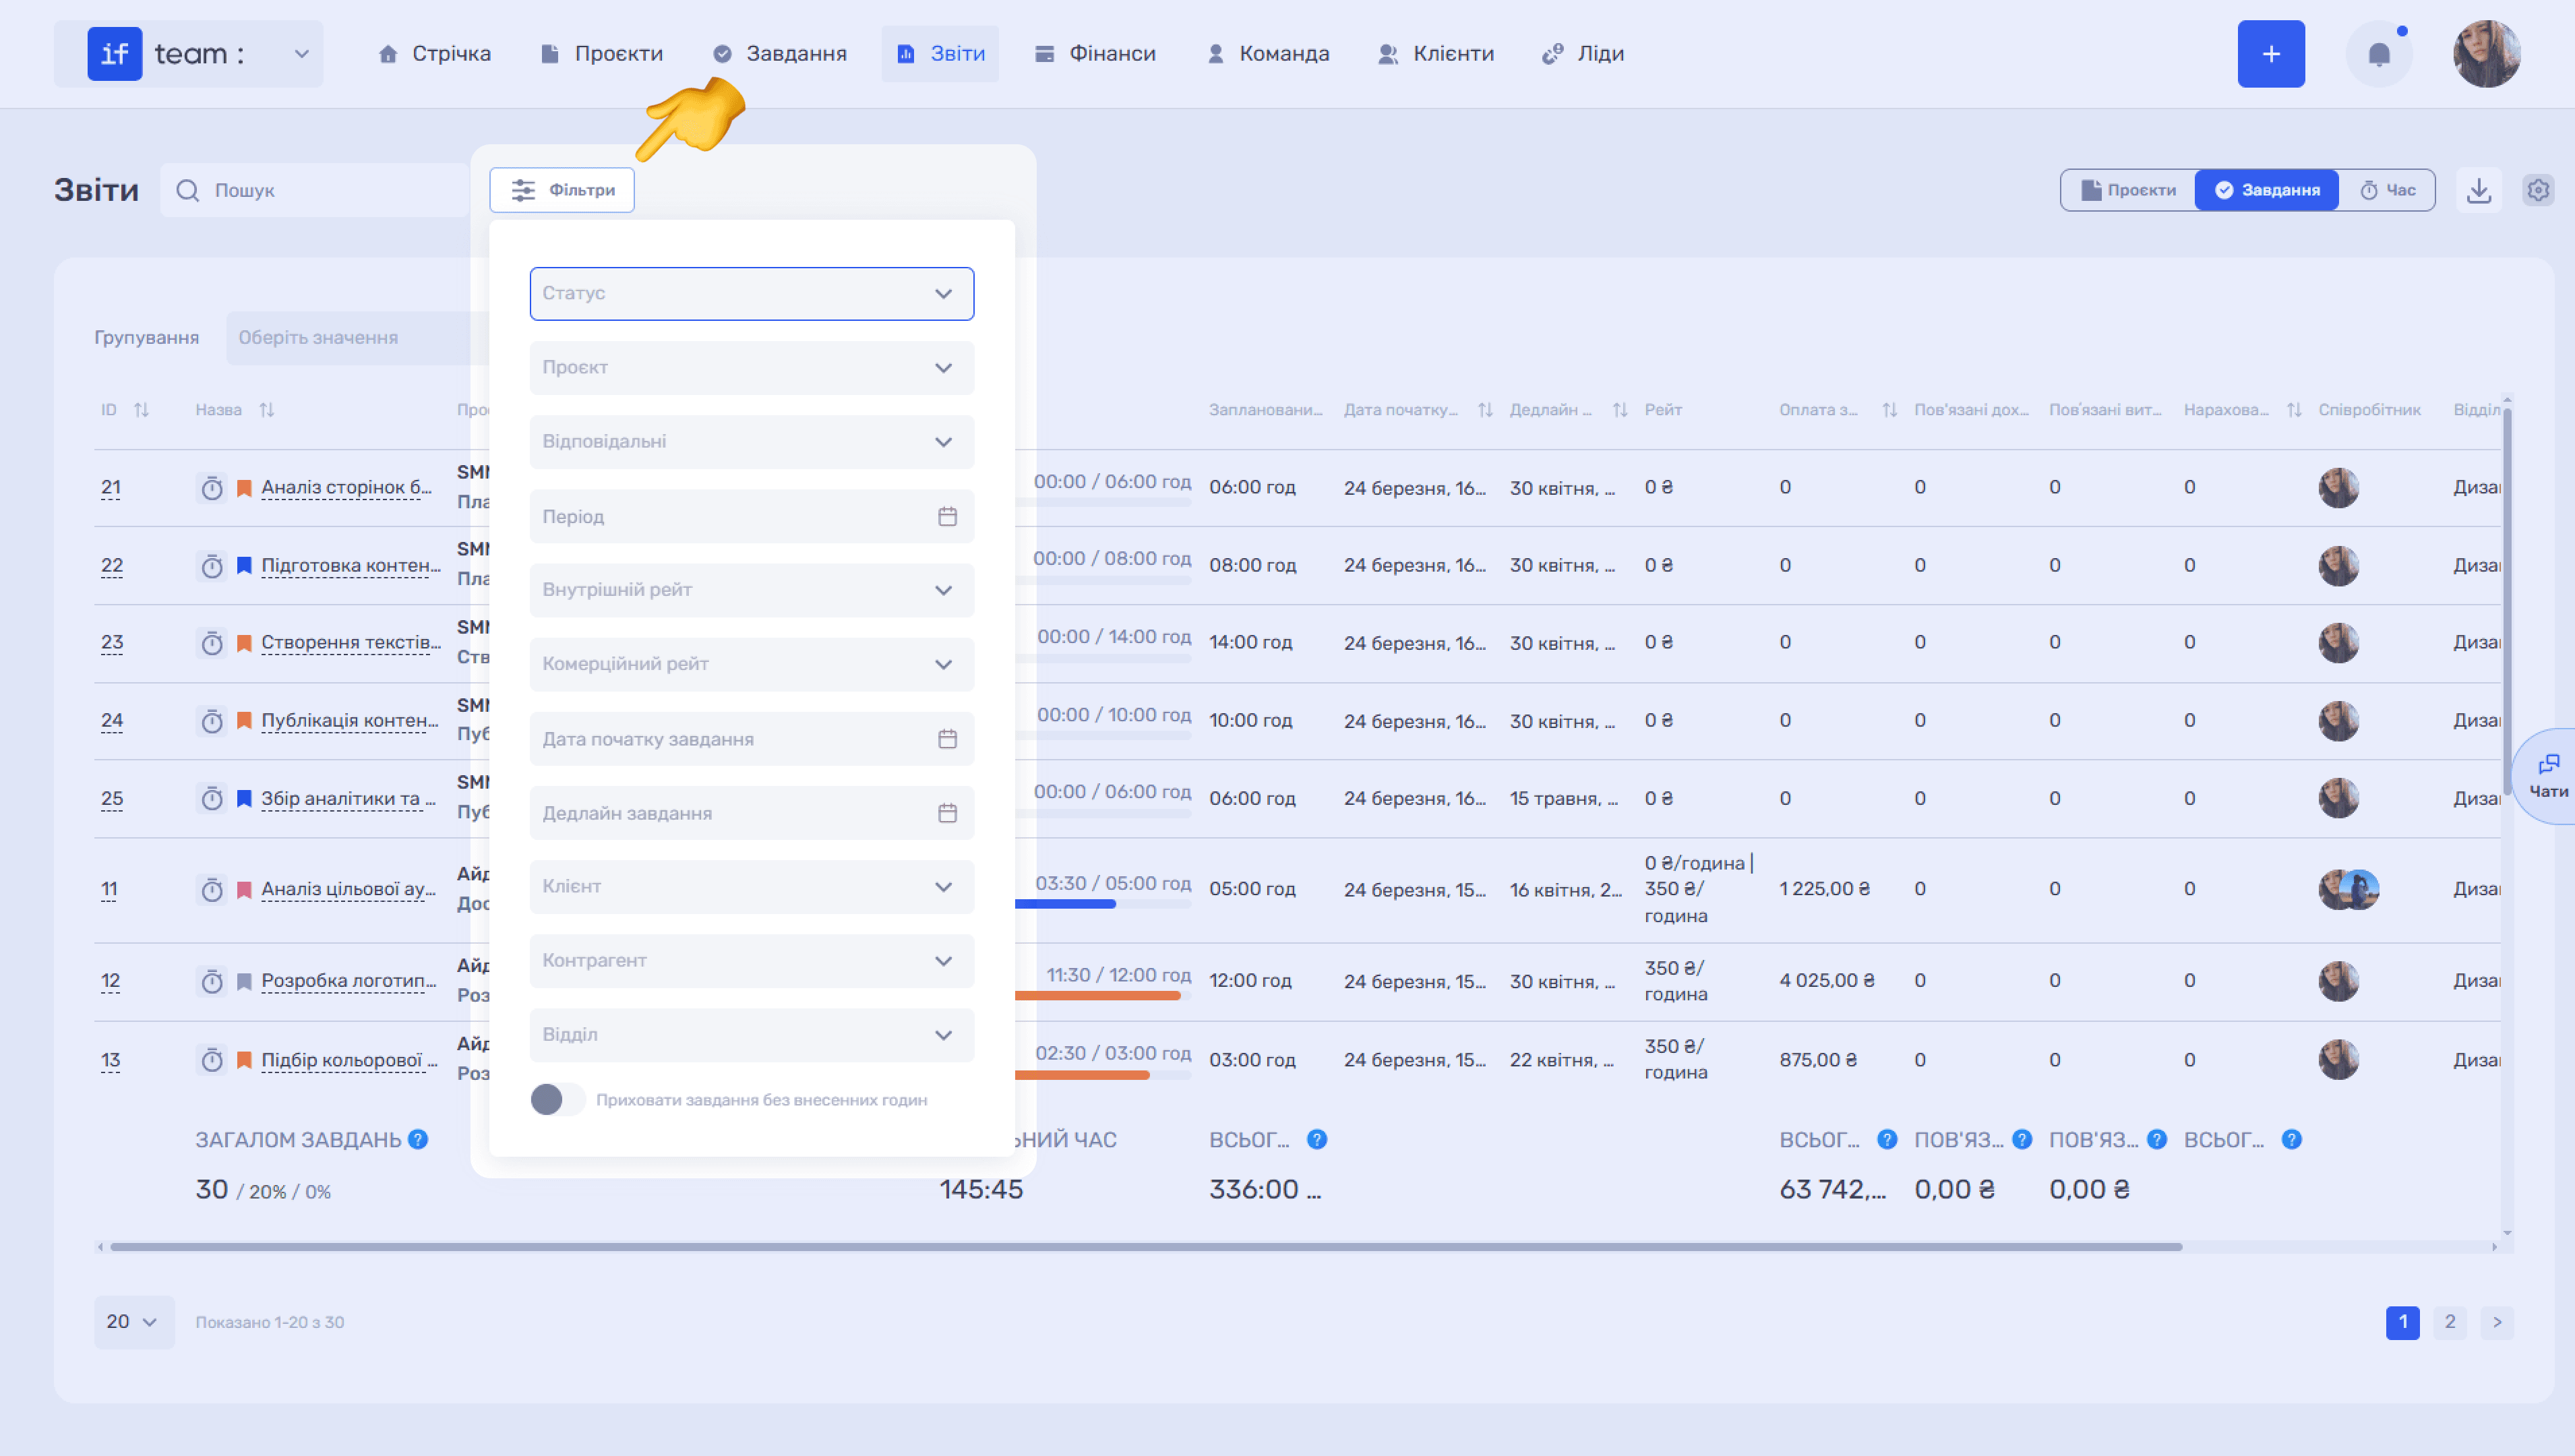
Filters. The set of filters on the Tasks tab is significantly broader than on the Projects tab. You can filter by status, project, responsible employees, period, rates, task start date and deadline, as well as client, counterparty, and department. The Hide Tasks Without Logged Hours switch helps you focus only on tasks that have actually been worked on.
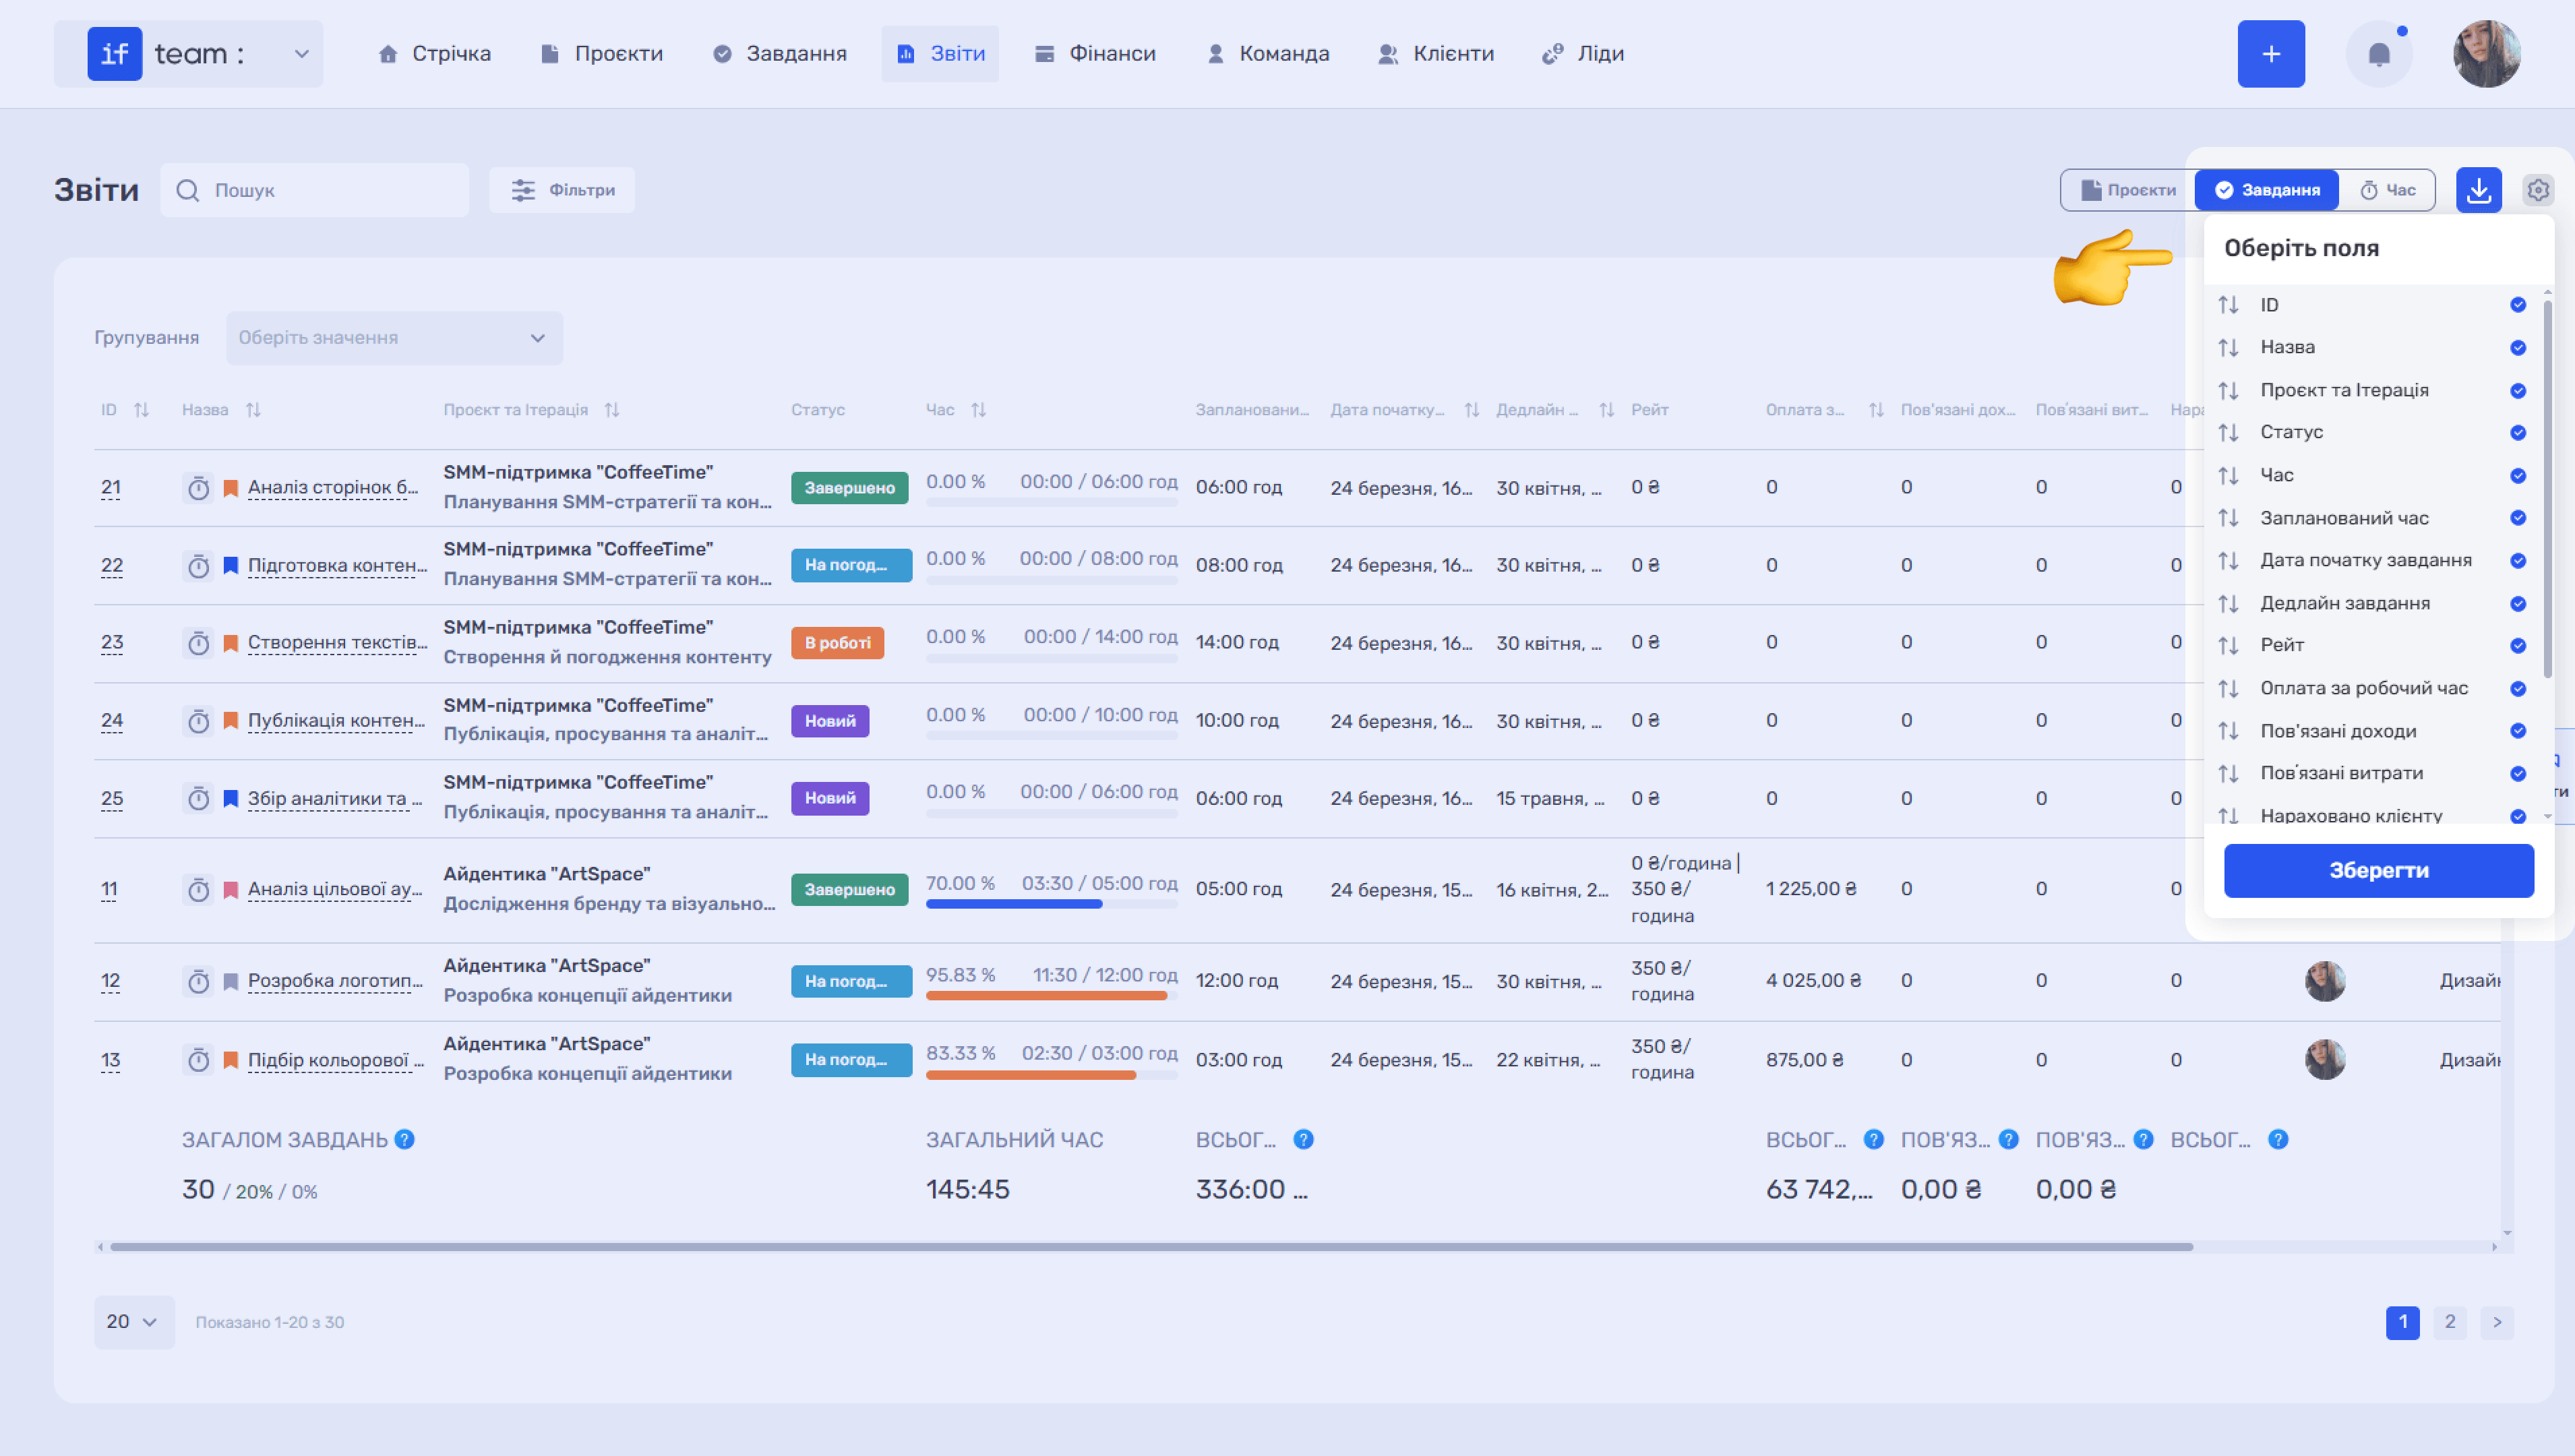
Column Settings and Excel Download. As in the report by project, you can choose which table columns to display. Click the gear icon (⚙) and select the required fields: ID, Name, Project and Iteration, Status, Time, Planned Time, Task Start Date and Deadline, Rate, Payment for Work Time, Related Income and Expenses, Billed to Client, Employee, Department, Client, and Counterparty.
To export the report to Excel, click the download icon (⬇) next to the gear icon.
Report by Time
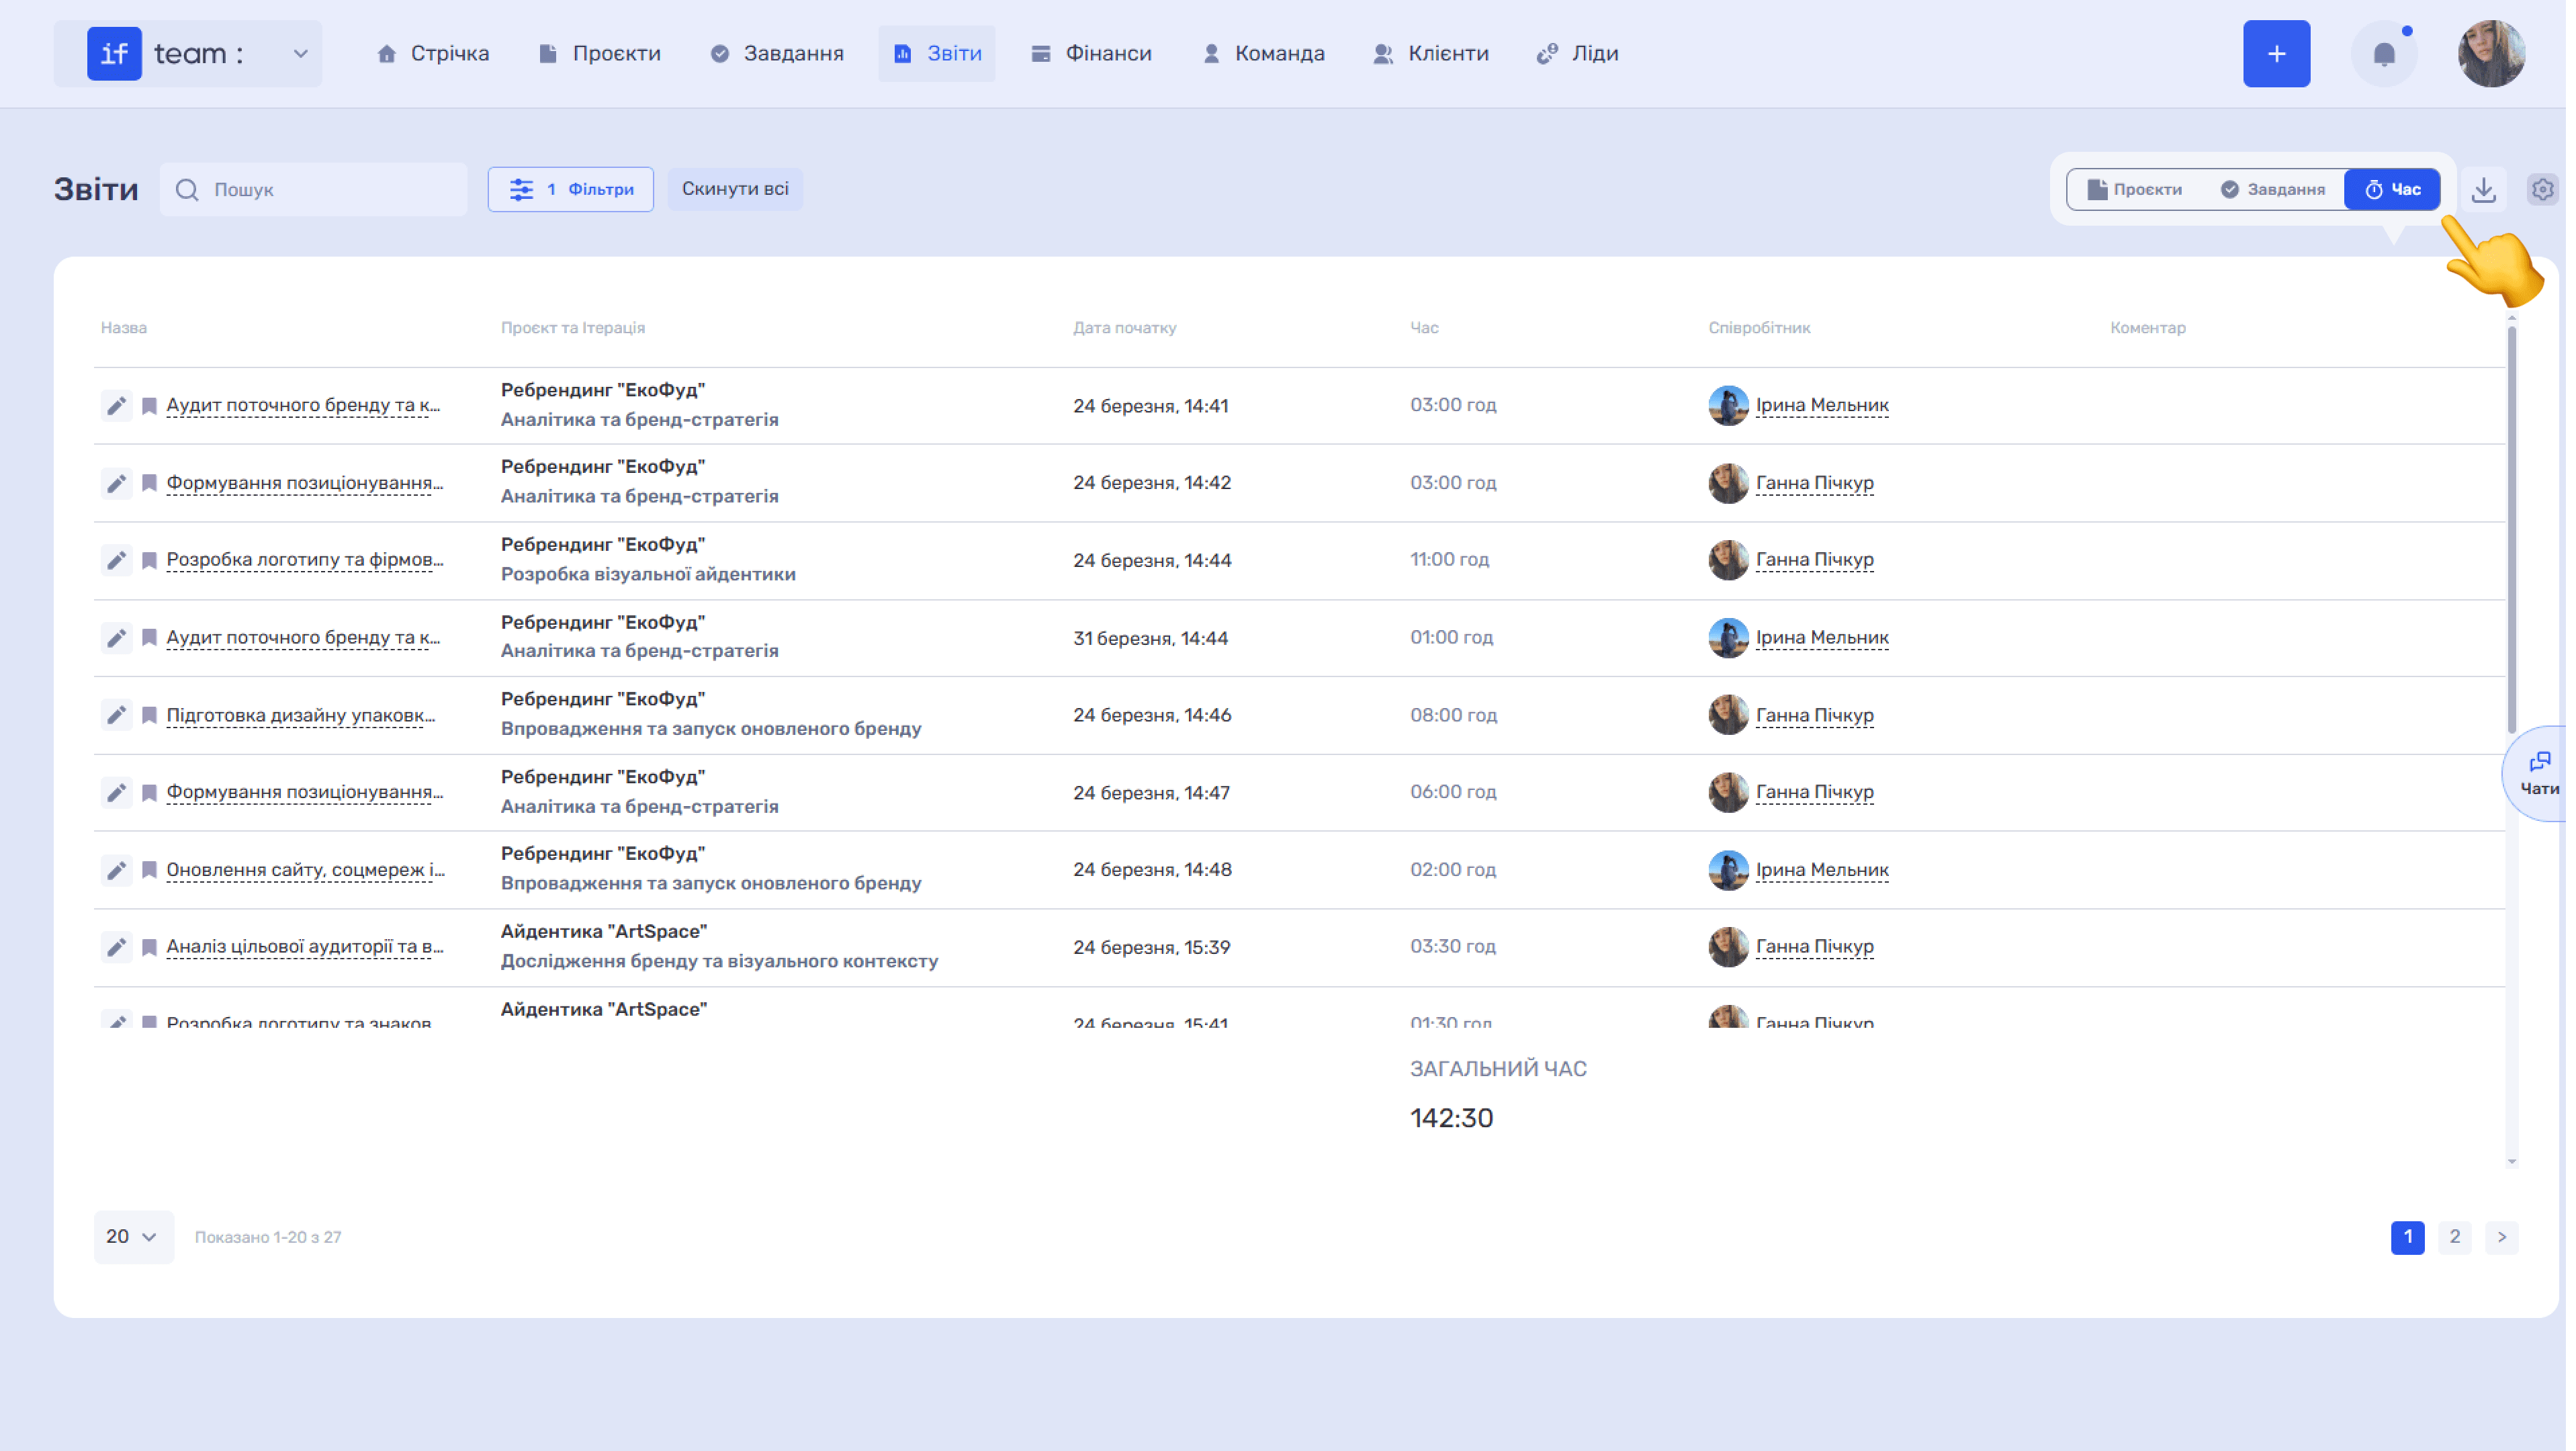
The Time tab is a chronological log of all work-time entries. Each row contains the task name, project and iteration, start date, duration, employee, and comment.
Entries are marked with icons: the timer (⏱) indicates automatic time tracking, while the pencil (✏) indicates time entered manually. The Comment column contains the employee’s explanation for the entry.
The total time across all entries appears at the bottom of the table.
Data from all three tabs can be downloaded in Excel format for further analysis or reporting.
Still have questions?
Maybe we haven't added this information yet. But you can always reach out:
Request a demo
Submit a request and we'll show you how the service works and its capabilities.
Book a demo