List View
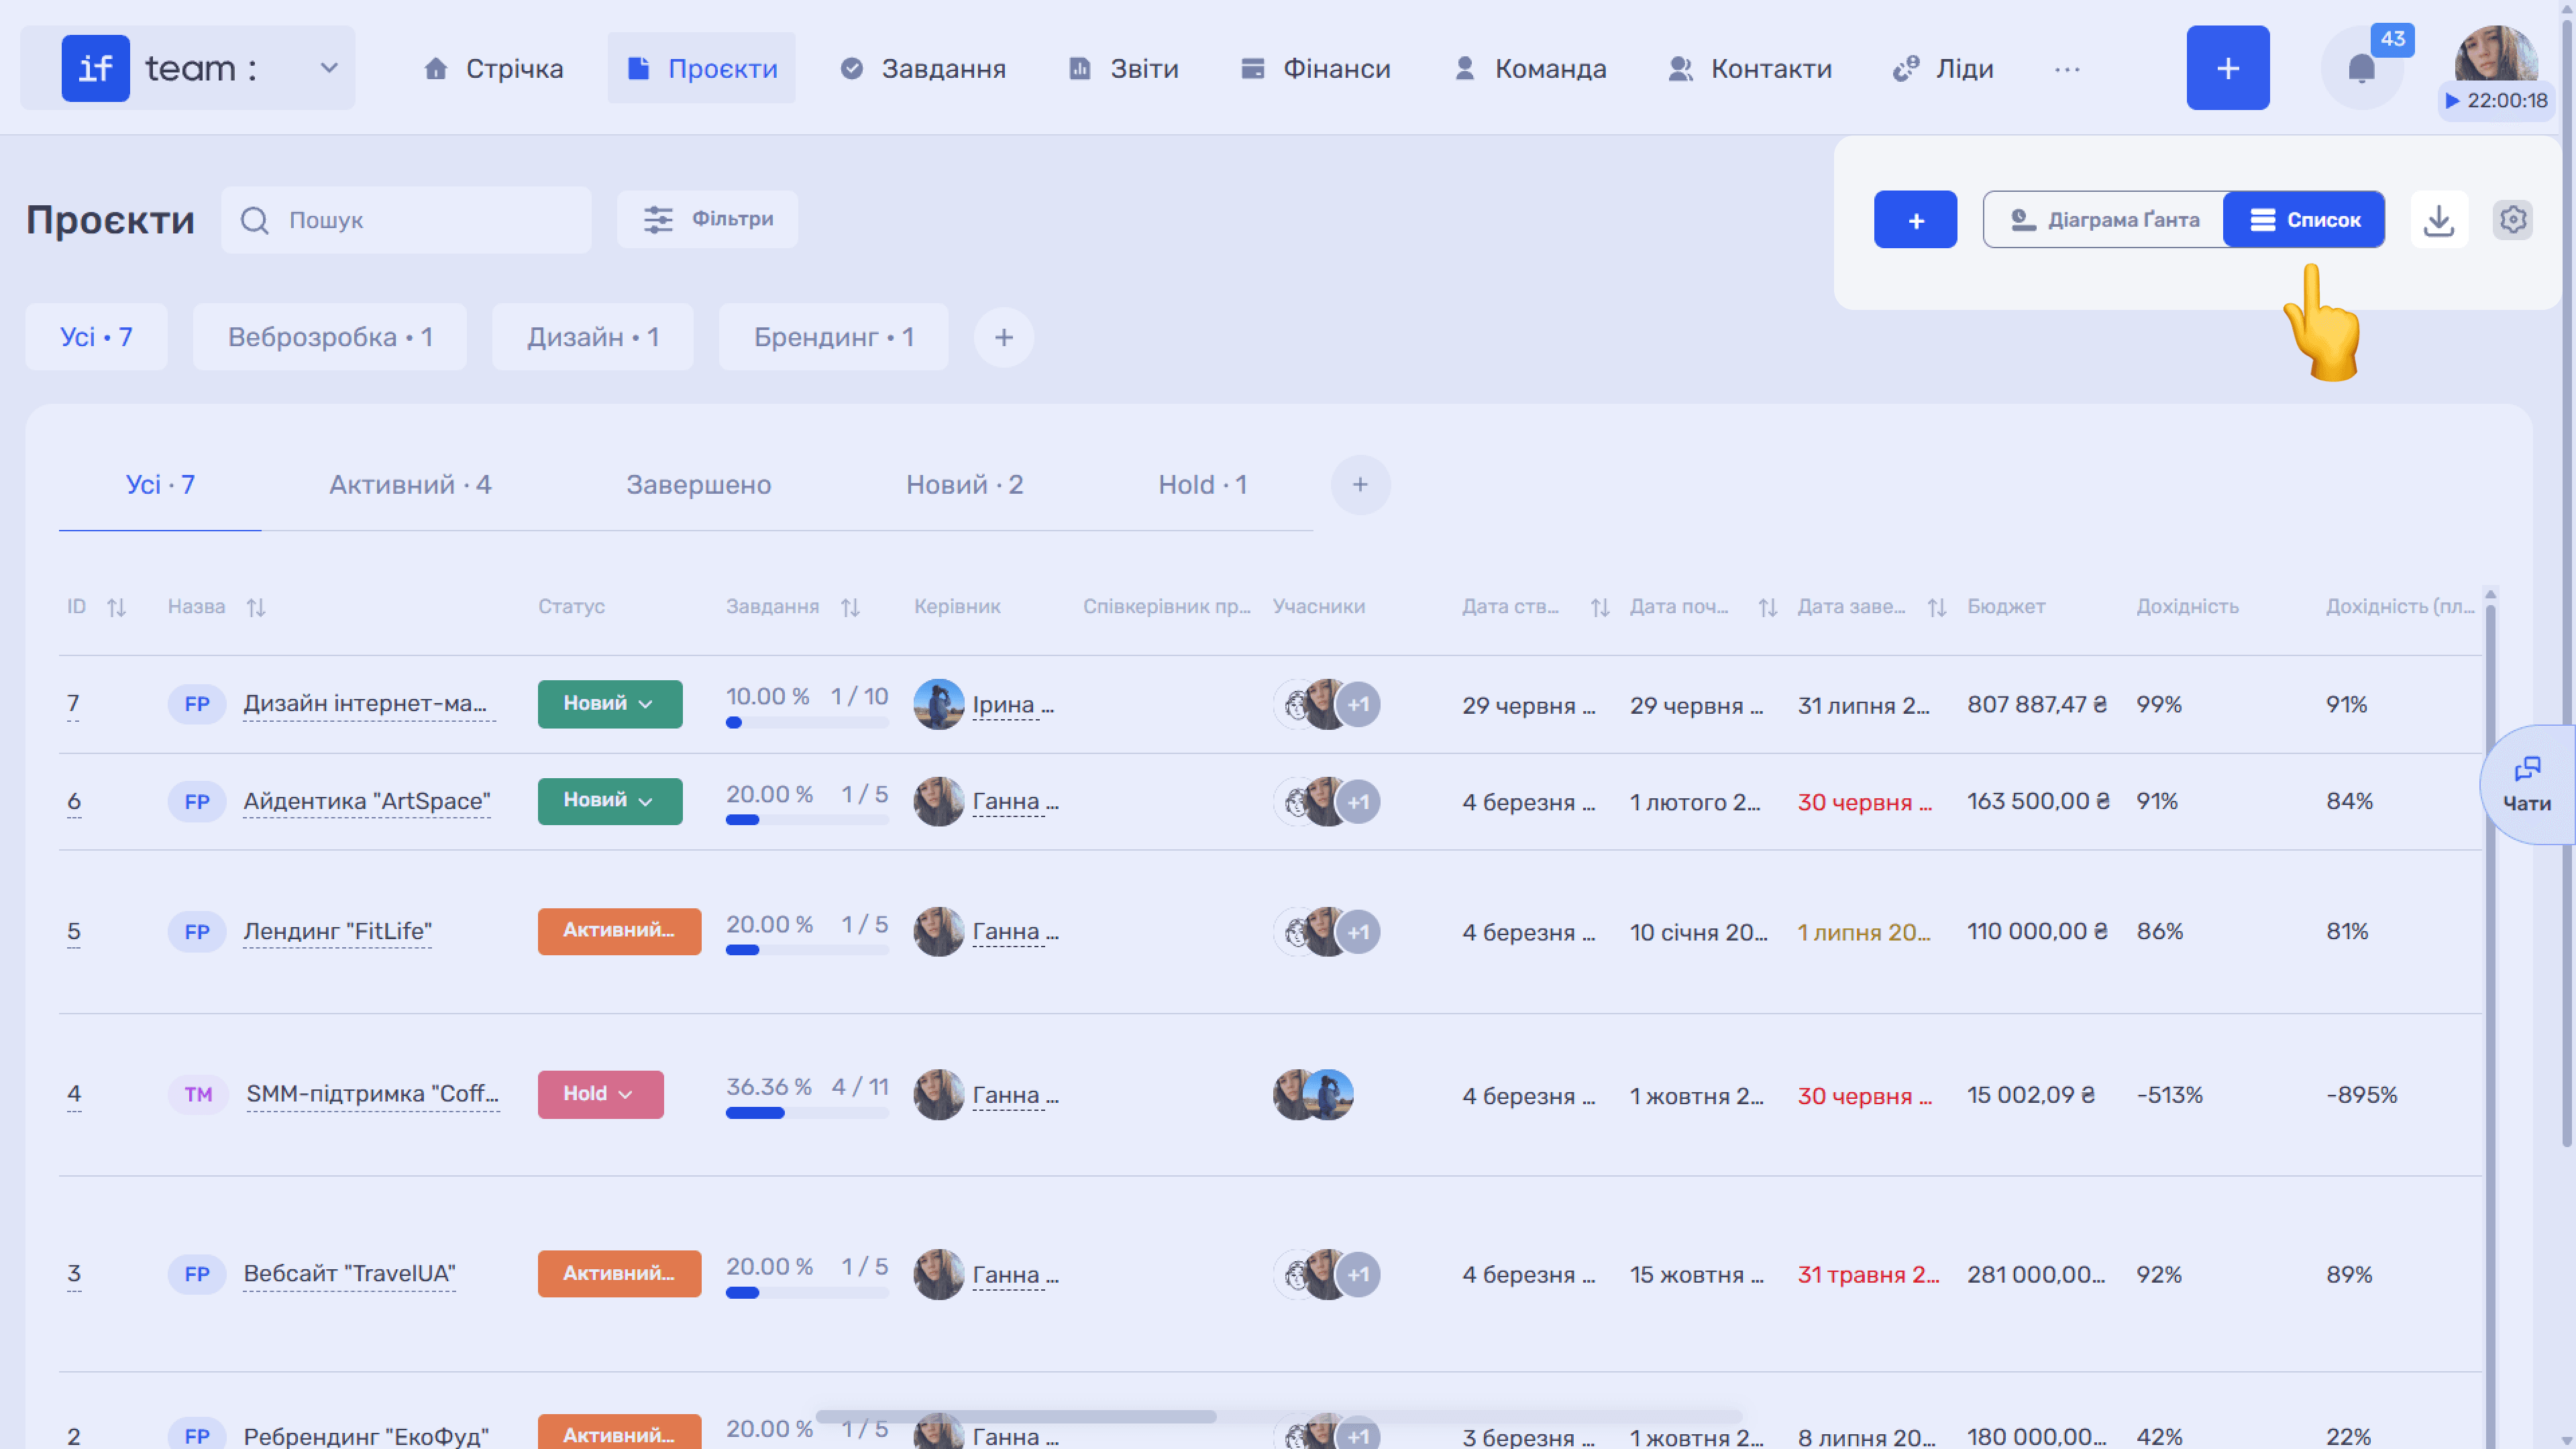
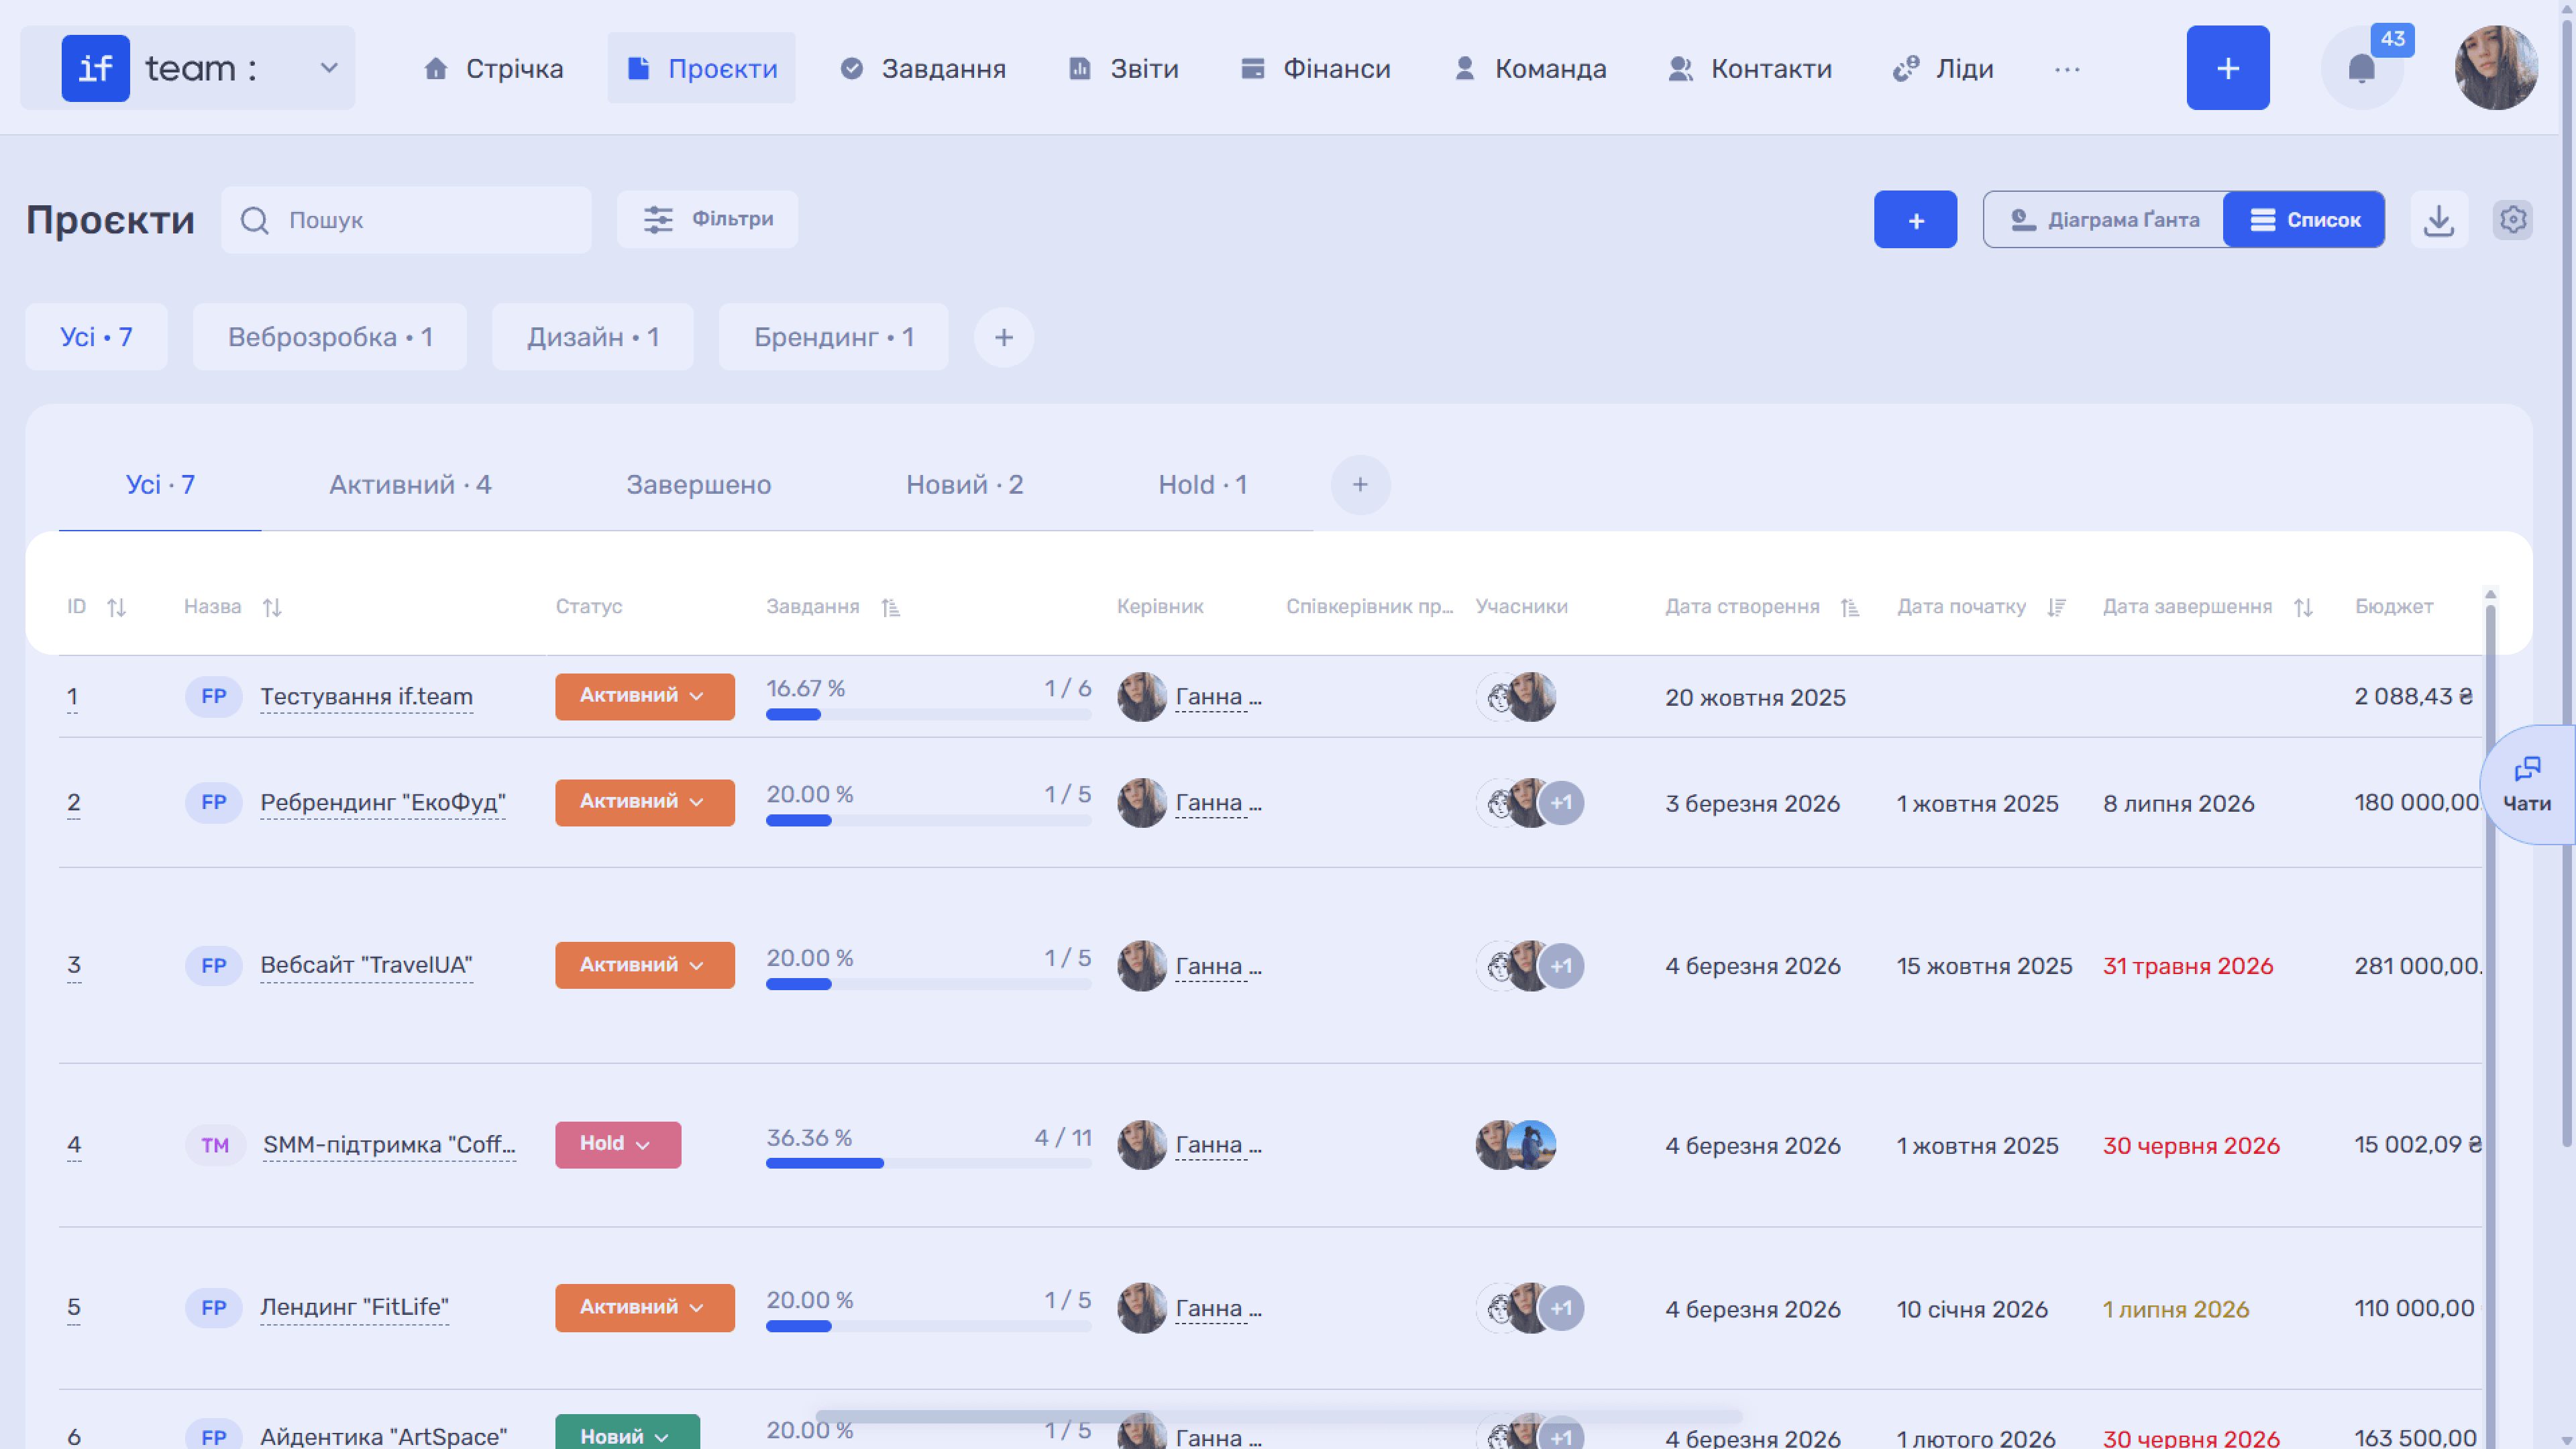
List view displays all company projects in a table. It is a convenient way to quickly assess the state of work, compare projects, and focus on key metrics without moving between sections. To enable this view, click List in the upper-right corner of the Projects page.
Business Lines
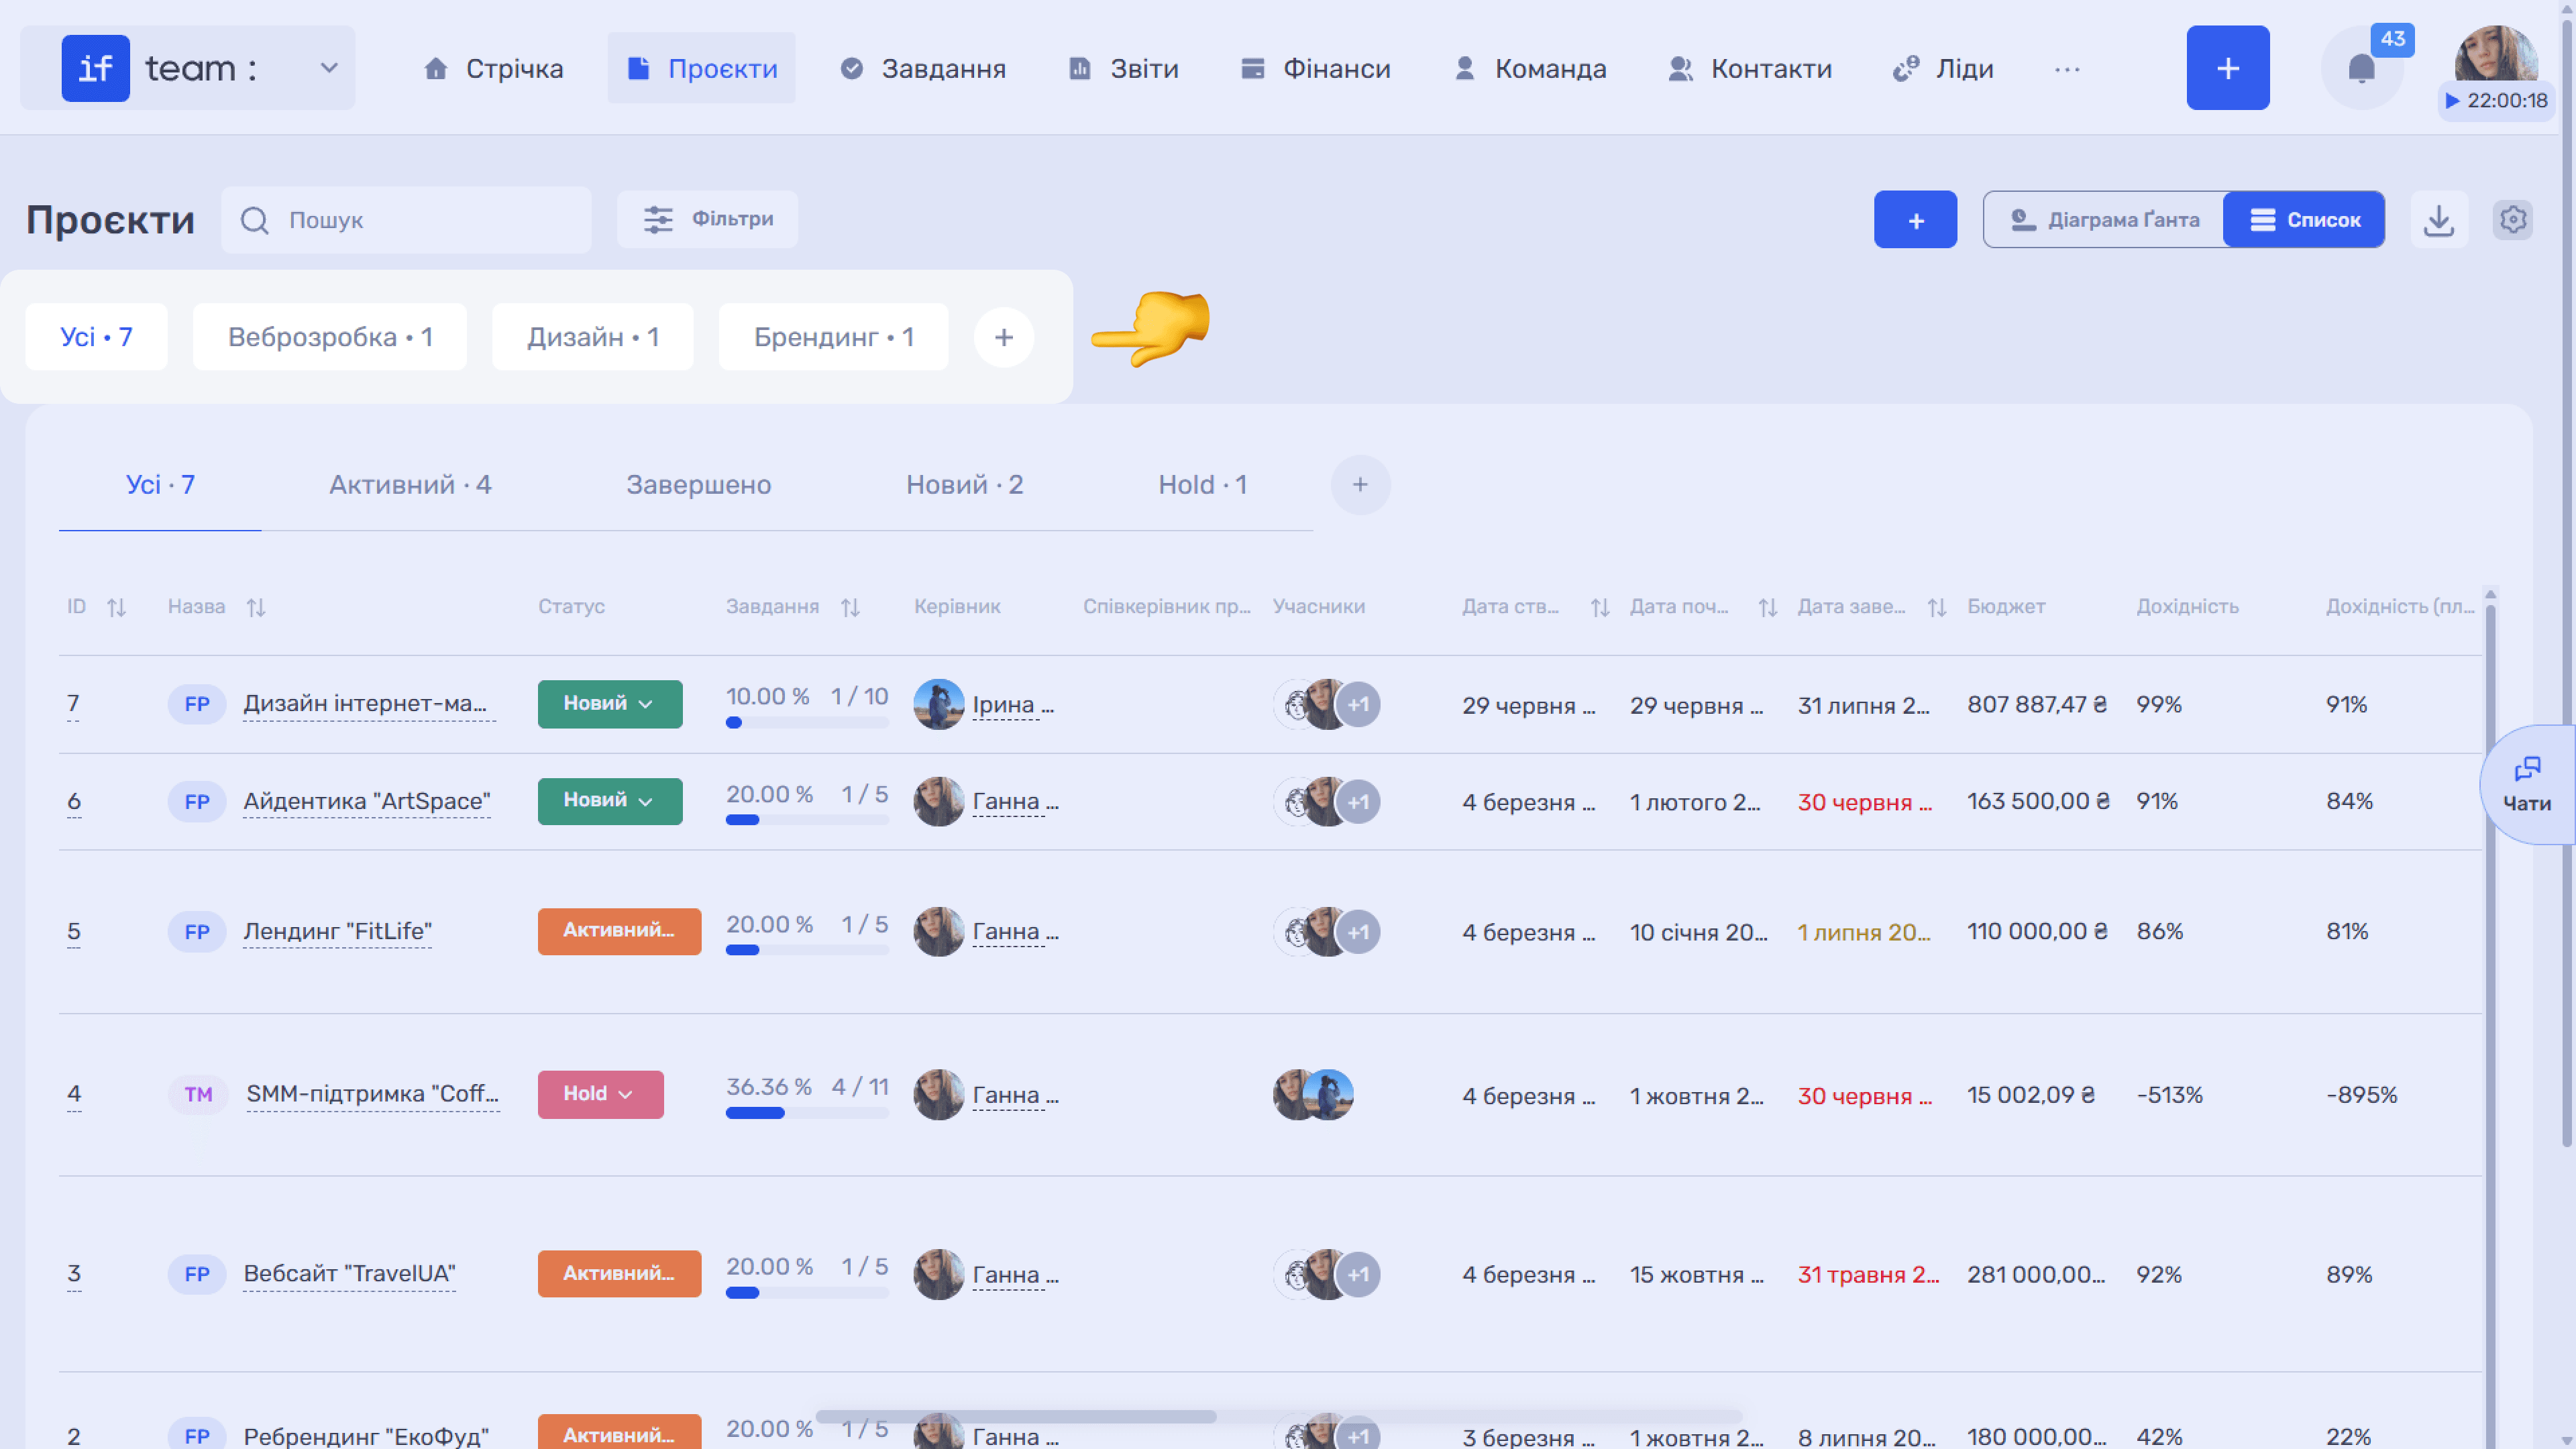
The business line tabs appear above the table—for example, All, Web Development, Design, and Branding. They group projects by the company’s business lines, and the number on each tab shows how many projects belong to that line. The + button (Add Business Line) creates a new one. For more information about this entity, see Business Lines.
Main Table Fields
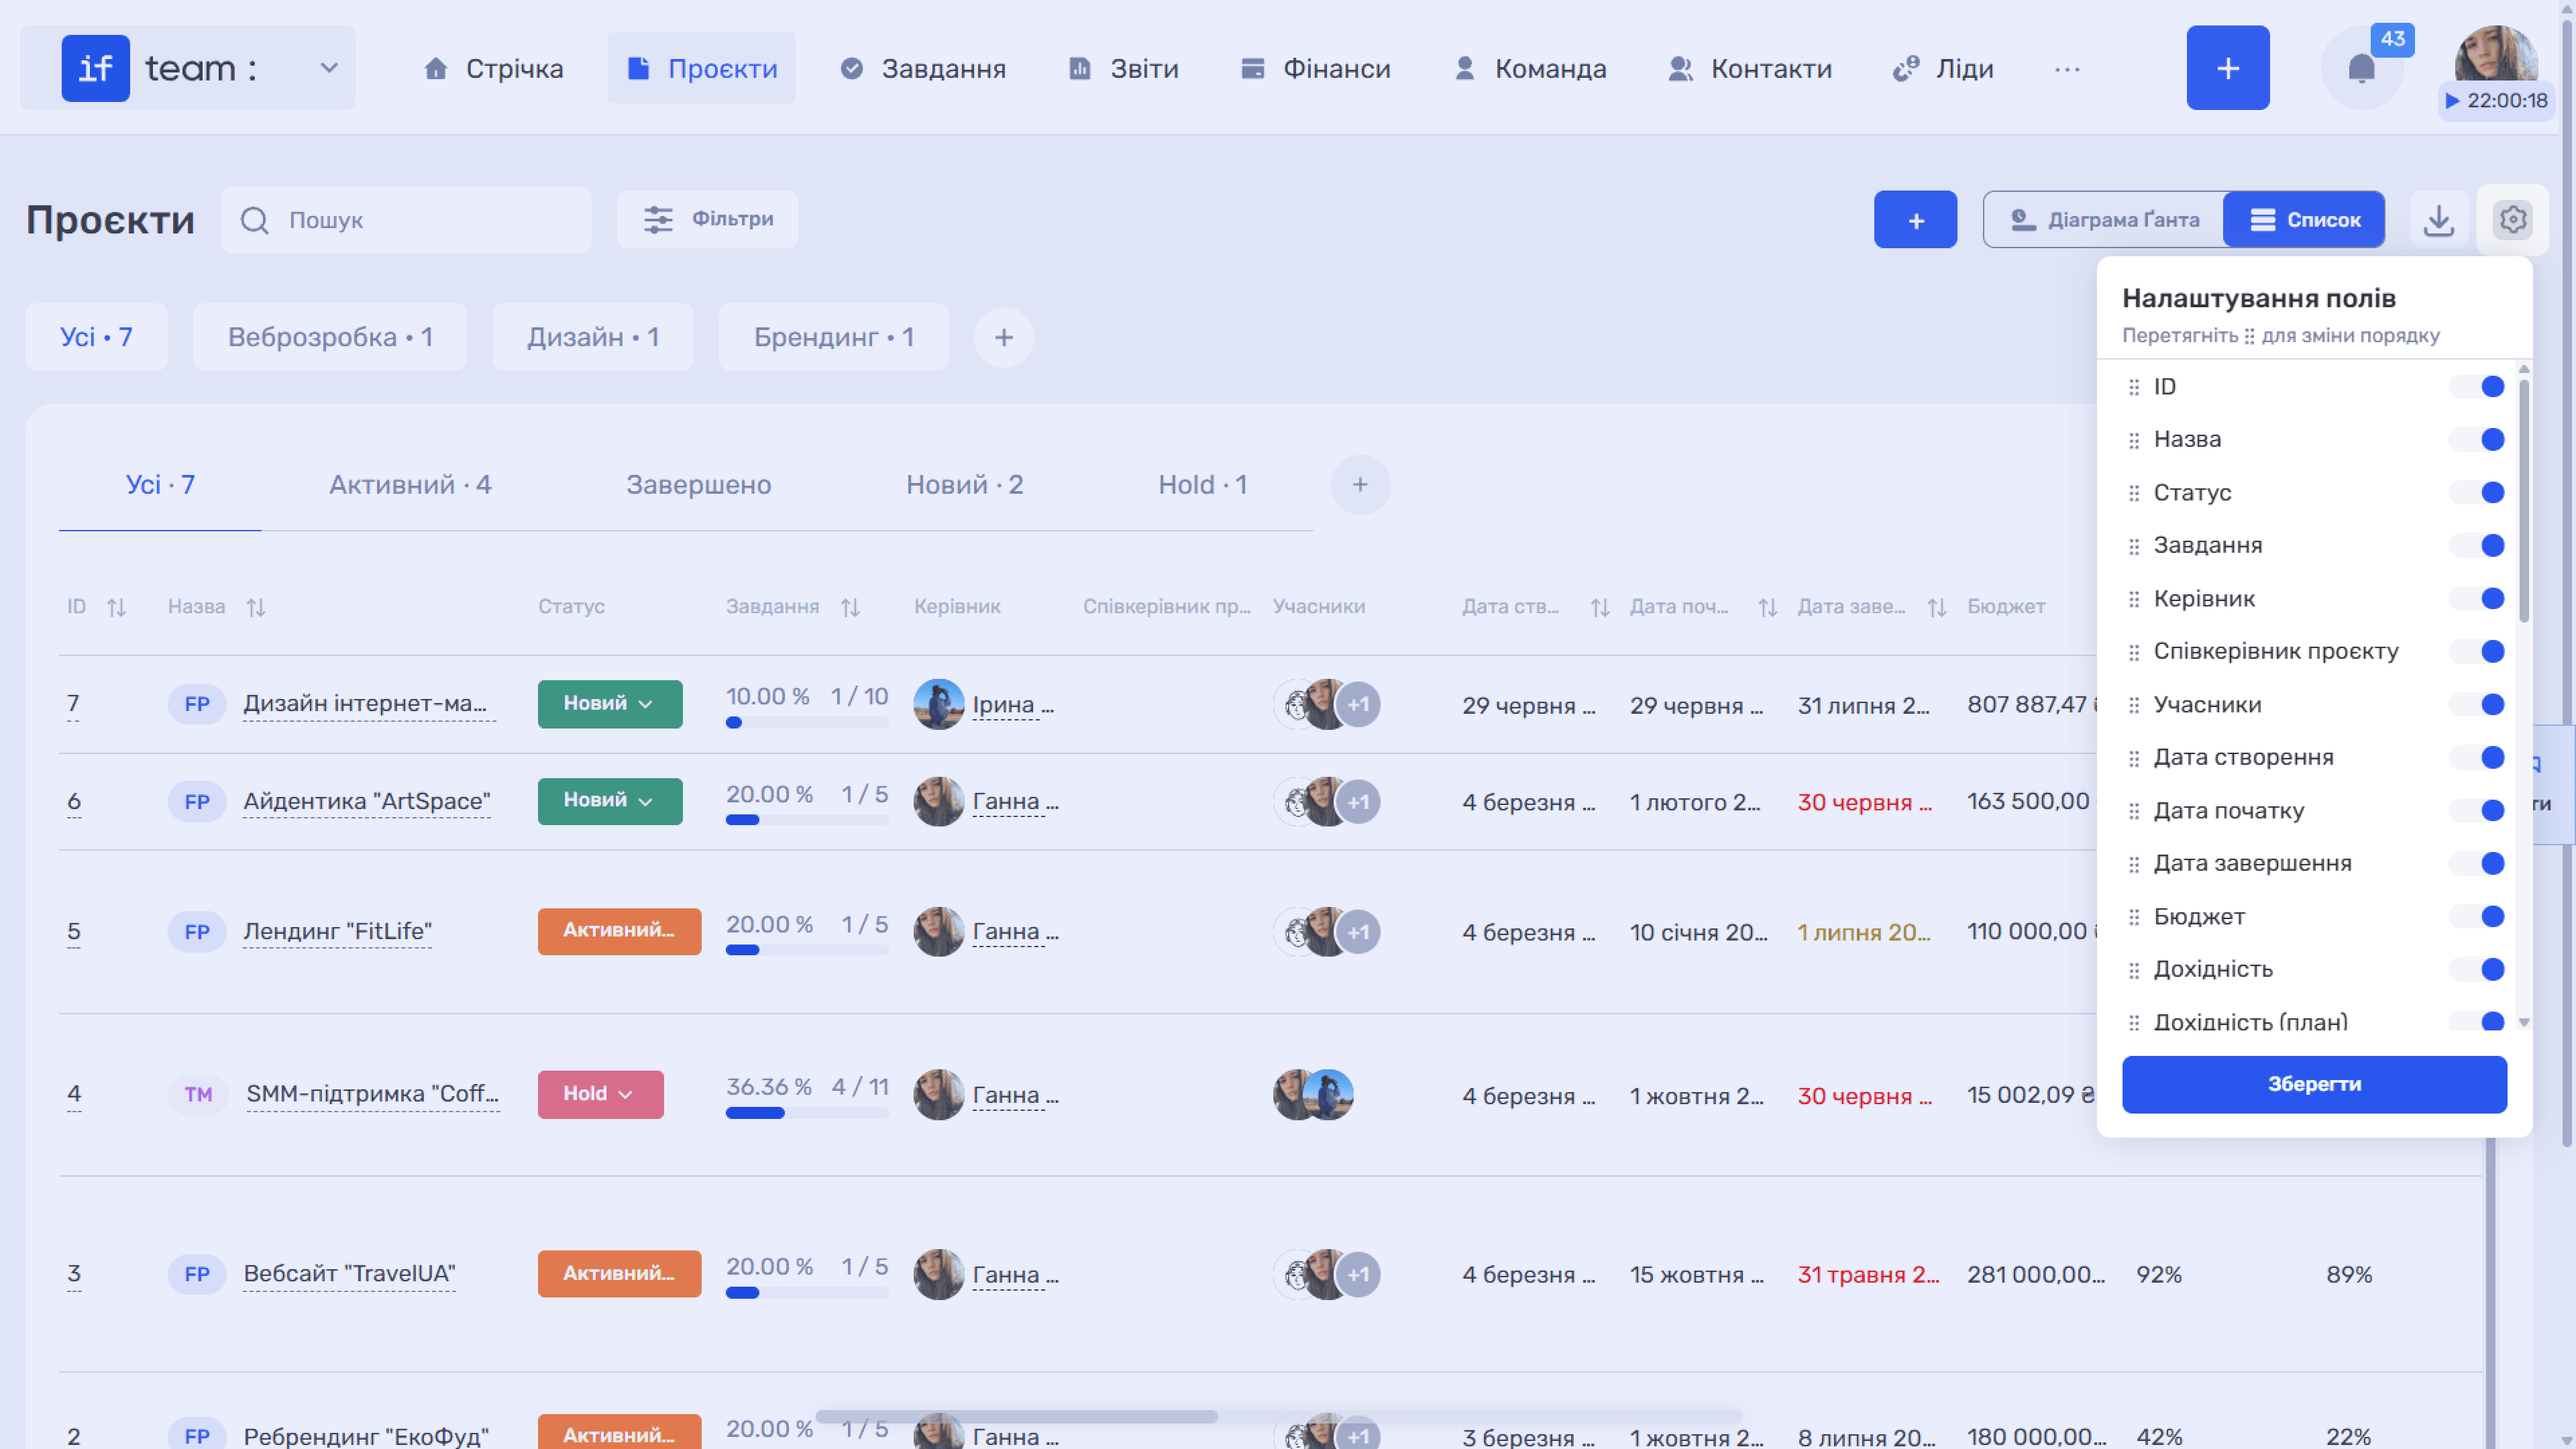
Each table row represents a separate project and its key data: task state and count, participants, profitability, finances, iteration progress, dates, and status. The list works as a complete analytics dashboard.
The project status appears as a colored badge in the Status column. You can change it directly from the list by clicking the badge and selecting a new status.
You choose which columns to display. Click the gear icon (⚙) in the upper-right corner to open the Field Settings panel. Here, you can turn any column on or off with a switch and drag fields by the ⠿ icon to change their order. After making changes, click Save.
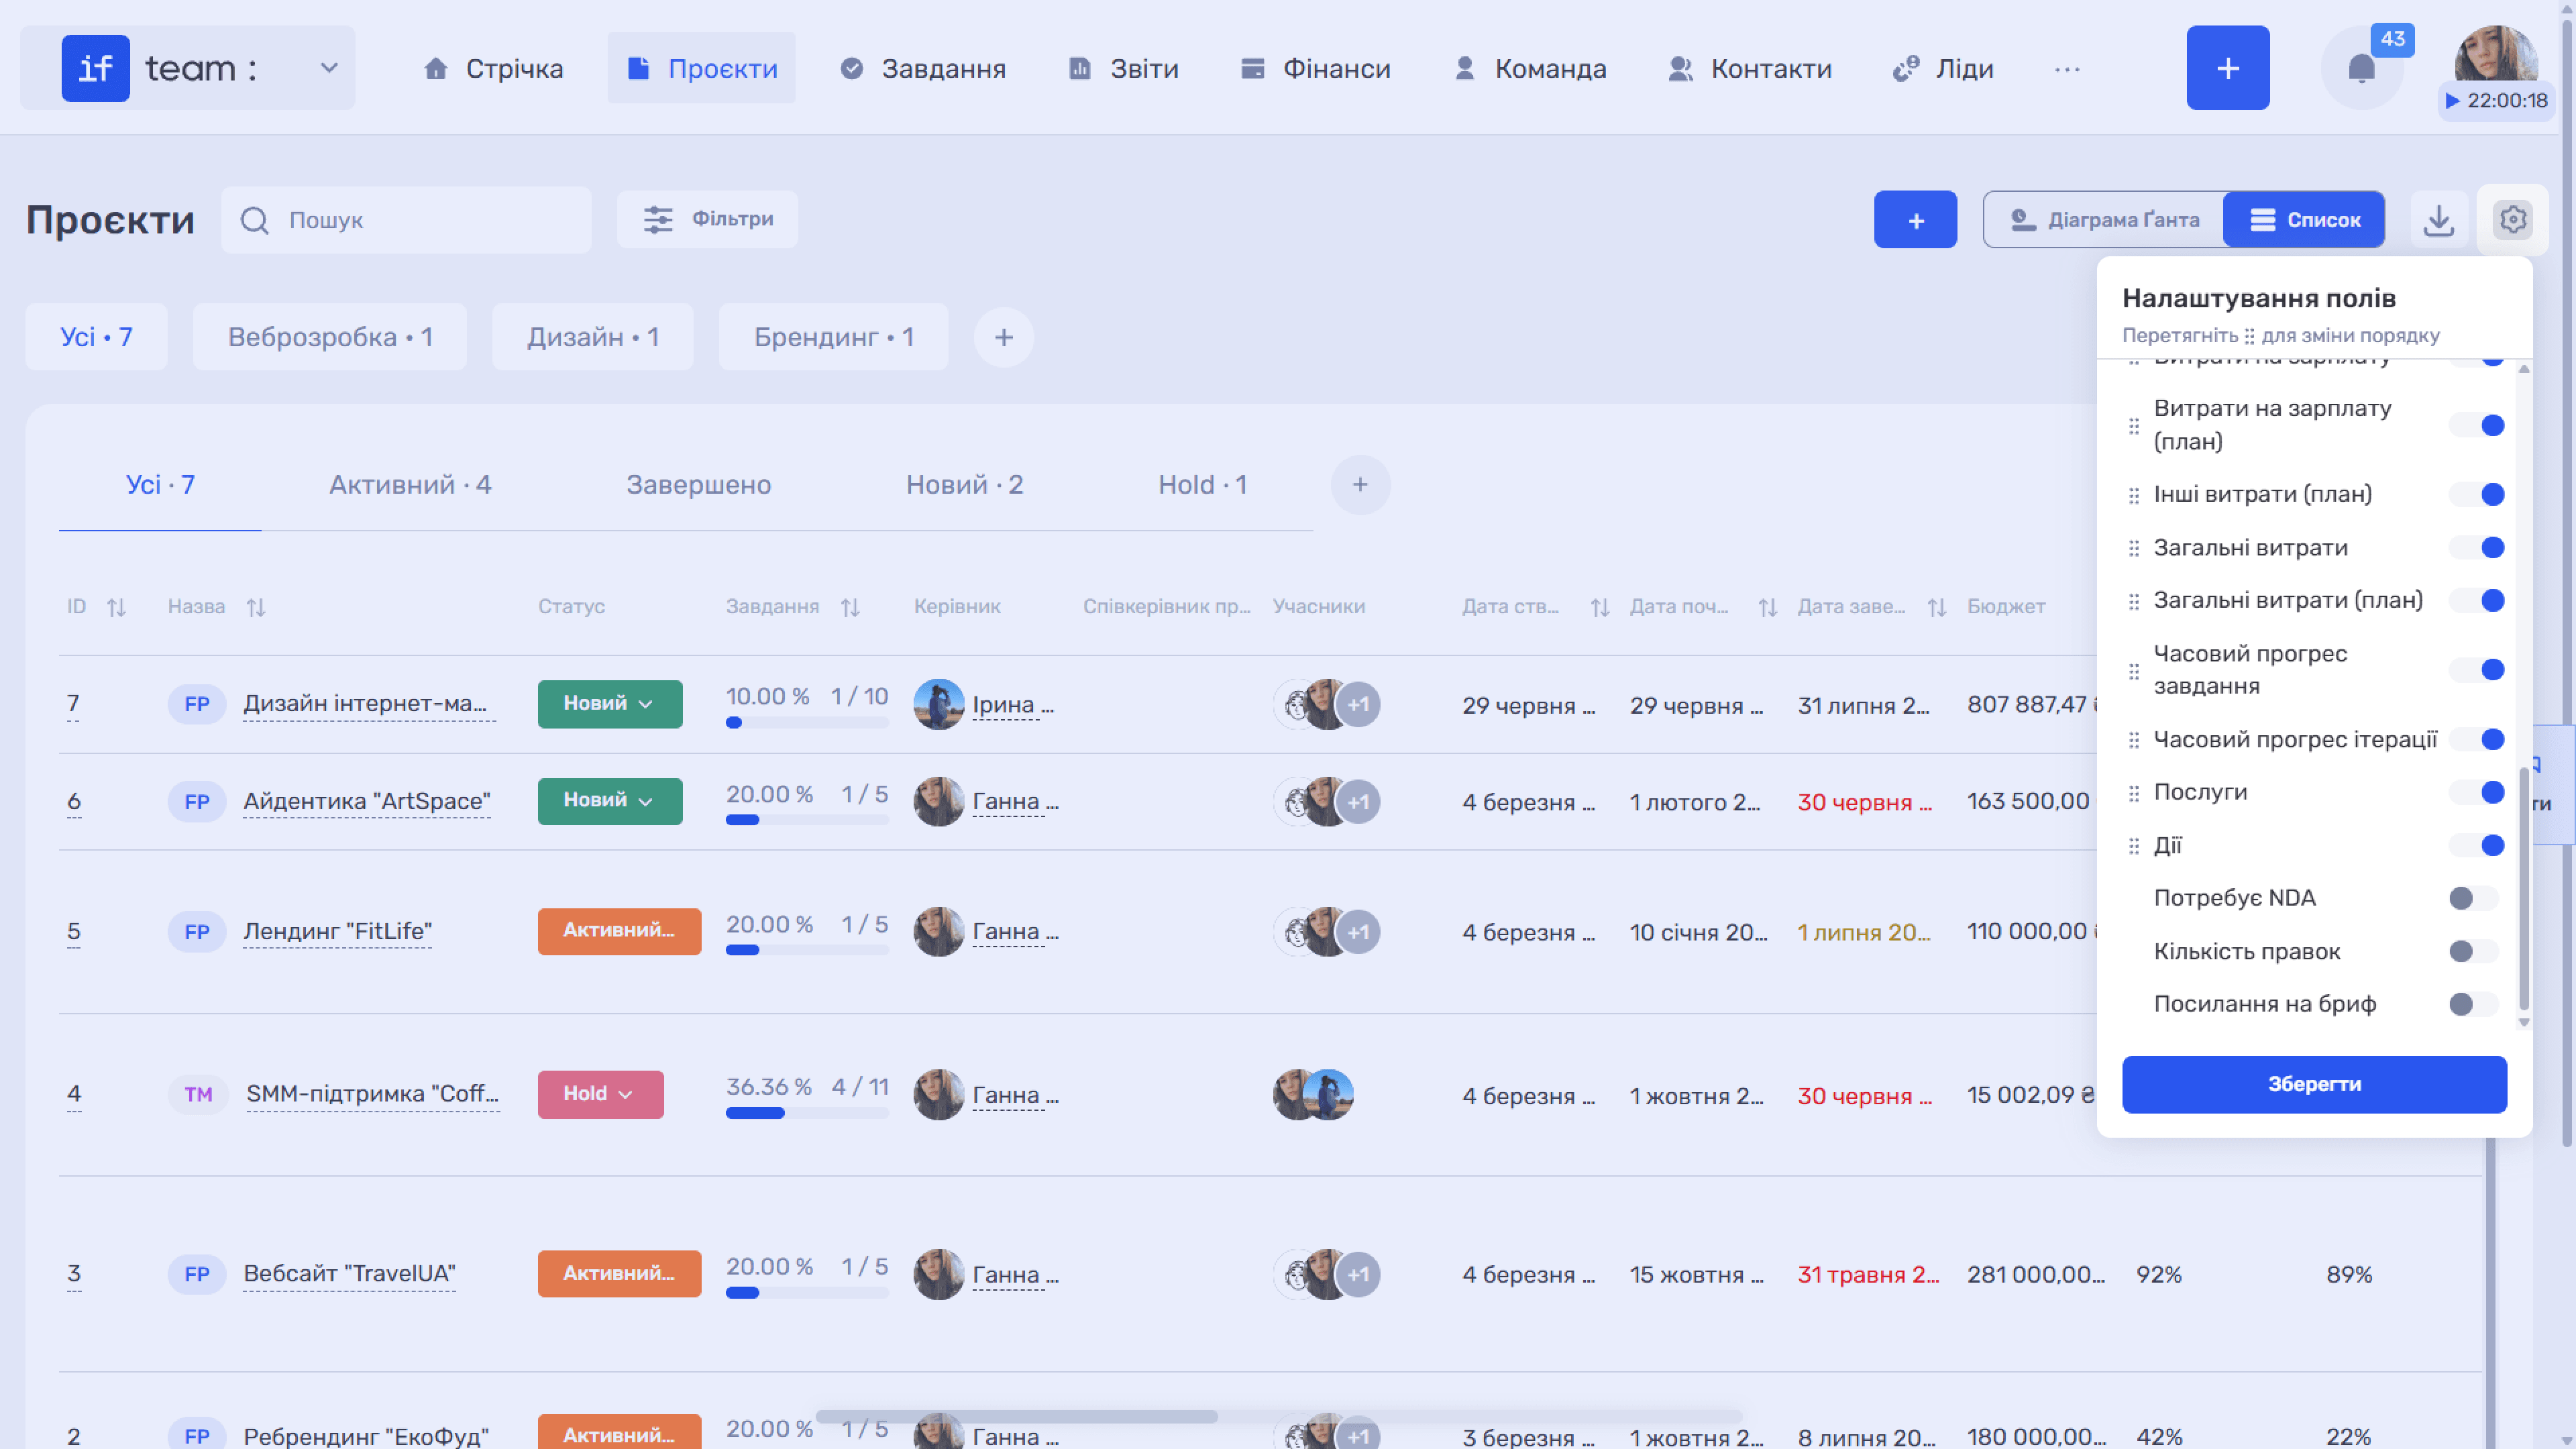
Available fields include:
- Main fields: ID, Name, Status, Tasks, Participants, Contact, Project Manager, and Project Co-manager;
- Financial fields: Actual and Planned Profitability, Budget, Budget Used, Payments, Salary Expenses, Other Expenses, and Total Expenses, each with actual and planned values;
- Progress and dates: Iteration and Task Time Progress, Creation Date, Start Date, and End Date;
- Services and Actions.
Custom fields created for projects are also available here. Simply enable them using the switch.
Sorting
You can sort projects directly in the table. Click a column heading with the sort icon (↕). Sorting is available for supported columns: ID, name, task count, project creation, start, and end dates, and budget usage, including payments and expenses.
Filtering
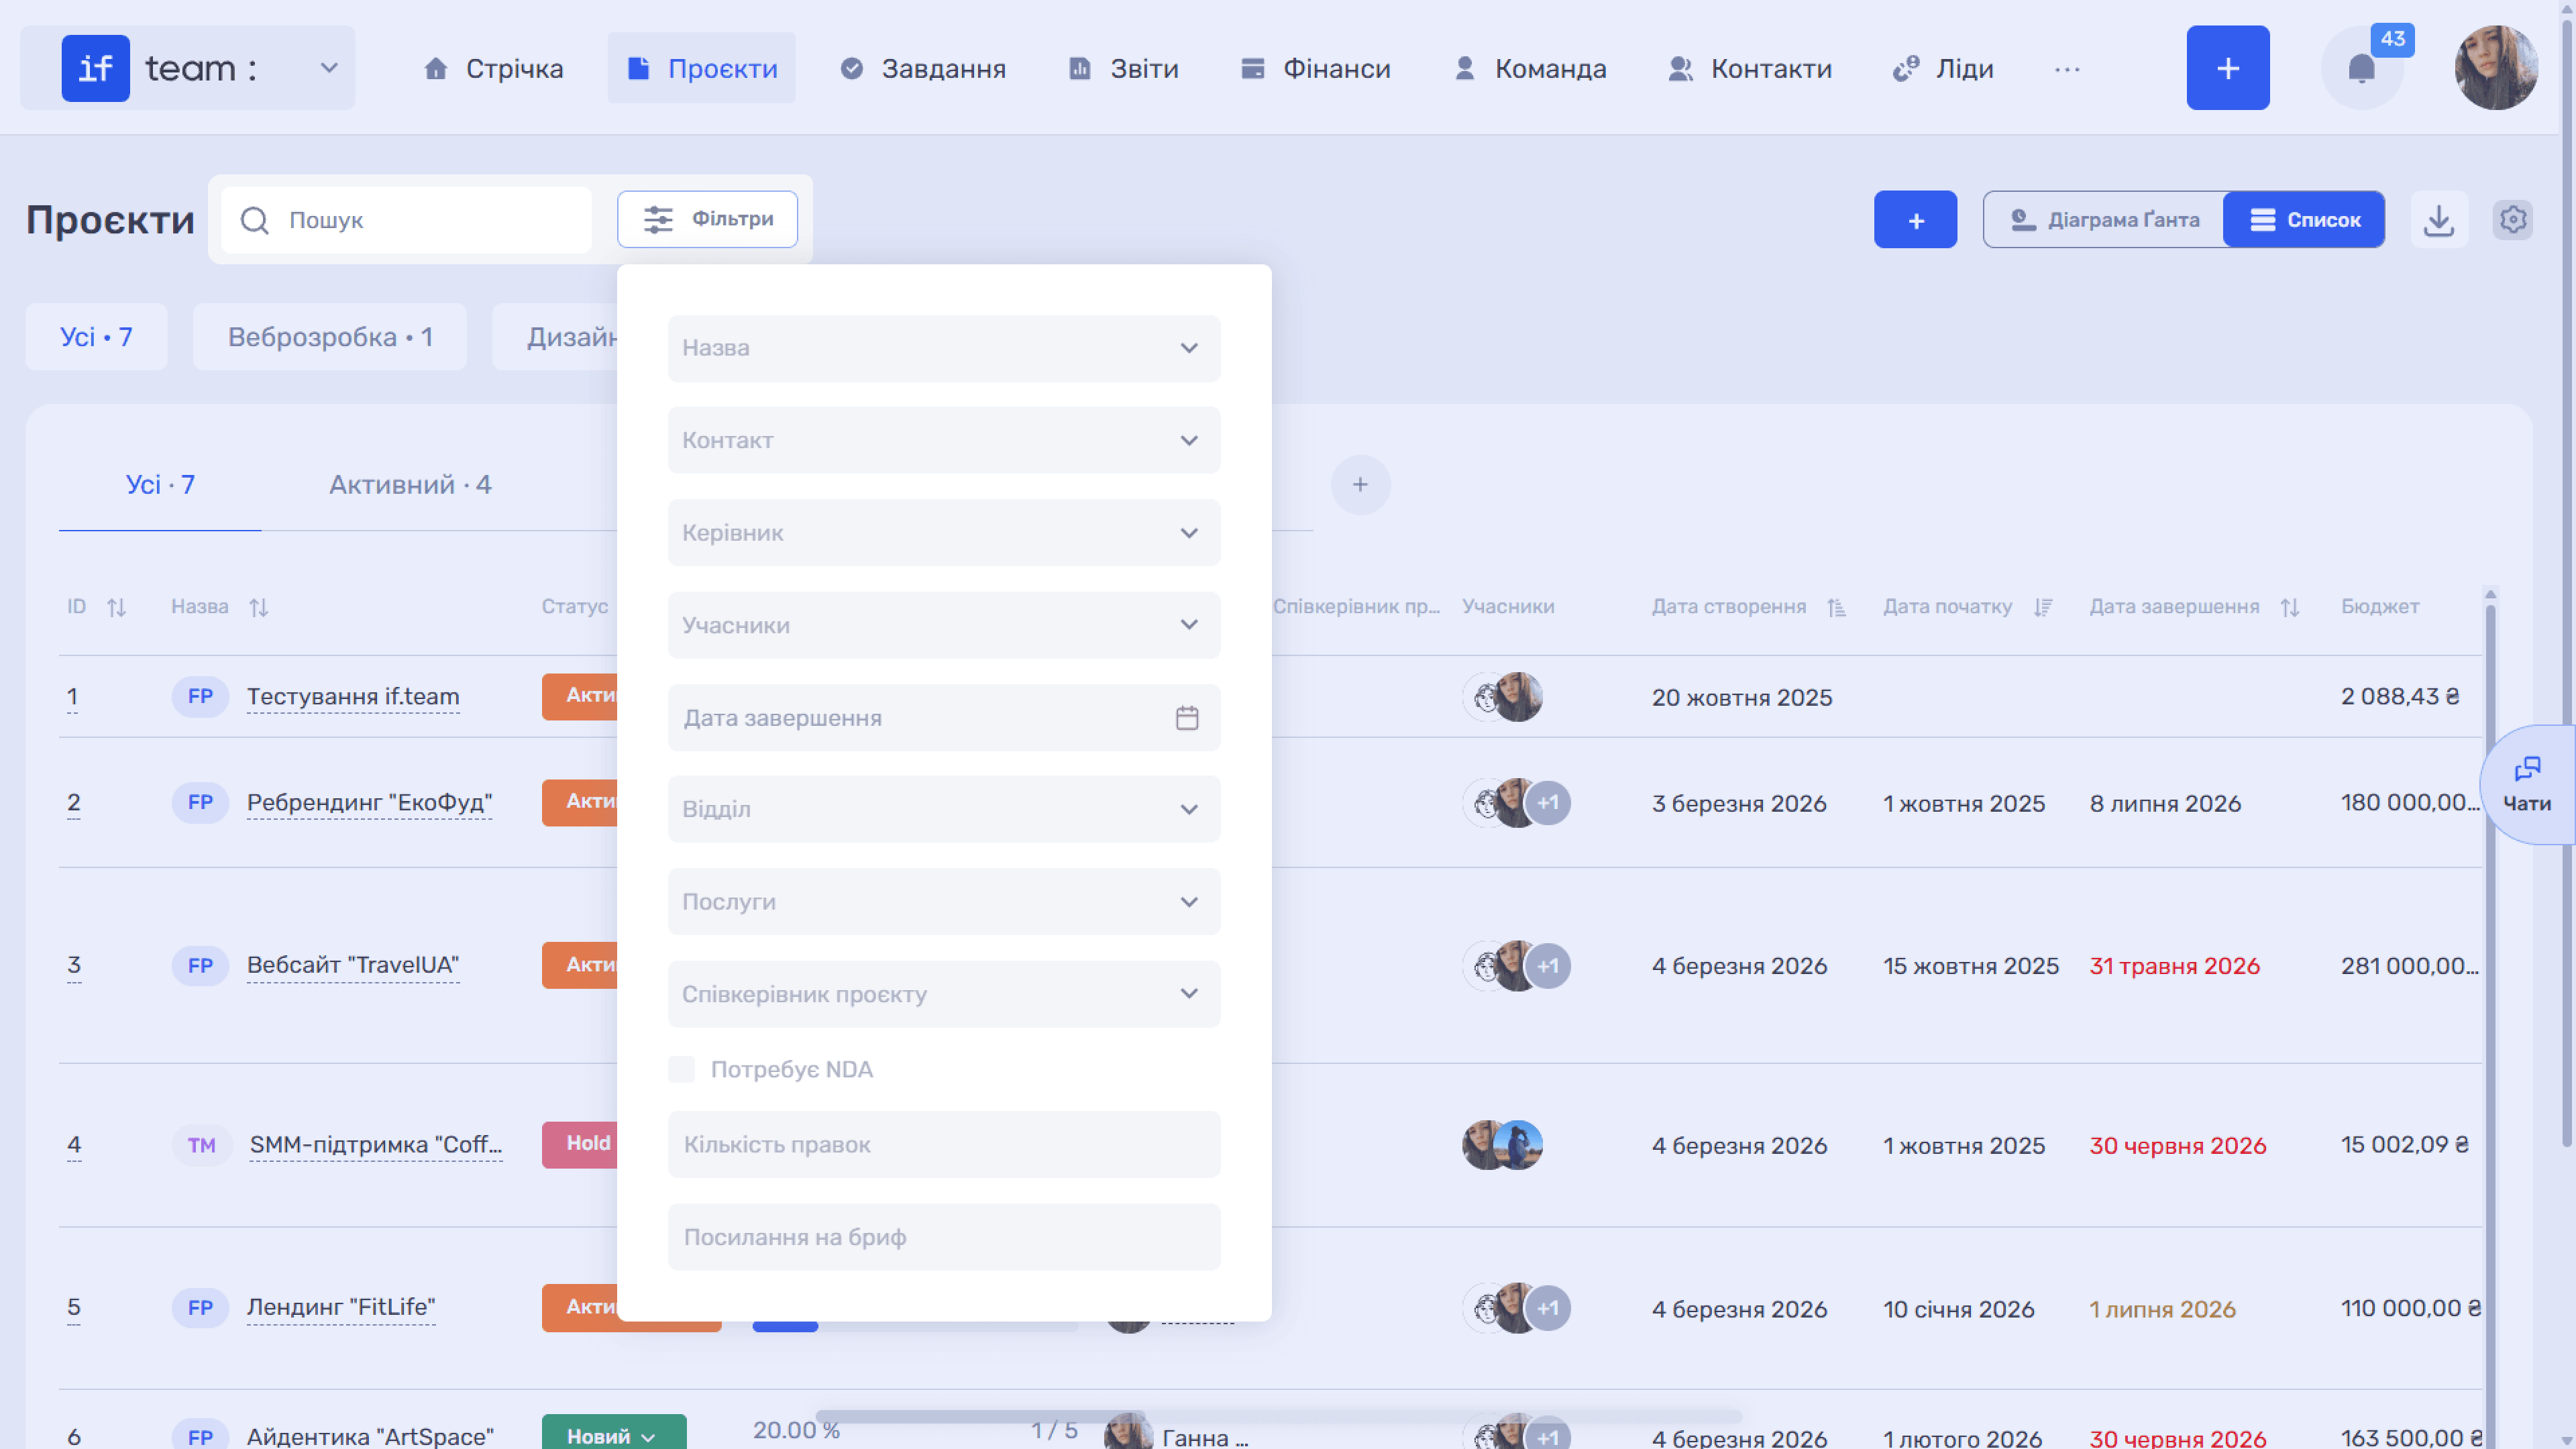
Click Filters to narrow the list by specific criteria. In List view, filters are available for name, contact, project manager, project co-manager, participants, end date, department, services, and project custom fields.
Please note
Note: projects are not filtered by status here. Use the status tabs above the table instead (see Project Statuses).
Project Statuses
Statuses appear in a separate row of tabs above the table. The number next to a status shows how many projects have that status, and switching tabs filters the list accordingly. The + button (Add Project Status) creates a new status.
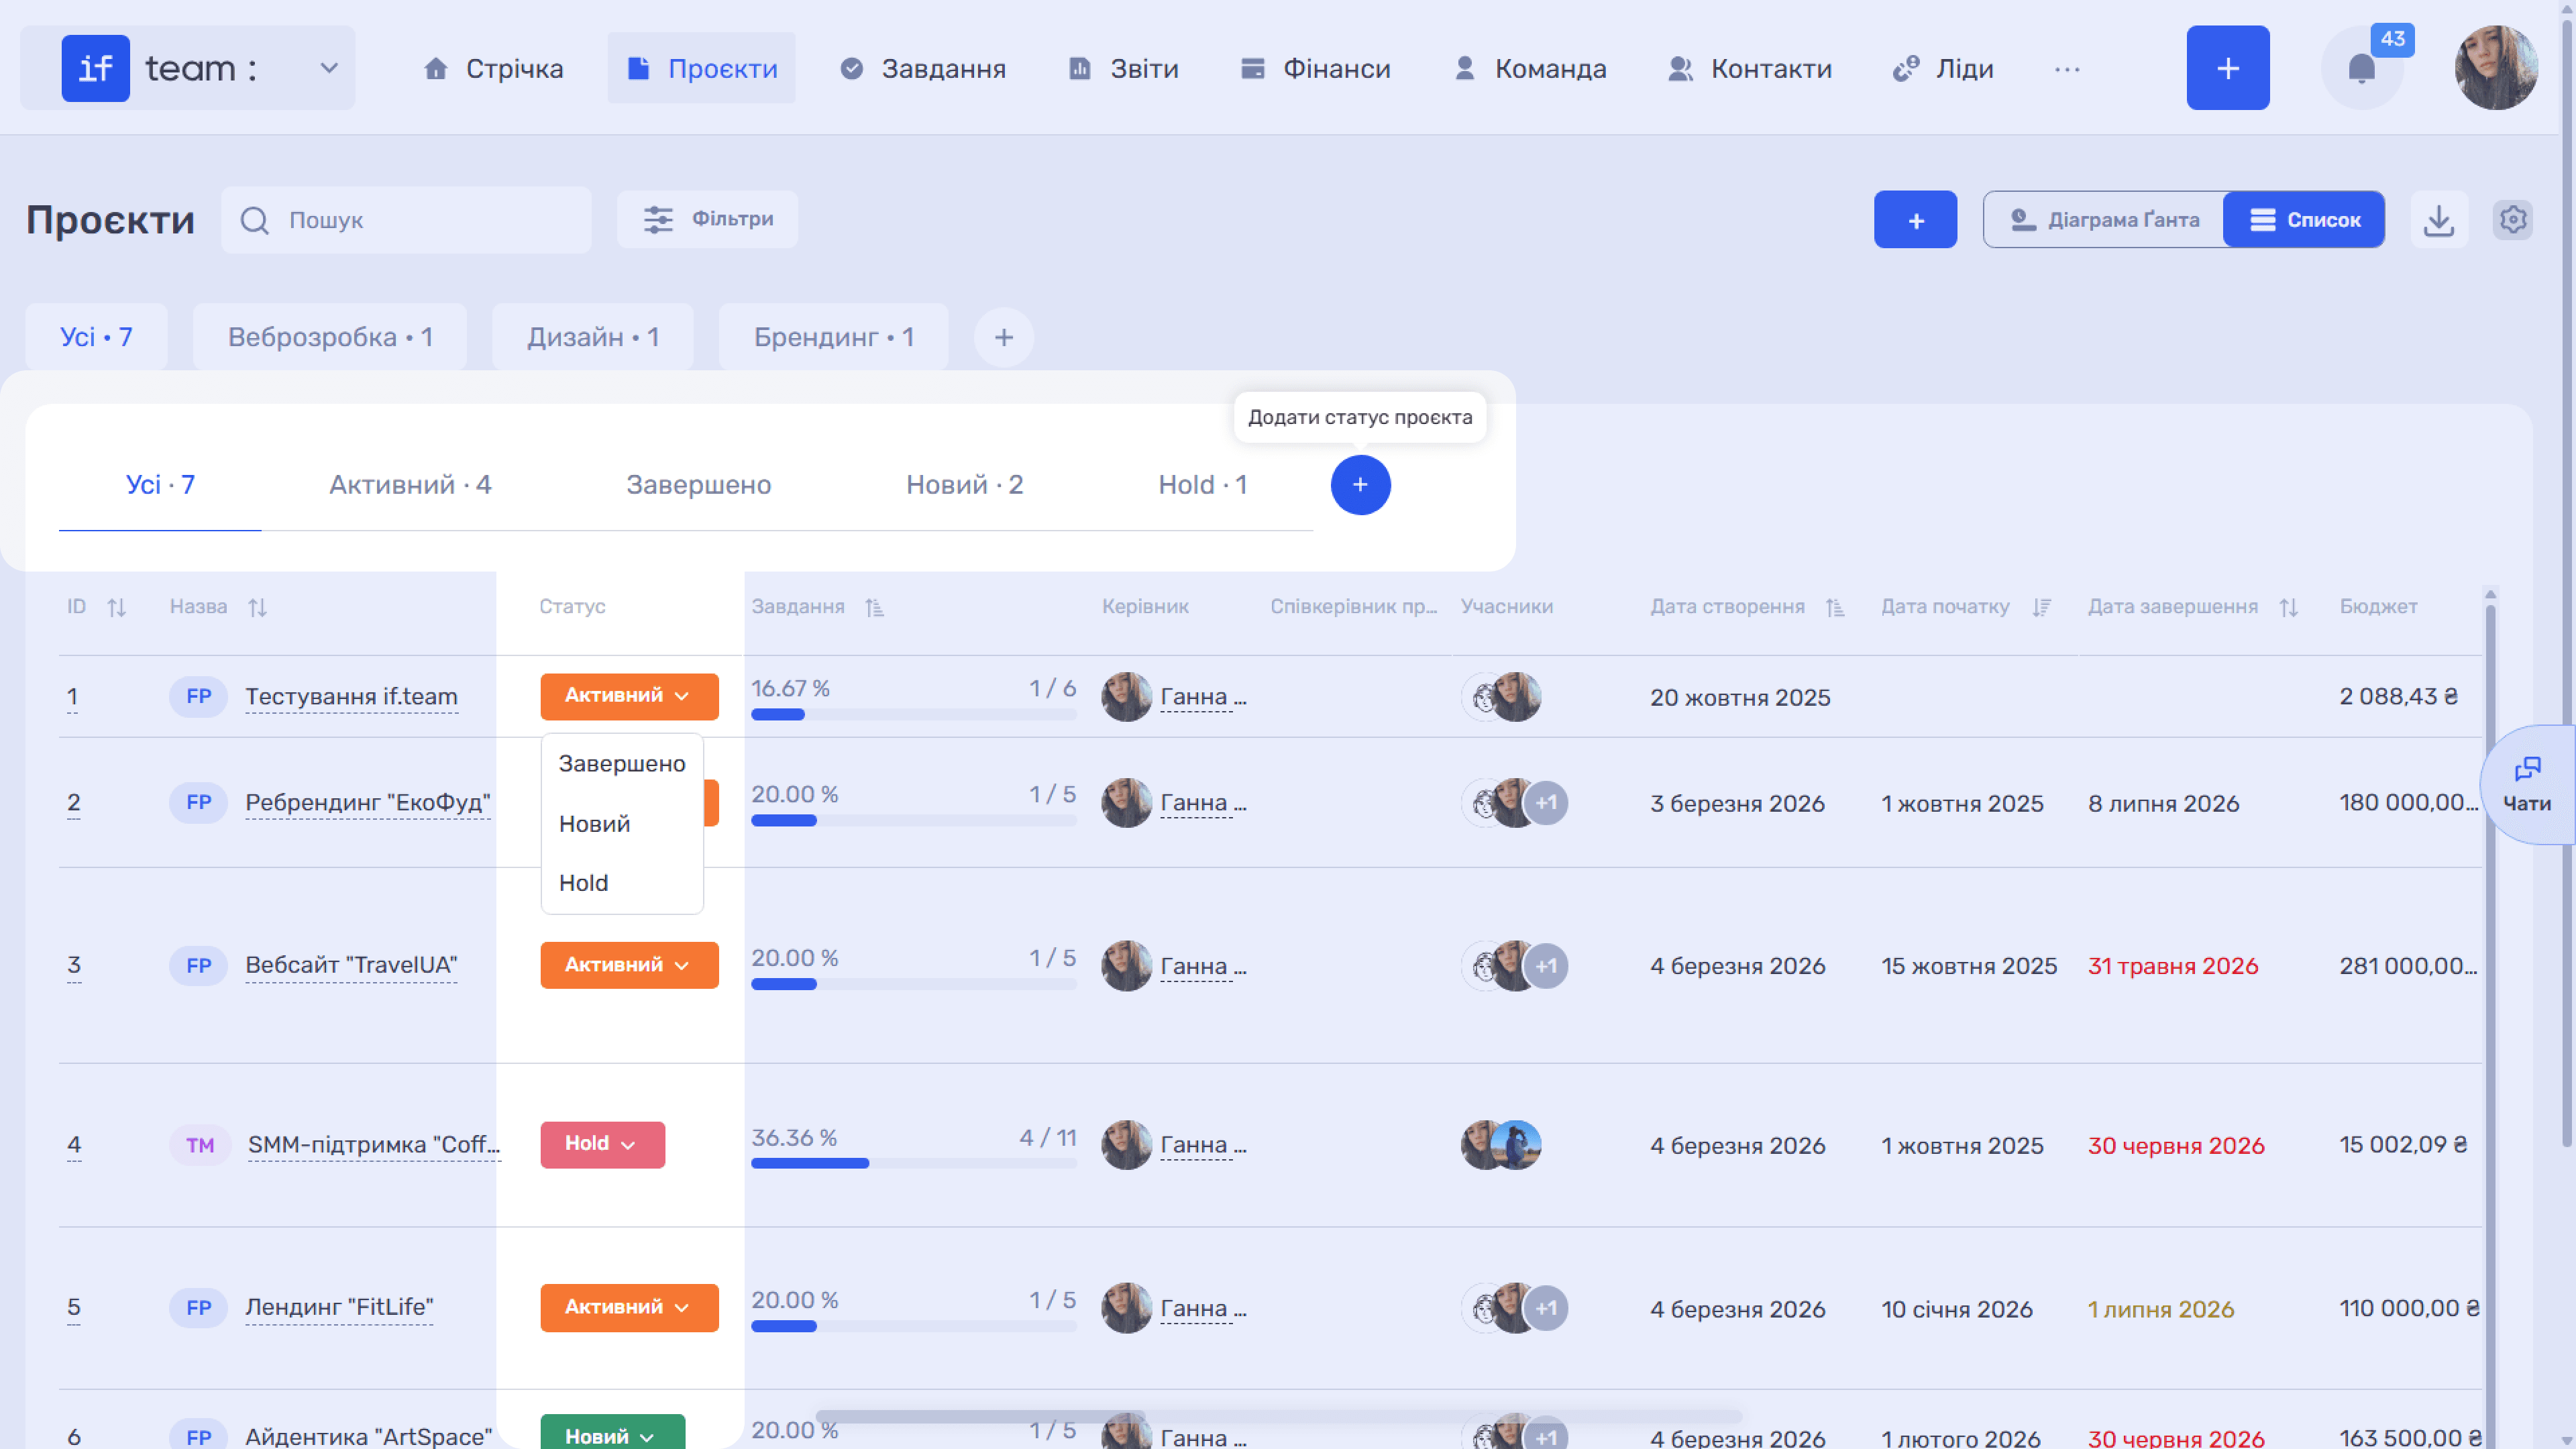
Each project’s status appears as a badge in the Status column and can be changed directly from the list.
In addition to the default statuses, you can create custom statuses that match your team’s processes under Settings (Tasks & Projects → Custom Fields for Projects; for details, see Custom Fields for Projects).
Still have questions?
Maybe we haven't added this information yet. But you can always reach out:
Request a demo
Submit a request and we'll show you how the service works and its capabilities.
Book a demo