What Are Reports
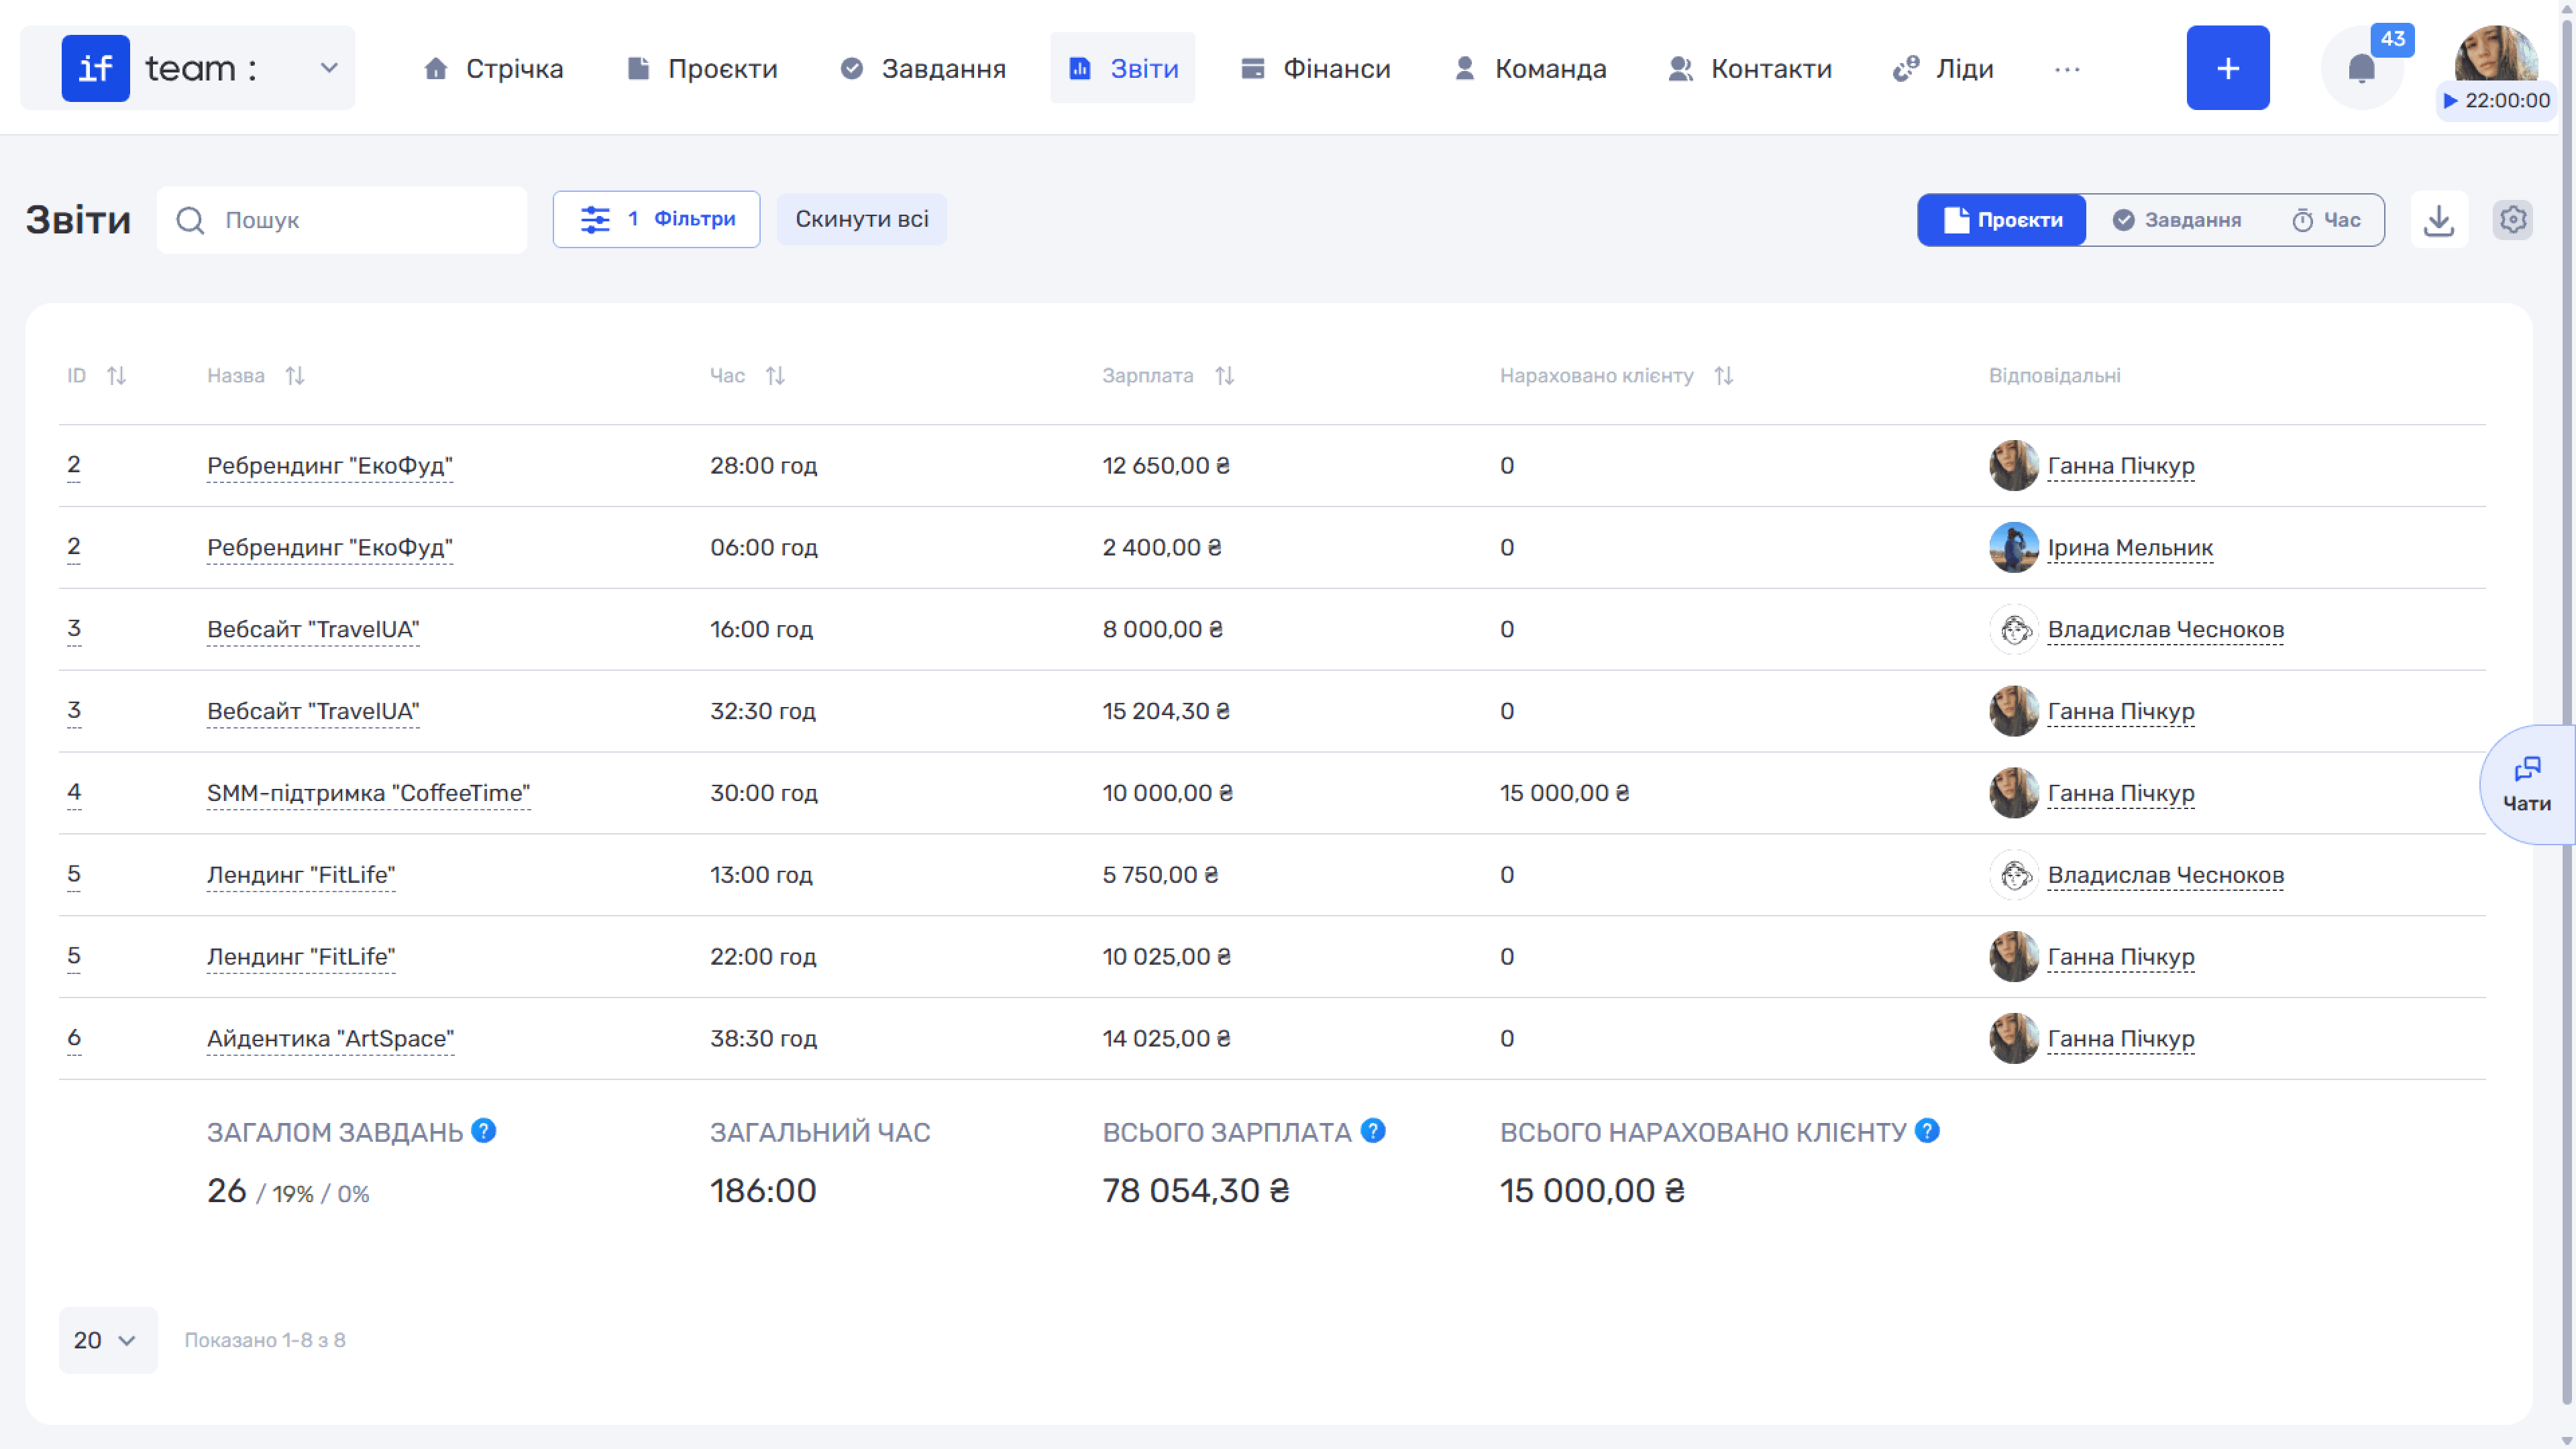
The “Reports” section brings together analytics on your work: time worked, salaries accrued to employees, and amounts payable by clients. Based on time-tracking data, the system automatically generates reports for the selected period. They are useful both for internal analysis and for billing client
You can view the data in three breakdowns by switching between the buttons in the upper-right corner: “Projects,” “Tasks,” and “Time.” The following common tools are available regardless of the selected breakdown:
- Search quickly finds rows by name.
- Filters narrow the selection by specific parameters. The available filters differ for each breakdown. The number of active filters is displayed on the button, and “Reset All” clears them.
- Field Settings opens when you click the gear icon (⚙). In this panel, you can enable or disable columns and drag them to change their order. Click “Save” to apply the changes.
- Export to Excel uses the download icon (⬇) to save the current report as an .xlsx file.
The final row of the table always shows totals for all rows. A (?) icon next to each key metric explains how the value is calculated.
Still have questions?
Maybe we haven't added this information yet. But you can always reach out:
Request a demo
Submit a request and we'll show you how the service works and its capabilities.
Book a demo