
Lead analytics: conversion rates, sales cycles, and reasons for lost deals
if.team CRM now has a lead analytics dashboard. It brings together lead counts and values, conversion rates between pipeline stages, response times, average deal size, and sales cycle length. You can also record why leads were lost and analyze those reasons separately.
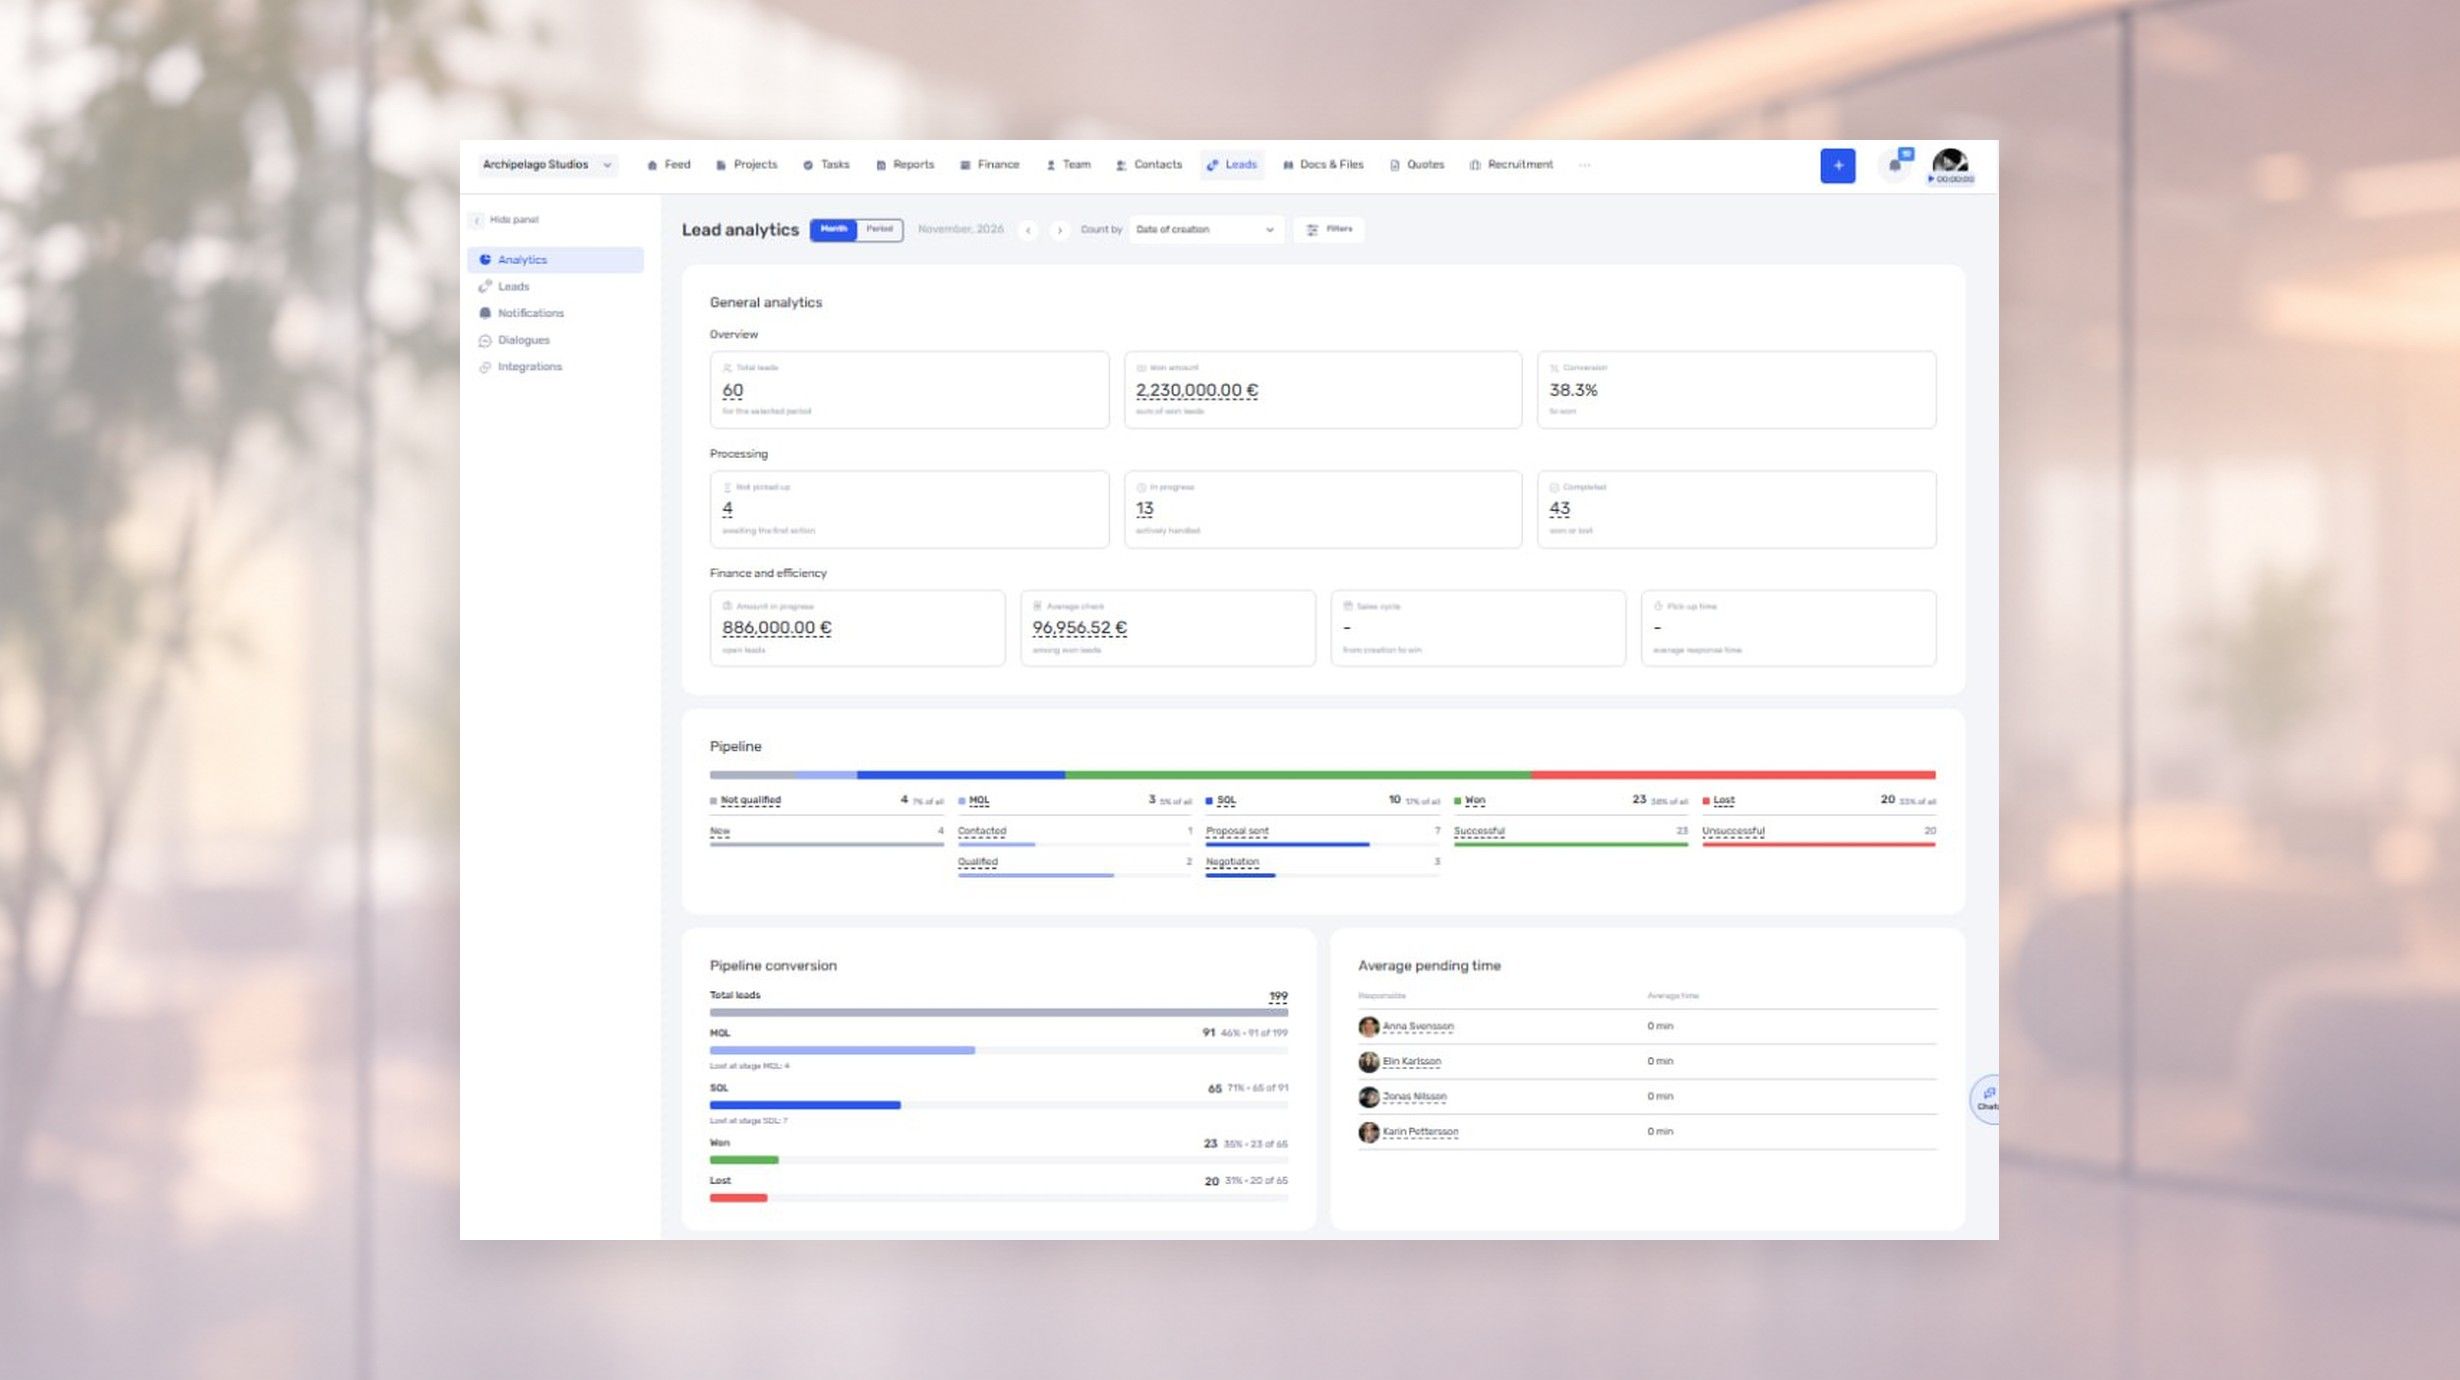
if.team CRM now has a lead analytics dashboard. It brings together lead counts and values, conversion rates between pipeline stages, response times, average deal size, and sales cycle length. You can also record why leads were lost and analyze those reasons separately.
Set up your status groups first
For analytics to work correctly, map your lead statuses to analytics groups in the CRM settings in the admin panel:
- Not qualified;
- Marketing Qualified Lead — MQL;
- Sales Qualified Lead — SQL;
- Won;
- Lost.
This matters when your company uses its own status names. Analytics groups determine how those statuses are counted in the report.
Separate sales pipelines were introduced earlier. The new dashboard shows how leads move through those pipelines and where deals are won or lost.
Review the pipeline and sales metrics
The dashboard shows how leads are distributed by qualification stage, status, and acquisition source. It also displays conversion rates, lead values, response times, average deal size, and sales cycle length.
For example, you can check how many inquiries become sales-qualified leads and where the largest drop occurs. This helps you choose which part of the pipeline to review with the team.
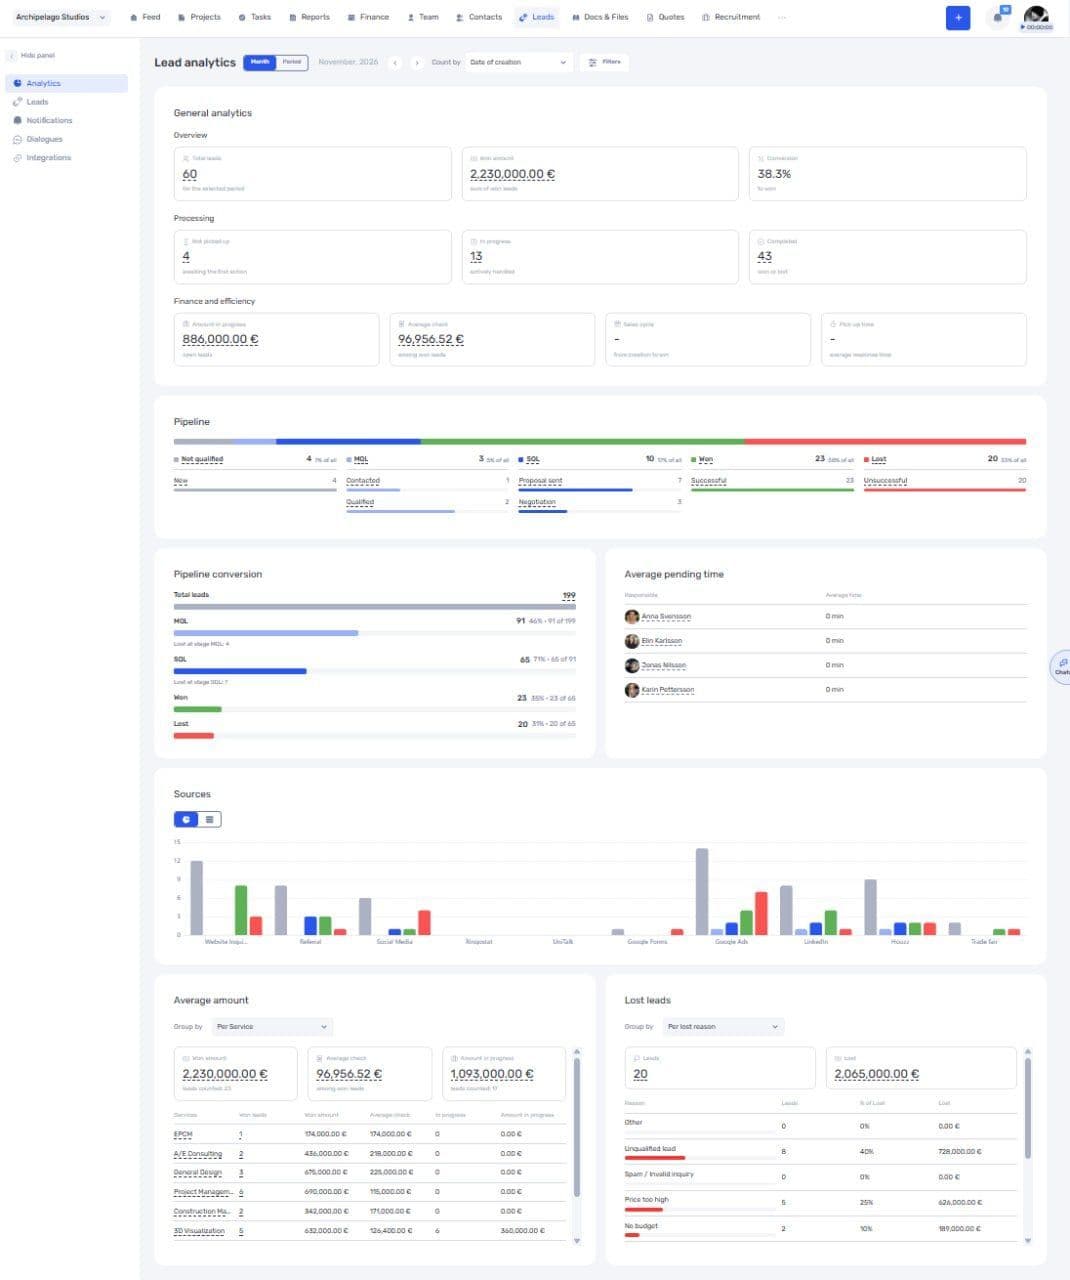
The dashboard brings together the pipeline, conversion rates, lead sources, and reasons for lost deals
Understand why leads are lost
You can assign a reason when a lead is lost. Customize the list of reasons in the admin panel to match your sales process.
Analytics breaks down lost leads by count, value, and pipeline stage. You can see which reason is most common and which accounts for the largest value of lost opportunities.
Keep the metrics you need in view
Choose your widgets, change their sizes, and arrange them on the dashboard. Your team can prioritize conversion rates and sales cycle length, or focus on acquisition sources and reasons for lost deals.
To get started, configure your status groups, define your reasons for lost deals, and arrange the widgets in the order you use when reviewing sales with the team.
New to working with leads? Start with the CRM documentation. For more on organizing inquiries and follow-ups, see our guide to CRM systems.
Author
Vladyslav ChesnokovPublished
Nov 13, 2026
Was this update helpful?
Your feedback helps us prioritise what to ship next.
See if.team in action for your company
We’ll show how projects, team time and finances connect in one system, using your processes as an example.